

Summary
Professor Susanna Horng (Liberal Studies) uses project based learning to guide her first-year Writing II students in the creation of digital maps. Students are asked to research and design an unwritten chapter for one of the following course texts: Maps of the Imagination: The Writer as Cartographer by Peter Turchi, or Nonstop Metropolis: A New York City Atlas edited by Rebecca Solnit & Joshua Jelly-Schapiro. Students use ESRI Story Maps software to create interactive, city-based narratives/digital humanities projects, which interrogate the urban and visualize what it means to be a Global Citizen.
Learning Objectives
- Creative cartography offers multi-modal methods of synthesizing research, narrative mapping, analysis of sources, and data visualization.
- These activities allow students to flex multimedia and presentation skills. Image, video, and sound selection creates meaning or supports text.
- The project engages students’ critical thinking, time management, and executive functioning skills.
- This practice hones students’ digital literacy.
Student Experience
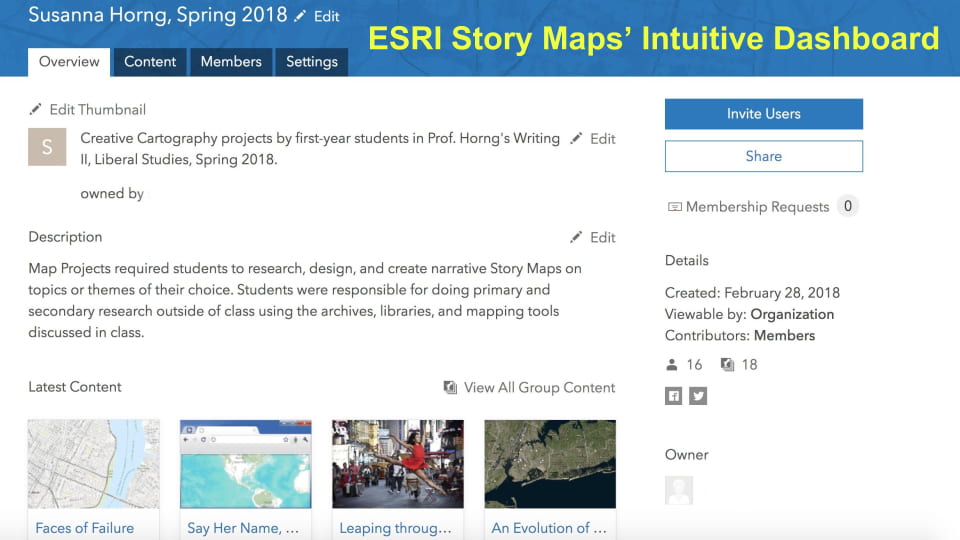
First-year Writing II students are asked to create layered maps with images, videos, hyperlinks links, QR codes, and lyric essays. After instructor contacts Data Services, students are sent email invitations for NYU institutional ArcGIS accounts. Students then create free ESRI Story Maps accounts using NYU Institutional ArcGIS Account. The instructor then creates a private ArcGIS Group for class so students share projects with classmates only. To develop their projects, students work with large amounts of data, longitude and latitude coordinates, and create Excel/Google spreadsheets as research tools.
Technology Resources
- Data is stored in Google Sheets or Microsoft Excel spreadsheets
- Story Maps software:
- Uses ArcGIS (Geographic Information Software) to integrate maps with text, images, videos, hyperlinks, and sound.
- Free NYU Institutional Accounts through Data Services
- Digital Studio, Bobst 5th floor
Outcomes
- Students will synthesize research, analysis of sources, narrative mapping, and data visualization through the practice of creative cartography using Story Maps software.
- Students will create an effective presentation and create meaning through multimedia: image, video, and sound.
- Students will apply digital literacy, critical thinking, time management, and effective functioning skills.