14: Final Project

For the final project, I worked with Daryl Goh to create an audio visualizer that changes pitch based on body movements using JSON data. 

To start, we set the let() variables for later. 

Then, we uploaded the audio file, Fractures by ILLENIUM, in order to set the preload() function to ensure that the audio loads later. 

In the setup() function, we set the canvas size to fit the full web screen of the users’ devices, and set the values for the variables set earlier. Setting the constant for poseNet ensures that the ml5.poseNet data will be input and output, and setting the camera position to flipHorizontal inverts the frame. 
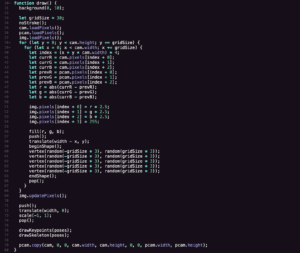
The function draw() part was honestly the toughest part for us. We essentially wanted to create a pixellated grid in order for specific points to be drawn out and controlled, and also to allow those points to control the nature of the audio. First, we loaded the pixels for the camera and the grid, then we created several let() loops in order to allocate colors for the specific colors within the pixels of the camera and grid. We separated the previous RGB from the current RGB in order to ensure that the colors shown are still in real time. Then, we set the img.pixels index to different values to customize them and keep them randomized in the specific frames. After setting the let() and img.pixels commands, we drew vertex shapes to create the geometric design that moves with the body points to create more aesthetics. 

The function gotResults(newPoses) keeps the real-time movements to date. 

We created a function for drawKeypoints(poses), which controls the movements within our body points of the user. We also changed the fill() settings to randomize the color of the key points of the body points. 

In the function drawSkeleton(poses), we essentially made the lines connecting each body point in order to mimic the stick figure, or skeleton. 

Lastly, we created two functions for the music to stop and start. Function mousePressed() ensures that when the mouse is pressed, the music starts, and the keyPressed() function makes the music stop when the space bar is clicked. 

Overall, I learned a lot from this project. In the future, I would maybe add dynamic landscapes to the background that changes the volume or song according to where the body of the user is on the screen. 

Here is the final product and code: project and code
 

Project III. Data Visualization

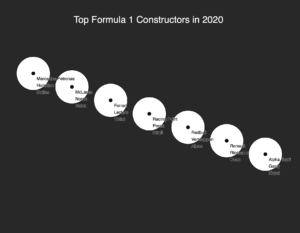
For this project, we were working with data visualization and implementing JSON data files into the code. I decided to visualize the rankings of F1 constructors and drivers based on the 2020 race results. 

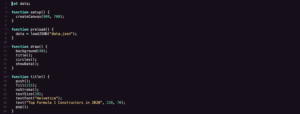
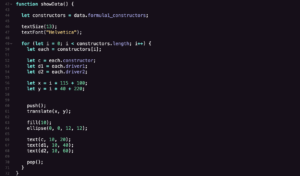
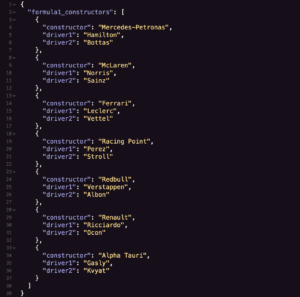
The first steps I took were uploading the JSON files and setting up the normal setup() functions. As shown above, I set the data as Mercedes-Petronas, McLaren, Ferrari, Racing Point, Redbull, Renault, and Alpha Tauri, as well as their main drivers. While there were other teams, I decided to exclude them as they were doing too poorly during this season. 

I then set a preload() function to load the data in the JSON files and a draw() function to show the shapes I will be drawing later. I then set the title() function for the title at the top of the drawing, and set the attributes for the text such as the font (Helvetica), text size, and color. 

The next step was to create the ellipses for each category to go into. To create the diagonal striation to differentiate the rankings and constructors, I set the ellipse coordinates and set all the dimensions the same. 

This part was harder for me to figure out. This makes the data appear and show up on the final product. I set a for() loop and set the variables for each constructor, Driver 1, and Driver 2. The text() function differentiates and makes sure that the text for each data point isn’t all in one string on each circle. 

The last part was the most challenging for me, as I couldn’t figure out how to make the data points even appear at first. However, with Moon’s help, by adding the console.log() function for the attributes that we set to the variables constructor, driver1, and driver2, as well as setting the values for the x-value and y-value (xconstructor and yconstructor) respectively, we allow the values to properly show up on the project. 

In the future, I would expand on this by adding more striation, and maybe even using other JSON data to input more accurate data such as the points earned by each team and driver. I would also add an interactive element to it, such as making it an interactive timeline to see the progression over the years (2016-2020?). Overall, I learned a lot from this project. 

Here is the final code: code
Case Study II. Data Visualization

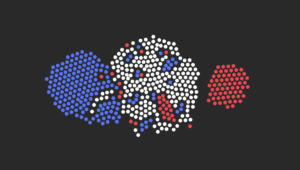
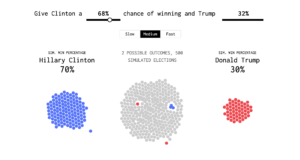
For this case study, I am trying to explore data visualization. The project I chose explores the election results from 2016, Hilary Clinton vs. Donald Trump. 

This utilizes the data and categorizes the voter election turnouts based on who voted for who as well as who is predicted to be undecided or voted for. This is based on the popularity vote, as opposed to the electoral college vote.

The animation utilizes the data and categorizes them to create the percentages for each canditate’s turnout. The bounces for the balls gravitates towards the outer clusters from the inner cluster, which slowly changes colors as the votes change. 

For my own project, based on this, I can utilize the 2020 election data and try to instead of making the balls bounce from cluster to cluster, just make the colors simply change in a single cluster. By implementing the JSON data, we will be able to get it to visualize and I think it would turn out well. 

Here is the link: case study 2

10.R JSON Visualization

For this, we had to code body points with the JSON formatting style.
To start, we had to set the attributes for pose and body points. Then, we preloaded the JSON file in order to properly load the file, which contained the body points. 

In the setup() function, we had to set the for() function so that it lets each body point be attributed to the pose.bodypoints. We also set the console.log() for each part to be separated from the rest and load it in the console. 

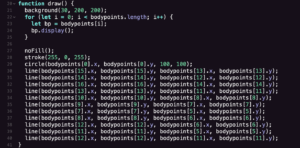
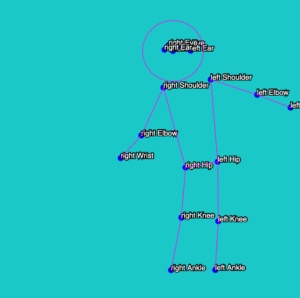
In the draw() function, we set the background color and another for() loop in order to let the body points be set to display and set the length. Then, we set circles for each body point that was assigned in the JSON. After, to create the lines, we set body point x and y values to be correlated to the circles and connect each individual point to each other. That then creates the skeleton outline that is presented on the actual code. 

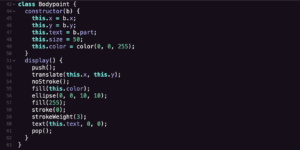
In the class body point(), we set the constructors for the points to actually present the circles and lines. 

Overall, next, I could clean up the lines and make them more connected and create a real body outline, instead of the singular skeletal lines. 

Here is the final code: code
9.R Generative Interactive Portrait

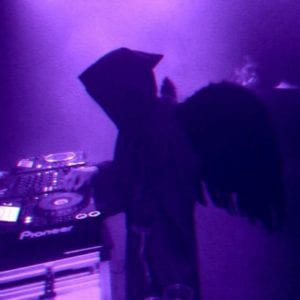
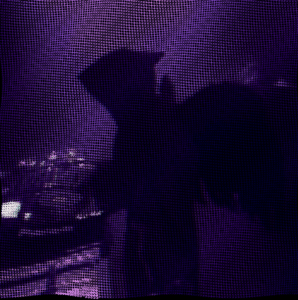
For this project, we had to basically render an image using generated pixels. I decided to use a dark purple grim reaper with angel wings playing with music turntables and a dj setup. 

Here is the original: 

To start, I used Moon’s code for inspiration and changed the characters to suit the final picture completely. I put the image from Google into assets, then took the link and inserted it into the code. 
In the setup, I set the canvas to fill up whatever the window size of viewers is, and resized the image to be bigger. 

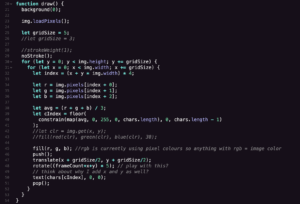
The draw() function is where the pixels are oriented and the wave graphic animation is put in. I played around with the grid size and settled on 5, which is basically the size of each square in the grid, which one belongs to each “pixel”. The for() loop assigns the each pixel to the square in the grid, and the map() function in the constrain() will help in iterating a color to each pixel based on the colors of the original photo, which is what fill(r, g, b) does. The translate() and rotate() functions create the waving effect on the drawing. By adding the +x to the rotate function, we tell it to move horizontally. The text() function sets the characters we initially set up as what shows up for each pixel. 

In the future, I hope to add more interactivity to it, such as making the pixels explode and return to their initial place when you click the mouse or press the space bar, and center. 

Here is the product: code 

8.R Interactive Experience Project

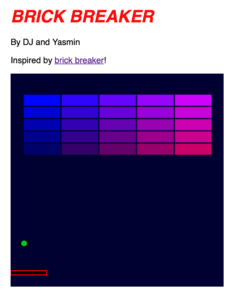
For this project, I worked with my partner, DJ, to recreate the brick breaker game. Here is our inspiration: brick breakerIt seemed so simple from the appearance, but creating it was much harder than I expected. 

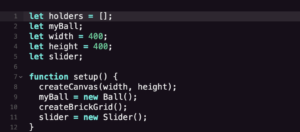
To start, we set our initial values and did the typical setup(), adding createBrickGrid() and a slider. 

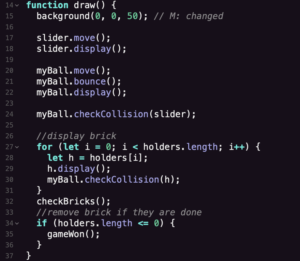
In the draw function, we set the attributes for slider and myBall to give them actions. To display the bricks, we set a for() loop and added a collision asset, then added the function to remove bricks when they are hit by the ball.

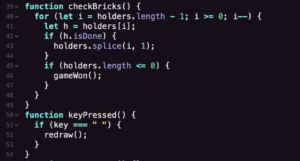
The function checkBricks() activates the code in the draw function, setting it so the bricks disappear. We also added the if() statement to display the gameWon() if there are no more bricks. Then, we tried to implement a keyPressed function, but it didn’t really work. 

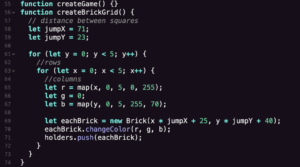
Next, we created the brick of grids. Instead of adding each brick individually, we decided to create an array. To do so, we set the distance between each square with the let jumpX and jumpY functions, then set a for() loop to limit the number of bricks to 0-5. Setting the RGB values created the ombré color in the bricks. 

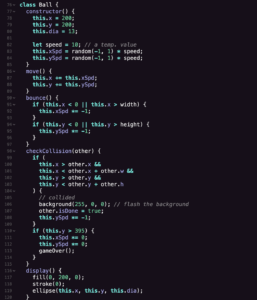
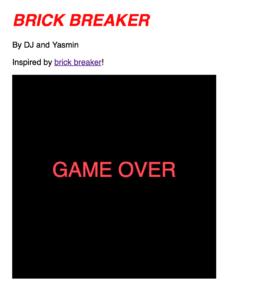
Next, we created a constructor class Ball for the ball. We set this.x, this.y, and other this.variables, then set the values for them too. Move() controlled the general movement/speed, bounce() makes it bounce off the four walls instead of going off the screen, and display() controls the appearance. The checkCollision(other) function utilizes an if() statement to check for the collision of the ball and brick. We also set another if() to check for whether the ball hit the floor, and if so, it displays the gameOver() function. 

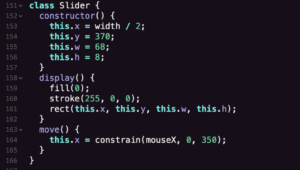
We then set a constructor class Slider, making the platform’s x-value be controlled by the mouse. 

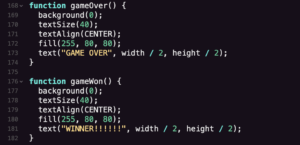
Lastly, we set the gameOver() and gameWon() functions to display the features when the game is lost or won. 

Overall, the hardest parts of this were displaying the gameWon() function, randomizing the ball movement, and creating the array of bricks. If we were to continue this project, we would add our own twist to it, rather than simply trying to imitate the initial game. 

Here is the final product:   CODE    GAME

6.2 Object Oriented Programming

This week, we learned more about Object Oriented Programming (OOP) and particle systems as well as constructors. To be honest, I still struggle a lot with these concepts and fully understanding how they work. 

For this project, I used Moon’s original example code as the foundation of my code, and started to change different attributes such as color and shape. 

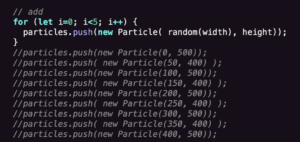
The first part of the code is adding the particles initially. To do this, we used a for() loop function and particles.push() to generate particles from a random point on the canvas. I originally had the code individually push the particles from each point on the canvas, but the process was made shorter with the new Particle() function. 

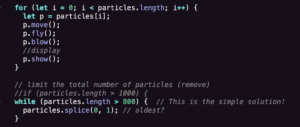
Next, we set the movement of the particles with the p.move(), p.fly(), and p.blow() functions. The p.show() function displays the actual particles. In order to limit the number of particles on the screen, we insert a while() function to set the cap at 800 particles, then pair it with the particles.splice() to make the oldest particles disappear first. 

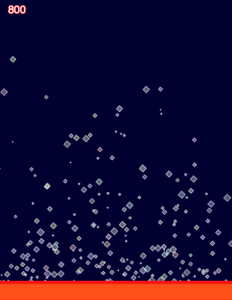
Adding the mousePressed() function allows for user interaction. When the mouse is clicked, the existing particles on the screen will explode outwards towards the edges of the screen. 

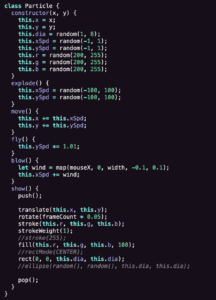
Now we set the constructor and particle class. This basically controls how the particles appear and move on the screen. By setting the values for this.x, this.y,  this.dia, this.xSpd, etc., we allow for the randomization of the appearance of the individual particles (not shown in my code screenshots, but I set the particles as squares). Setting the RGB values at restricted randoms will create diversity within the coloring of each particle. For the explode(), move(), fly(), and blow() functions, we assigned the this() attributes accordingly. Specifically for the blow() function, the map() function allows the particles to be “blown” towards the direction of the mouse on the screen. The show() just controls how it appears on the screen rather than the actual movement. 

I still don’t completely comprehend the code and each individual function, but I’m slowly working on it as I explore and put the pieces together. 

Here is my final code: ccl06-oop-yaz

Project 1: Generative Visuals

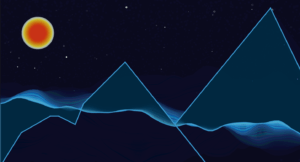
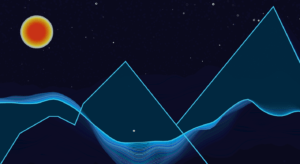
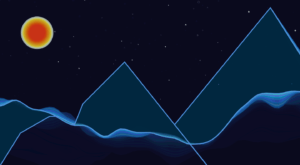
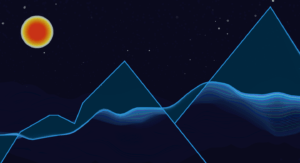
While my original plan was to do something along the lines of a particle system, I decided to create a generative landscape instead, utilizing Perlin Noise waves and adding vertexes to create the illusion of a mountain illuminated by waves. I was also partly inspired by the Northern Lights (aurora borealis), so I decided to put it into the project. 

The first part is the setup, which is the usual, except for an adjusted frameRate (for the later waves). I also added a noCursor() command for the stars, which I’ll go into below, and set a yoff variable, which will be used to control the y-dimensions of the wave.

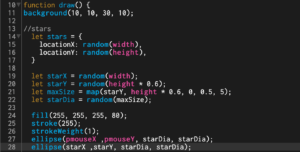
Just adding the stars in was pretty doable, however, I struggled with getting the stars to stop showing up in the actual mountains (the code for which will be shown later). Originally, I had set up a constructor system, however, it didn’t produce the effect that I wanted (I also hadn’t fully grasped the concept), so I tried to set another for loop, basing it off of this example that I found. That still didn’t produce the blinking and fading effect that I wanted. I later (with Professor Moon’s help) added specific variables such as starX, starY, locationX, locationY, and starDia in order to set random locations for the stars and by using the map() function, it avoids the places that have other shapes already, like the mountains and the moon. The starDia variable controls the size of the stars appearing, randomizing them as well. I also implemented pmouseX and pmouseY to create trails of stars when the mouse is detected on the screen. 

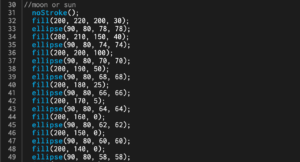
To create an ombre effect on the moon, I simply started with the smallest initial size and added layers of ellipses expanding outwards and changed the color to fade from red to yellow and later white. 

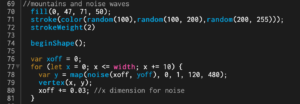
This is the core and the most important of the entire generative piece: the waves. Both the mountains and the waves were actually controlled by the same function, which I found pretty interesting. After seeing the example of the Noise Wave on the p5.js examples website, I decided to see if I could layer it to create not just one visualized wave, but multiple in order to gain the effect of light moving. I also found another project similar to the wave effect I wanted, and used that for reference when creating my own. The xoff values set the x-dimensions for the wave, and for loops and var y = map(noise(xoff, yoff)) basically maps out where specifically the wave height and x-values will be at (curve attributes) and allows the waves to continuously run in a random manner. 

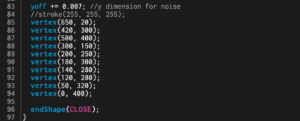
To be honest, the mountains were an accident. I decided to see what happened if I added more vertex points, and discovered that I had created a peak instead of just a simple baseline for the waves. I then added more vertex points to imitate the progression of a mountain’s outline. 

Overall, I learned a lot about the map() function from this project. In the future, I hope to add more to it and make an even more realistic depiction of an alternate dimension where light is seen in waves and flows through mountain scapes. Here are my final code and screenshots: 

Imaginary Creature

For the assignment “Imaginary Creature”, I decided to recreate the movement of a jellyfish. 

For the setup, I set x = 0, xSpeed = 3 (which will partly control how fast my jellyfish will move), and set the frameRate. 

In order to set the conditions of how the jellyfish will move and where it is located, I set sinValue = sin(frameCount * 0.025). I then set the angle as random so the position won’t be as easily “predicted”,  and translated the entire model by the width/2 and height/2 + sinValue * 100, which makes the jellyfish’s x-coordinates in the middle while allowing the y-coordinates to follow the sin curve. I also set the rotate factor by sinValue * PI/6, which will allow the jellyfish to tilt accordingly. 

However, how did I get it to stay on the screen and essentially “bounce” off the edges of the canvas? 

That’s where this if() conditional statement comes in. Originally, I had a really complicated “direction false === true” statement, so setting the x and xSpeed simplified it. The xSpeed controls the speed of the jellyfish at certain x-values, and the conditional statement also sets the bounds for how much the jellyfish can move. Because I wanted the jellyfish to bounce the other way when it hit the right or left of the screen, multiplying xSpeed by -1 makes it go the opposite direction. 

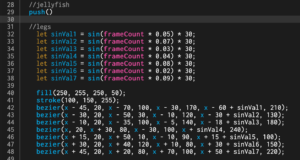
The bezier is the shape of the legs. By assigning different sinValues (sinVal1, sinVal2, sinVal3, etc.) and adding it to the x-coordinate of the second anchor point, I am able to basically randomize/mix the movement of each individual leg to mimic the movement of an actual jellyfish. 

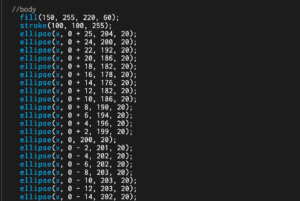
This is only part of the body’s code, but to sum it up I achieved the 3D effect of the body/head of the jellyfish by layering lots of ellipses and changing the values accordingly to create the perfect curve. 

Here’s my final product: moving jellyfish

Interactive Drawing

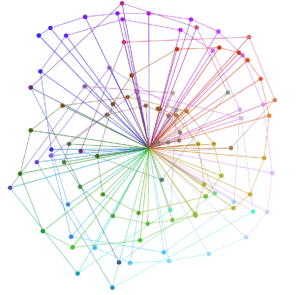
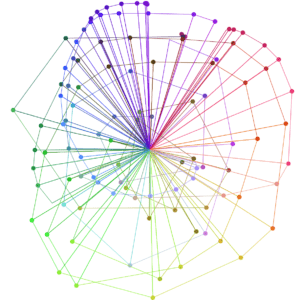
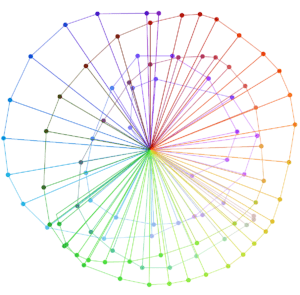
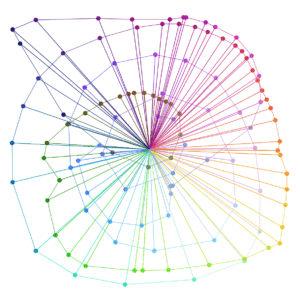
This week, I decided to create something a little similar to the ultimate particle constellation project goal.

Here is part 1 of the code: 

This was just the setup, creating a 600×600 white background canvas and setting the frameRate as 10 to split up the circular flow a little. It also set the color variables as r (red), g (green), and b (blue). 

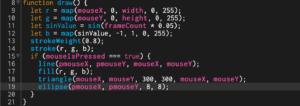
Part 2 is where the fun stuff happens. By first setting the r, g, b values as map() values, I am able to control what part of the canvas shows what colors. I let the red variable be controlled by mouseX and the green by mouseY, however, I attributed a sinValue for blue. Because the map function is essentially created by setting map(input, inputMin, inputMax, outputMin, outputMax), making the input a sinValue helps me control the position, time, or angle (in this case, I am controlling the position.

sinValue = sin(freq) * amp, in which the frequency (freq) is the frameCount * amount of frames and the amplitude (amp) is the radial distance or the distance from the center outward. The inputMin and inputMax are set as -1 and 1, because the sin values cannot go past those boundaries. The outputMin and outputMax are the restraints for the colors, so in this case I set them as 0 and 255 allowing a full range. 

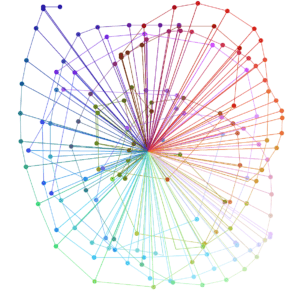
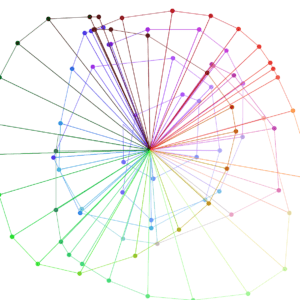
Then I set an if (mouseIsPressed === true) function in order to set the shapes to be drawn only when the mouse is held down on, putting a definite start and end to the drawing. I then input the shapes and attributes I wanted for those shapes, purposefully leaving out the third point of the triangle in order to create a central vertex/beginning point for all the “triangles”. I also decided to add points to create the effect of “connect the dots”. 

The last part of the code just set the function mousePressed() to give all drawing controls to the mouse. It also set the randomization of the r, g, b values for each press/click of the mouse. 

Here is the final result: Interactive Drawing


Each time you draw on the blank canvas, the results will be different because you are essentially creating the diagram yourself and setting each point yourself. But the general spread of the colors is the same, with the red starting in the upper right corner, following the rainbow as you go clockwise down and around. Creating this put me through a lot of confusing moments and experimenting, but was ultimately worth it.