This week, I decided to create something a little similar to the ultimate particle constellation project goal.
Here is part 1 of the code:

This was just the setup, creating a 600×600 white background canvas and setting the frameRate as 10 to split up the circular flow a little. It also set the color variables as r (red), g (green), and b (blue).
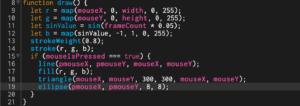
Part 2 is where the fun stuff happens. By first setting the r, g, b values as map() values, I am able to control what part of the canvas shows what colors. I let the red variable be controlled by mouseX and the green by mouseY, however, I attributed a sinValue for blue. Because the map function is essentially created by setting map(input, inputMin, inputMax, outputMin, outputMax), making the input a sinValue helps me control the position, time, or angle (in this case, I am controlling the position.
sinValue = sin(freq) * amp, in which the frequency (freq) is the frameCount * amount of frames and the amplitude (amp) is the radial distance or the distance from the center outward. The inputMin and inputMax are set as -1 and 1, because the sin values cannot go past those boundaries. The outputMin and outputMax are the restraints for the colors, so in this case I set them as 0 and 255 allowing a full range.
Then I set an if (mouseIsPressed === true) function in order to set the shapes to be drawn only when the mouse is held down on, putting a definite start and end to the drawing. I then input the shapes and attributes I wanted for those shapes, purposefully leaving out the third point of the triangle in order to create a central vertex/beginning point for all the “triangles”. I also decided to add points to create the effect of “connect the dots”.

The last part of the code just set the function mousePressed() to give all drawing controls to the mouse. It also set the randomization of the r, g, b values for each press/click of the mouse.
Here is the final result: Interactive Drawing
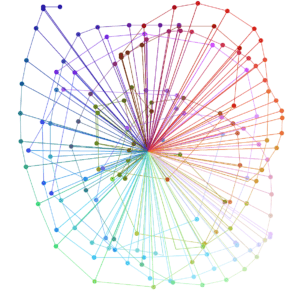
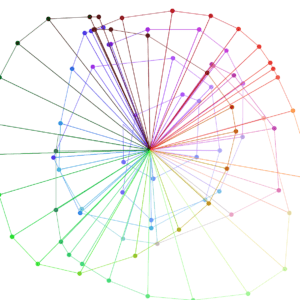
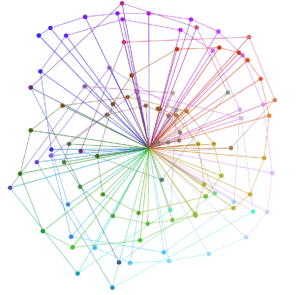
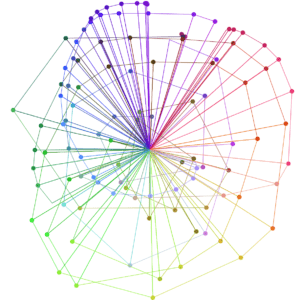
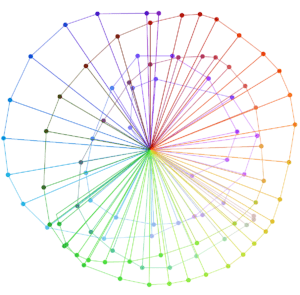
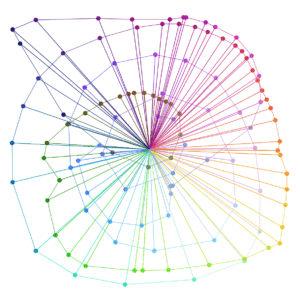
Each time you draw on the blank canvas, the results will be different because you are essentially creating the diagram yourself and setting each point yourself. But the general spread of the colors is the same, with the red starting in the upper right corner, following the rainbow as you go clockwise down and around. Creating this put me through a lot of confusing moments and experimenting, but was ultimately worth it.