For the final project, I worked with Daryl Goh to create an audio visualizer that changes pitch based on body movements using JSON data.

To start, we set the let() variables for later.
![]()
Then, we uploaded the audio file, Fractures by ILLENIUM, in order to set the preload() function to ensure that the audio loads later.

In the setup() function, we set the canvas size to fit the full web screen of the users’ devices, and set the values for the variables set earlier. Setting the constant for poseNet ensures that the ml5.poseNet data will be input and output, and setting the camera position to flipHorizontal inverts the frame.
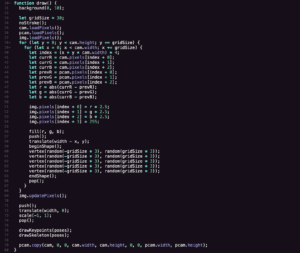
The function draw() part was honestly the toughest part for us. We essentially wanted to create a pixellated grid in order for specific points to be drawn out and controlled, and also to allow those points to control the nature of the audio. First, we loaded the pixels for the camera and the grid, then we created several let() loops in order to allocate colors for the specific colors within the pixels of the camera and grid. We separated the previous RGB from the current RGB in order to ensure that the colors shown are still in real time. Then, we set the img.pixels index to different values to customize them and keep them randomized in the specific frames. After setting the let() and img.pixels commands, we drew vertex shapes to create the geometric design that moves with the body points to create more aesthetics.
![]()
The function gotResults(newPoses) keeps the real-time movements to date.

We created a function for drawKeypoints(poses), which controls the movements within our body points of the user. We also changed the fill() settings to randomize the color of the key points of the body points.

In the function drawSkeleton(poses), we essentially made the lines connecting each body point in order to mimic the stick figure, or skeleton.

Lastly, we created two functions for the music to stop and start. Function mousePressed() ensures that when the mouse is pressed, the music starts, and the keyPressed() function makes the music stop when the space bar is clicked.
Overall, I learned a lot from this project. In the future, I would maybe add dynamic landscapes to the background that changes the volume or song according to where the body of the user is on the screen.
Here is the final product and code: project and code
