Case Study II. Data Visualization

For this case study, I am trying to explore data visualization. The project I chose explores the election results from 2016, Hilary Clinton vs. Donald Trump. 

This utilizes the data and categorizes the voter election turnouts based on who voted for who as well as who is predicted to be undecided or voted for. This is based on the popularity vote, as opposed to the electoral college vote.

The animation utilizes the data and categorizes them to create the percentages for each canditate’s turnout. The bounces for the balls gravitates towards the outer clusters from the inner cluster, which slowly changes colors as the votes change. 

For my own project, based on this, I can utilize the 2020 election data and try to instead of making the balls bounce from cluster to cluster, just make the colors simply change in a single cluster. By implementing the JSON data, we will be able to get it to visualize and I think it would turn out well. 

Here is the link: case study 2

10.R JSON Visualization

For this, we had to code body points with the JSON formatting style.

To start, we had to set the attributes for pose and body points. Then, we preloaded the JSON file in order to properly load the file, which contained the body points. 

In the setup() function, we had to set the for() function so that it lets each body point be attributed to the pose.bodypoints. We also set the console.log() for each part to be separated from the rest and load it in the console. 

In the draw() function, we set the background color and another for() loop in order to let the body points be set to display and set the length. Then, we set circles for each body point that was assigned in the JSON. After, to create the lines, we set body point x and y values to be correlated to the circles and connect each individual point to each other. That then creates the skeleton outline that is presented on the actual code. 

In the class body point(), we set the constructors for the points to actually present the circles and lines. 

Overall, next, I could clean up the lines and make them more connected and create a real body outline, instead of the singular skeletal lines. 

Here is the final code: code

9.R Generative Interactive Portrait

For this project, we had to basically render an image using generated pixels. I decided to use a dark purple grim reaper with angel wings playing with music turntables and a dj setup. 

Here is the original: 

To start, I used Moon’s code for inspiration and changed the characters to suit the final picture completely. I put the image from Google into assets, then took the link and inserted it into the code. 

In the setup, I set the canvas to fill up whatever the window size of viewers is, and resized the image to be bigger. 

The draw() function is where the pixels are oriented and the wave graphic animation is put in. I played around with the grid size and settled on 5, which is basically the size of each square in the grid, which one belongs to each “pixel”. The for() loop assigns the each pixel to the square in the grid, and the map() function in the constrain() will help in iterating a color to each pixel based on the colors of the original photo, which is what fill(r, g, b) does. The translate() and rotate() functions create the waving effect on the drawing. By adding the +x to the rotate function, we tell it to move horizontally. The text() function sets the characters we initially set up as what shows up for each pixel. 

In the future, I hope to add more interactivity to it, such as making the pixels explode and return to their initial place when you click the mouse or press the space bar, and center. 

Here is the product: code 

8.R Interactive Experience Project

For this project, I worked with my partner, DJ, to recreate the brick breaker game. Here is our inspiration: brick breakerIt seemed so simple from the appearance, but creating it was much harder than I expected. 

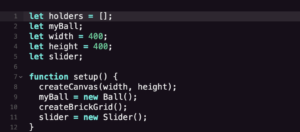
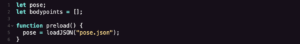
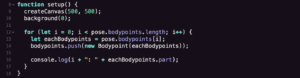
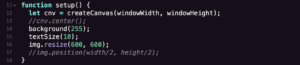
To start, we set our initial values and did the typical setup(), adding createBrickGrid() and a slider. 

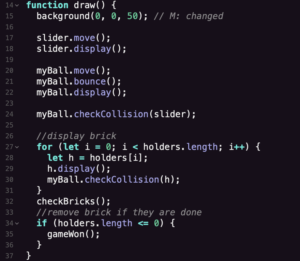
In the draw function, we set the attributes for slider and myBall to give them actions. To display the bricks, we set a for() loop and added a collision asset, then added the function to remove bricks when they are hit by the ball.

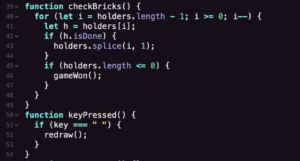
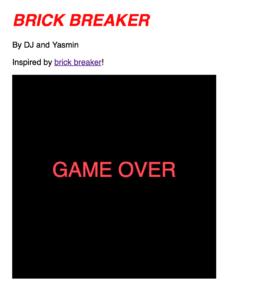
The function checkBricks() activates the code in the draw function, setting it so the bricks disappear. We also added the if() statement to display the gameWon() if there are no more bricks. Then, we tried to implement a keyPressed function, but it didn’t really work. 

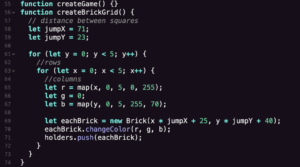
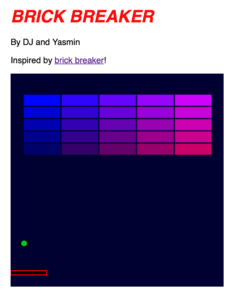
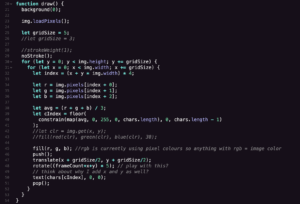
Next, we created the brick of grids. Instead of adding each brick individually, we decided to create an array. To do so, we set the distance between each square with the let jumpX and jumpY functions, then set a for() loop to limit the number of bricks to 0-5. Setting the RGB values created the ombré color in the bricks. 

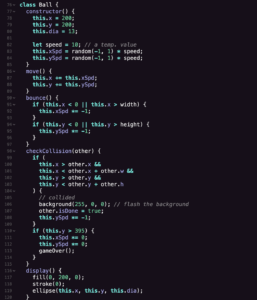
Next, we created a constructor class Ball for the ball. We set this.x, this.y, and other this.variables, then set the values for them too. Move() controlled the general movement/speed, bounce() makes it bounce off the four walls instead of going off the screen, and display() controls the appearance. The checkCollision(other) function utilizes an if() statement to check for the collision of the ball and brick. We also set another if() to check for whether the ball hit the floor, and if so, it displays the gameOver() function. 

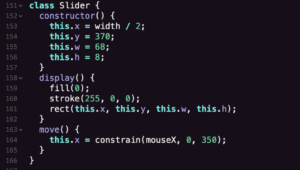
We then set a constructor class Slider, making the platform’s x-value be controlled by the mouse. 

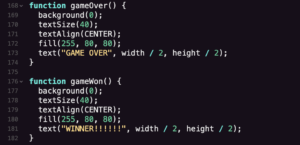
Lastly, we set the gameOver() and gameWon() functions to display the features when the game is lost or won. 

Overall, the hardest parts of this were displaying the gameWon() function, randomizing the ball movement, and creating the array of bricks. If we were to continue this project, we would add our own twist to it, rather than simply trying to imitate the initial game. 

Here is the final product:   CODE    GAME