Interactive Drawing

This week, I decided to create something a little similar to the ultimate particle constellation project goal.

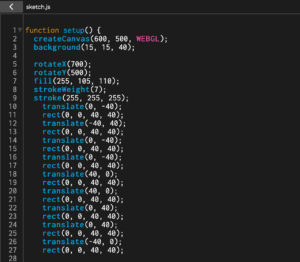
Here is part 1 of the code: 

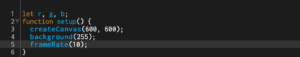
This was just the setup, creating a 600×600 white background canvas and setting the frameRate as 10 to split up the circular flow a little. It also set the color variables as r (red), g (green), and b (blue). 

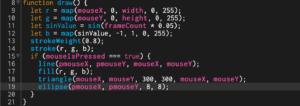
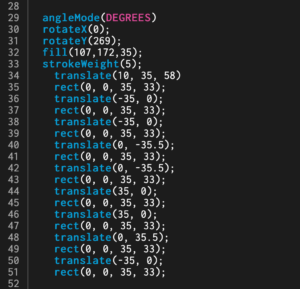
Part 2 is where the fun stuff happens. By first setting the r, g, b values as map() values, I am able to control what part of the canvas shows what colors. I let the red variable be controlled by mouseX and the green by mouseY, however, I attributed a sinValue for blue. Because the map function is essentially created by setting map(input, inputMin, inputMax, outputMin, outputMax), making the input a sinValue helps me control the position, time, or angle (in this case, I am controlling the position.

sinValue = sin(freq) * amp, in which the frequency (freq) is the frameCount * amount of frames and the amplitude (amp) is the radial distance or the distance from the center outward. The inputMin and inputMax are set as -1 and 1, because the sin values cannot go past those boundaries. The outputMin and outputMax are the restraints for the colors, so in this case I set them as 0 and 255 allowing a full range. 

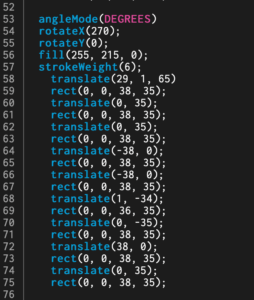
Then I set an if (mouseIsPressed === true) function in order to set the shapes to be drawn only when the mouse is held down on, putting a definite start and end to the drawing. I then input the shapes and attributes I wanted for those shapes, purposefully leaving out the third point of the triangle in order to create a central vertex/beginning point for all the “triangles”. I also decided to add points to create the effect of “connect the dots”. 

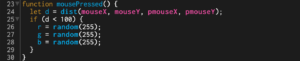
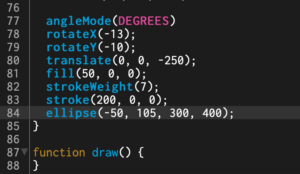
The last part of the code just set the function mousePressed() to give all drawing controls to the mouse. It also set the randomization of the r, g, b values for each press/click of the mouse. 

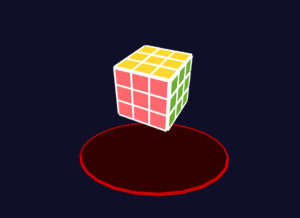
Here is the final result: Interactive Drawing


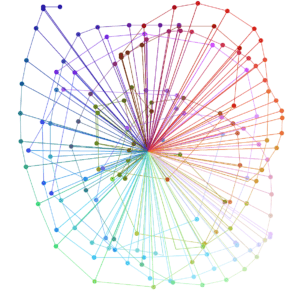
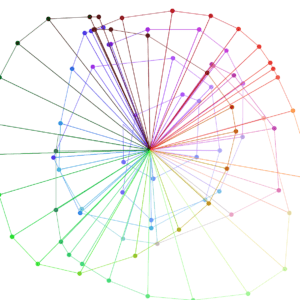
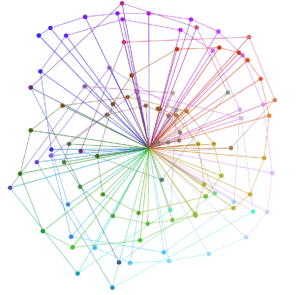
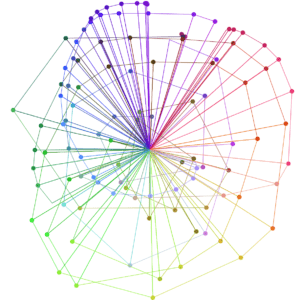
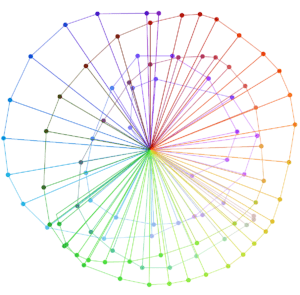
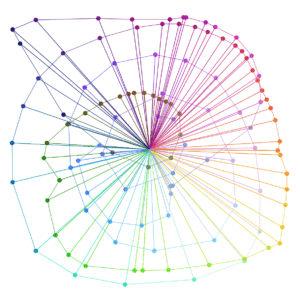
Each time you draw on the blank canvas, the results will be different because you are essentially creating the diagram yourself and setting each point yourself. But the general spread of the colors is the same, with the red starting in the upper right corner, following the rainbow as you go clockwise down and around. Creating this put me through a lot of confusing moments and experimenting, but was ultimately worth it. 


Case Study 1: Generative Art

For this case study on Generative Art, I wanted to get inspiration from the cosmos combined with the living universe.  I ended up discovering two works that I found catered to the idea that I had: an art installation in Paso Robles, California called “Field of Light” at Sensorio (https://www.sensoriopaso.com) and a depiction of the particle constellation effect. The one I will be focusing on in this post is the latter. 

Here is an example of the particle constellation effect (taken from particle constellation gif): 

Here is the link I got the inspiration from: building a particle constellation effect

As you can see from both the gif above and the article’s graphic, the particles in the planes are connected by lines, essentially creating constellations that are all connected to each other which then create one larger piece. What fascinated me the most about this type of generative art is the fluid connection of points and the hypnotizing nature of this repeating geometric space. 

To be fairly honest, I didn’t understand much of the code (but I hope I will soon). From what I could gather, it works by first using functions such as addBall() and moveBall() as well as adding the movement components (such as if(bounce(b.x…)). Then, to create the lines connecting the moving balls, it adds the dist() and drawConnection() functions to draw the lines. 

I hope to learn the code for this and potentially combine it with some of the aspects of the interactive Field of Lights to create my own version of a particle constellation piece!


Drawing With Code: 2D Rubik’s Cube

PROCESS

For this assignment, I decided to draw a Rubik’s cube I had lying around. However, it was more challenging than I anticipated, as I had to replicate a 3D object using 2D shapes. 

In class, I learned how to draw, adjust the size of, and change the direction and configuration of 2D shapes on the canvas. The tricky part of this drawing was figuring out the angles and size of each separate piece used to create the replica. 

This is part 1 of the code. First, I set my background color, adjusting the RGB values accordingly to create a dark midnight blue. Then, I added the first square, which would be one of the three sides of the cube shown, and set the color for it (a coral red). I discovered the rotateX(), rotateY(), and translate() functions, allowing me to create identical translations of a single smaller square as well as enabling me to tilt the squares to create the sense of depth and help recreate a 3D plane.  

The code for part 2 of the cube was a little trickier. I struggled to find the right angle to rotate the second side of the cub on the Y axis, then I discovered the angleMode() function, allowing me to input either DEGREES or RADIANS into it. This allowed me to get a better understanding of just how much I was turning the surface. I also realized that putting the same dimensions for the squares made the cube look incredibly disproportional, while changing the dimensions of each square to be a little narrower and into rectangles (as opposed to a square) further added to the perception of depth. 

Part 3 was the trickiest, as it was the last face of the cube. I needed to figure out how to place it on top of the two previous faces, but after tinkering around with the rotateX() and translations, I got it to work. 

For the last part, I thought it would be cool to create the illusion that the cube is floating in space, so I added a small “table” underneath it. I changed the strokeWeight to 7 in order to give it more of the 3D look, but not a full cylinder. 

Here’s my final product: 2D Rubik’s cube


REFLECTION

After creating my first drawing with code, I’ve come to a few conclusions. By using the computer interface, it is a lot easier to get more precise rotations, size, and translations. Picking colors is also more accessible, and shapes are created by typing single words and numbers for dimensions. It is also much easier to correct mistakes, as nothing is really “permanent” in the code and can be changed with a few keys. 

However, the disadvantages of drawing with code mainly stem from lack of experience with the program. While drawing on paper, measurements are usually executed with a ruler and a pencil. But on the computer, there are more variables and factors that go into presenting even a single line. I struggled with getting the right numbers to configure each dimension and rotation, especially while I was first figuring out how to translate each cube identically on the same axis. The difference between the positive and negative values threw me off as well, but after getting used to it and figuring out that it works on the coordinate plane system, it was more straightforward. 

In terms of whether I preferred exploratory programming or documentation, the first method reaped the better learning experience. By discovering different functions by randomly typing words and numbers to see the parameters, I was able to figure out how the outcome was presented differently with each individual change in the source code. However, I believe this method worked because I didn’t have an extremely specific goal and look for my drawing–I was mainly just getting the hang of it. If I were to create something that required more precision and detail, I think documentation would work best.