A close look at the city’s capital projects reveal what public improvements NYC is prioritizing.

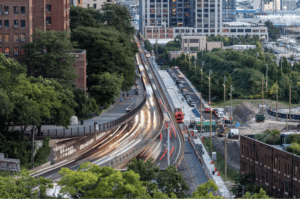
Image of the Brooklyn-Queens Expressway (Photo credit: Max Touhey, Curbed NY)
The City of New York has ambitious goals to expand greenway corridors, enrich business districts, create more housing, and improve public infrastructure to enhance quality of life and support economic development across the five boroughs. City-wide goals such as these are accomplished through smaller scale projects and policy changes over the course of several years, even decades.
These big ideas can feel like an enigma to the average New Yorker. We often hear about major projects on the horizon but rarely see changes or feel their impact in our daily lives. To understand the City’s progress in achieving these goals, it is important to understand where the capital budget is being allocated, what kinds of projects are actually being funded, and what implications this has for residents and visitors.
Capital spending per person is highest in the Bronx
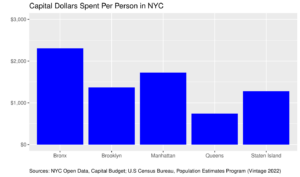
The City’s capital budget can be a confusing concept. It is unclear how much money the City has and where the different administrations have been directing the budget over the years. To paint a picture of city-wide spending today, we can compare the capital dollars currently being spent per person per borough to see how much money each borough is receiving from the City relative to its population size.
Just over $2,000 capital dollars are being spent per person in the Bronx. This is the highest per-capita allocation followed by Manhattan, Brooklyn, Staten Island, and Queens respectively. This data shows that the City is allocating the most money to capital projects in the Bronx relative to the volume of residents in this borough. Queens — the second most populated borough with approximately 2,278,029 residents — is receiving only $743 dollars per person from the capital budget.
Spending per person per borough is calculated by dividing the total cost of active capital projects in each borough by the total population of that borough. It is important to compare budget allocation by person as opposed to each borough’s total budget to account for population differences by borough and to understand how many people will be impacted.

Figure 1. Capital Dollars Spent per Person in NYC
Transportation infrastructure leads among active capital projects
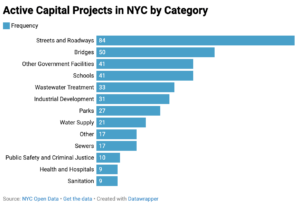
After seeing where capital funds are being allocated, we can now compare the types of capital projects currently being funded. Across the five boroughs, 22% of active projects are improvements to streets and roadways, followed by bridge enhancements at 13%. Arts and culture, library, ferry, and technology related projects are the fewest, with only 17 active projects in total across these categories, represented as “Other” in Figure 2. These data show that there are more street and roadway projects underway than any other type of capital project in NYC.
Note that subway, ferry, and bus related projects are excluded from any mention of transportation infrastructure in this analysis.

Figure 2. Active Capital Projects in NYC by Category
Why does this matter? Poor street conditions are a major quality of life issue for New Yorkers
Whether you drive, walk, or take public transportation, it is well known that NYC street conditions are among the worst in the country. This not only poses major safety risks but also places substantial financial burdens on residents and commuters, exacerbating traffic and roadway accidents. While transportation improvements can take decades to complete, the volume of current projects aimed at enhancing streets, roadways, and bridges lead us to believe that traffic congestion, street safety, and overall driver experiences will improve in the future.
Despite volume of transportation projects, capital project priorities and spending vary significantly across the 5 boroughs
Although transportation dominates the citywide capital budget, priorities vary greatly by borough. For example, Staten Island currently receives nearly $300 million for wastewater treatments and none for street and roadway projects, whereas Manhattan’s budget prioritizes bridges, streets, and roadways, at nearly $2 billion. Lastly, Brooklyn’s budget allocates over $1.5 billion to industrial development but spends under $300 million on transportation.
To get a sense of each borough’s current budget priorities, let’s take a look at project spending by category across each of the five boroughs. Click on each image to see it in full size.
Figure 3. Breakdown of Capital Project Categories by Borough
Budget distribution reveals that Manhattan and the Bronx prioritize transportation infrastructure
Differences in project spending between boroughs suggest that the cost and frequency of different public improvements vary by location. In Figure 3, we can see that Manhattan and the Bronx are investing the most money in street and roadway and bridge projects. This might mean that transportation improvements are either happening more often or are more costly in these places. To make this determination, we would need to take a closer look at the specific transportation projects in these boroughs.
While the City often promotes broad visions for the future without delving into the details, the City’s capital budget can provide insights into the current condition of improvements and tell us where we are likely to see their impact. Reflecting on the 2023 capital project budget, it is clear that work is in progress to improve streets and roadways citywide, with Manhattan receiving the most funding for these initiatives.
Sources:
- Data analysis and graphs
- Data source: Capital Projects (NYC Open Data)
You can reach the author of this piece, Ally La Pinta, at: aml9347@nyu.edu
You can reach the editor of this piece, Calley Wang, at: csw9856@nyu.edu


