Trigger warning– The following article mentions police brutality against Black communities, police misconduct accounts, and crime statistics. Please consider this warning before continuing.
Nationwide, police departments have been a topic of discussion throughout 2020. Beginning in March with the murder of Breonna Taylor by the Louisville Metro Police Department in Kentucky, to the murder of George Floyd in Minnesota with calls to #DefundThePolice and #AbolishThePolice, to the violent encounters with the New York City Police Department (NYPD) in protest to the over-policing and disproportionate enforcement of the mask mandate on Black and brown communities. 2020 is far from the first time that communities of color, specifically the Black community, have called for abolishing the police, considering the present-day police force’s roots in slave patrols. The data that informs humans drive the police’s decisions, people with implicit and explicit biases. With this emerging force, it’s dire to understand that partial data re-enforces over-policing that detrimentally impacts Black and brown communities’ livelihoods.
The origins of crime data visualization began in the 1980s. Jack Maple, a transit cop, was frustrated with the lack of crime prediction and inability to “fight crime.” He mapped out every train station and subway line on 55 feet of wall space and coined it as “Maps of the Future.” Maple created his legend to mark every violent crime, robbery, and grand larceny, and if the crime was solved or unsolved. When William Bratton was hired to head the Transit Police, Maple and Bratton worked on the data-driven maps. Between 1990 and 1992, they used their hotspot crime mapping to successfully decrease felonies by 27% and robberies by a third. From the success of “Maps of the Future,” the concept of CompStat was born.
The CompStat software was used as a way to compile crime statistics in police precincts. To encourage personnel to use the software more, Maple promoted Monday and Wednesday CompStat meetings with city-wide personnel. The CompStat meetings were known for provoking immense emotional, physical, and mental stress among cops. The sessions worked- major crimes dropped 39% in 27 months in the late 1990s. Former NYC Mayor Guiliani took credit for the drop in crimes, which came at the cost of a harmful “stop and frisk” policy that terrorized communities of color. More specifically, 50.6% of the stops were of Black New Yorkers, when they only comprised 25.6% of the city demographic. Hispanics were stopped at 33.3% when only making up 23.7% of the city’s population. Guiliani’s tactics to be “tough on crime” led to an increase in the incarceration of men of color, further exacerbating racial disparities.
During the Bloomberg administration, which prided itself on data-driven decisions and creating “the safest big city in America,” there were many red flags in how it used data. During 2012, Reuters reported that police were underreporting crimes to maintain the low-crime rates throughout the city to maintain the reputation that CompStat had throughout the Guiliani and Bloomberg administrations. During Bloomberg’s first-term, crime rates were notable because he took office in January 2002, becoming mayor shortly after the 9/11 terrorist attacks. Throughout Bloomberg’s 3-term mayoralty, the now unconstitutional and racist “stop and frisk” policies reflected the intention to decrease crime rates, but with Black and Latinxs facing the brunt of it. At the height of the policy in 2011, there were 685,724 stops; 88% were innocent, 53% Black, and 34% Latinx. In a video clip, Mayor Bloomberg said, “Ninety-five percent of your murders — murderers and murder victims — fit one M.O. You can just take the description, Xerox it, and pass it out to all the cops.” Following Bloomberg’s attitude, there were also reports of police commanders telling their subordinates to “write more Black and Hispanic people.”
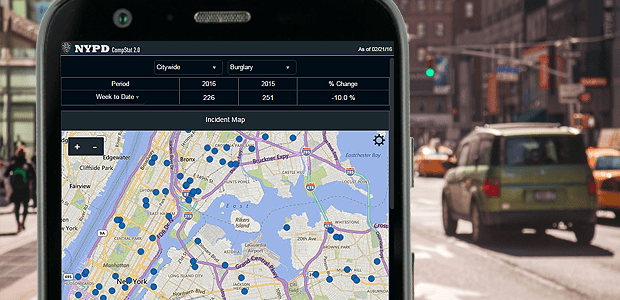
As an attempt to address the controversial use of CompStat, data tampering, and the harmful Stop and Frisk policies, the NYPD released CompStat 2.0, which “provides greater specificity about crimes through an online interactive experience.” Through the data portal, users can specify which borough they are interested in looking at, the precinct, the day of the week, the timeline, and crimes are classified into 16 limited categories. The data portal is not user-friendly or transparent– there is a lack of specificity around police districts and the lack of information about the nature of the crime.
To get more detailed data, I went to the NYC Open Data portal, a free public data bank published by NYC governmental agencies. However, the NYC OpenData for NYC Crime for “all valid felony, misdemeanor, and violation crimes reported to the NYPD” was last updated on October 28th, 2020, dating it over a month old. Additionally, the same outdated information is used for the NYC Crime Map tool, which is frequently used to display “crime hotspot” areas via social media. However, only seven crime categories out of the 16 used by the NYPD are included on the map (including burglary, felony assault, grand larceny, grand larceny of motor vehicles, murder, rape, and robbery), which severely limits the understanding or nuance of crime in New York City. There is also no reasoning to explain why these categories were selected.
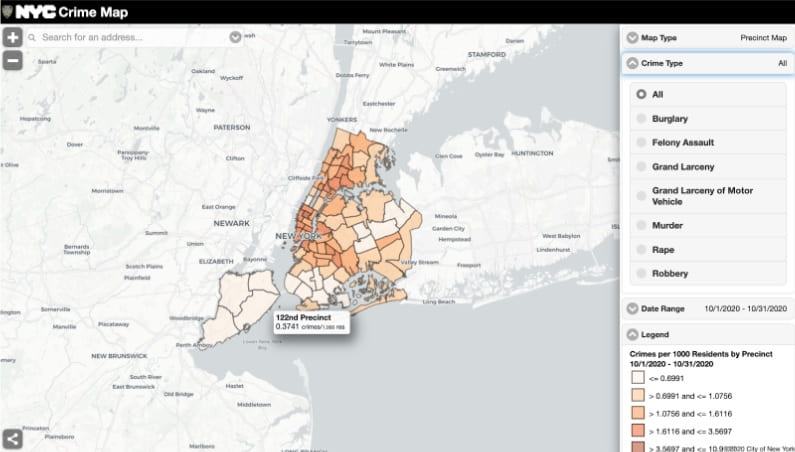 Source: NYC Crime Map
The NYPD needs to be more transparent with the data shared with the public. If data transparency increases, it can foster more confidence in the communities they serve and allow more organizations to create solutions without traditional policing. Planners have a particular set of skills to conduct data analysis, geospatial analysis, community engagement, and stakeholder management. Suppose non-NYPD establishments had access to data, like nonprofits and private companies. In that case, they could share their resources to adequately address marginalized groups’ specific needs to decrease incarceration rates.
For example, suppose there is an accumulation of fare evasion incidents at a specific subway station. In that case, it can be an opportunity for nonprofits or private companies to distribute MetroCards to eliminate fare evasions. This can help decrease nonviolent offenses and allow transit cops to reallocate their time and resources to more severe incidents within subway stations. Planners can play different roles– they can generate maps with the subway stations, coordinate interviews with transit cops at affected stations and ask more questions (such as when the incidents occur and what age demographic participate more), evaluate if any other nonprofits can help with the MetroCard distribution and manage different stakeholders.
Perhaps planners – and their data management skills alongside their ability to connect both the quantitative and qualitative stories behind societal problems – could help provide solutions to issues as harmless as fare evasion. However, due to the lack of data transparency between the public and the NYPD, there is no way for public servants unaffiliated with law enforcement to provide people with assistance in their immediate needs (in this case, a MetroCard swipe) what they need rather than getting penalized through law enforcement.
Data is only as powerful and effective as we use it. More than ever, it’s critical to think about so-called “data-driven decisions“ and how data is categorized. The percentages and numbers thrown around in policy analysis to justify significant policies impact marginalized communities’ livelihood in immeasurable ways.
Cover Image Source: GCN.com