For my final project, I used data from the National Center of Science and Engineering Statistics (NCSES) to examine the enrollment of minorities in STEM over a decade (2006-2016). There has been a recent push to make STEM more inclusive but I wanted to see how well minorities were being represented before inclusions seemed to become more “mainstream”.

The first data I wanted to look at was minority enrollment in general so I would have a baseline to compare to my next graphs.
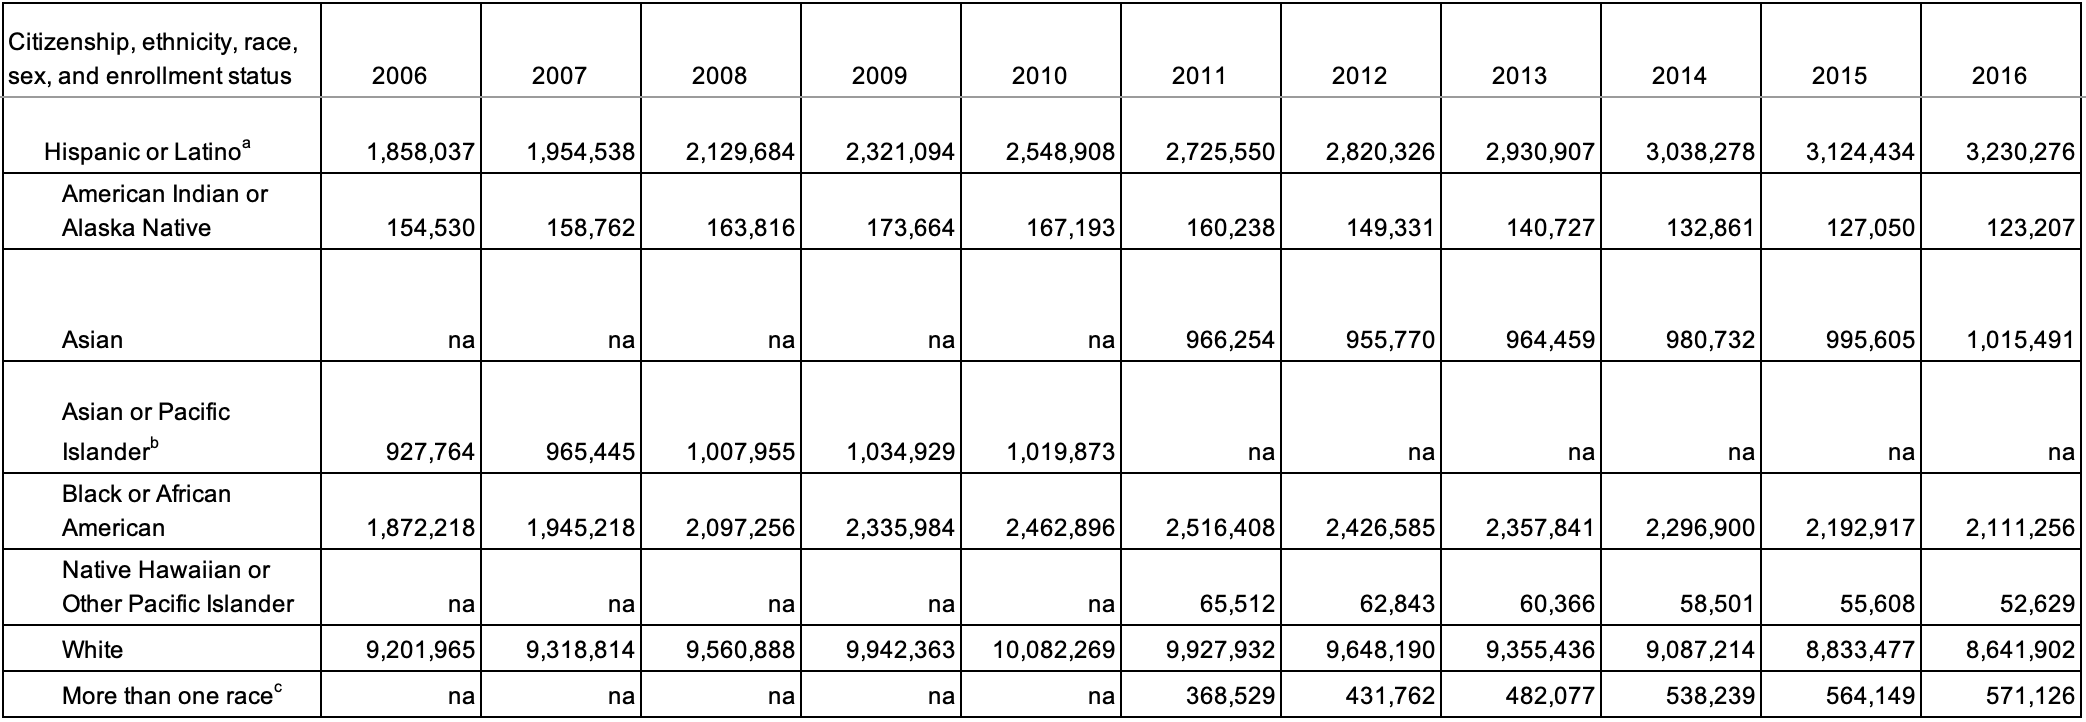
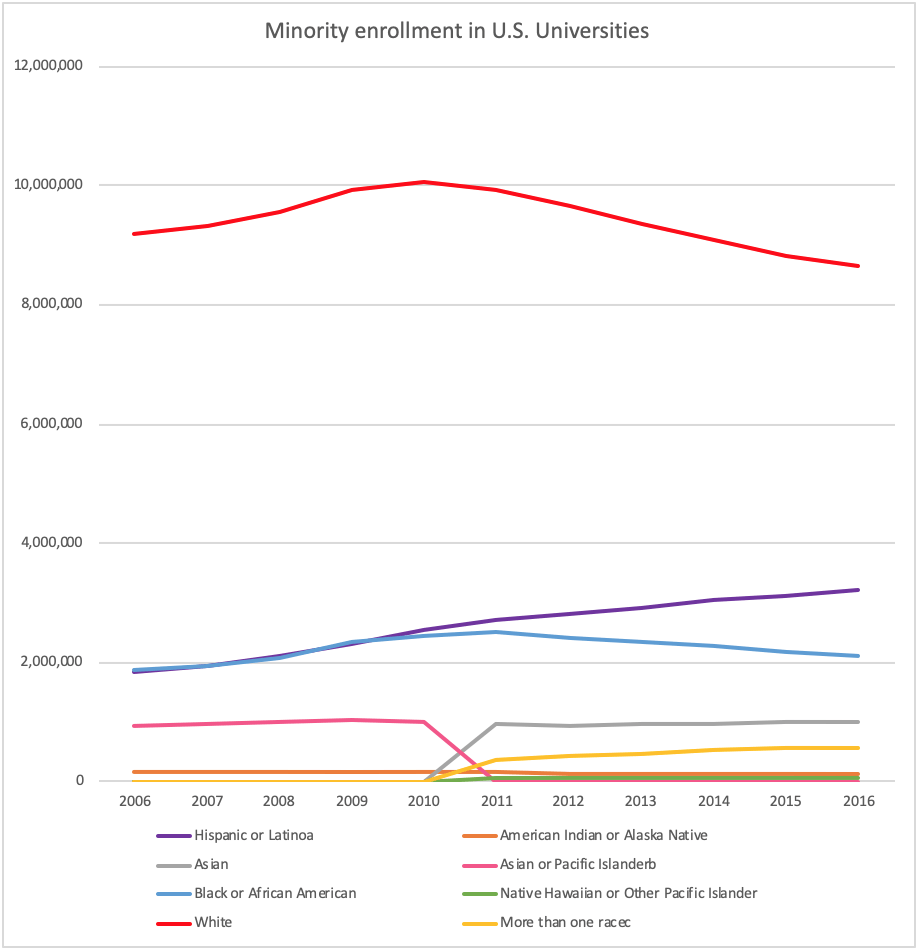
Although I wanted to look at the trend for minorities in STEM I included the data for white in order to see the drastic differences between the groups. I was expecting the numbers for white people in STEM to be higher but I never expected it to be about 10 times the numbers for the rest of the groups. When looking at the pink and grey lines, which represent Asian or Pacific Islander and Asian respectively, they seem to be mirroring each other, this is mainly due to the reason that when collecting data they made generalizations but decided to group it together as the same category of Asian. The numbers for Hispanics and Latinos are increasing at a faster rate starting from 2011.
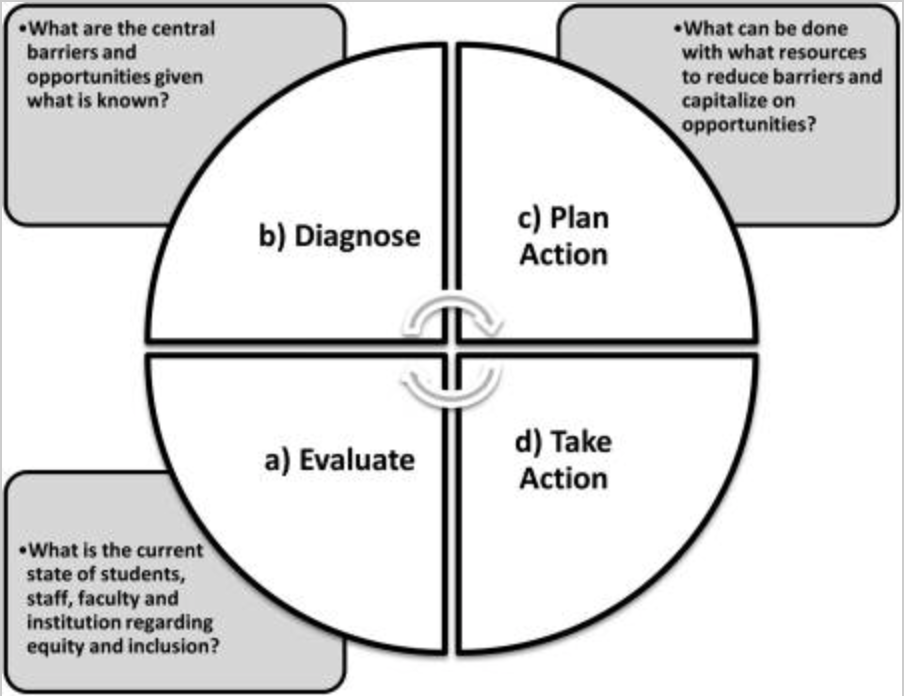
This increase could be explained by some of the methods that Estrada et al speak about in their Journal Article. By having institutions use an action model research plan they can find methods to better understand help those underrepresented groups by providing necessary resources and or programs. All of the points they stressed in their analysis was placing accountability on the institutions because the fault of having low representation cannot just be accredited to the students, something about the curriculum or the way it’s being taught is having a disconnect with underrepresented groups.
Now having a sort of baseline I wanted to examine how the graph would change if I restricted it to only include full-time students. 
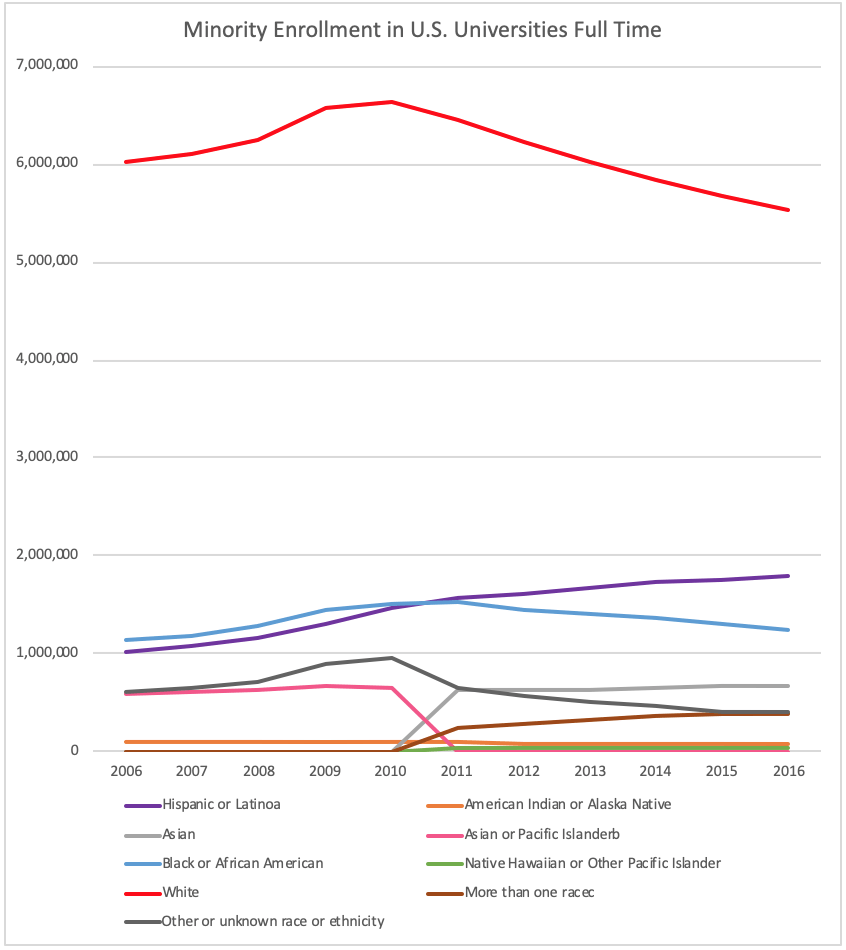
Looking at this graph I can’t help but be drawn to the drastic difference of the labeling at the y-axis. The max value for white students was about 10 million, but full-time white students only reach a max of around 6.6 million. The number of students for Hispanic and Latinos dropped by almost 50% and Black and African American students lost about 400,000 students. I believe that this change can be attributed to the increasing costs of attending college and being able to attend full-time is a privilege because many students may need to become part-time in order to work to pay off loans or for other essentials.
Estrada even stated that “underrepresented minority undergraduate students are more likely than white students to come from low-income households, be first-generation college students, and experience financial strain while attending college or university.” Perna, Laura, and Chunyan Li say that across 4- year universities and 2-year colleges about 81.72% of the students are low-income which they define as making below $30,000 annually. Since underrepresented minorities are more likely to work while trying to achieve a degree they are at a disadvantage and have less of a chance to engage with the subject they’re studying, and having those barriers seriously impedes the chances of students to continue studying in STEM.

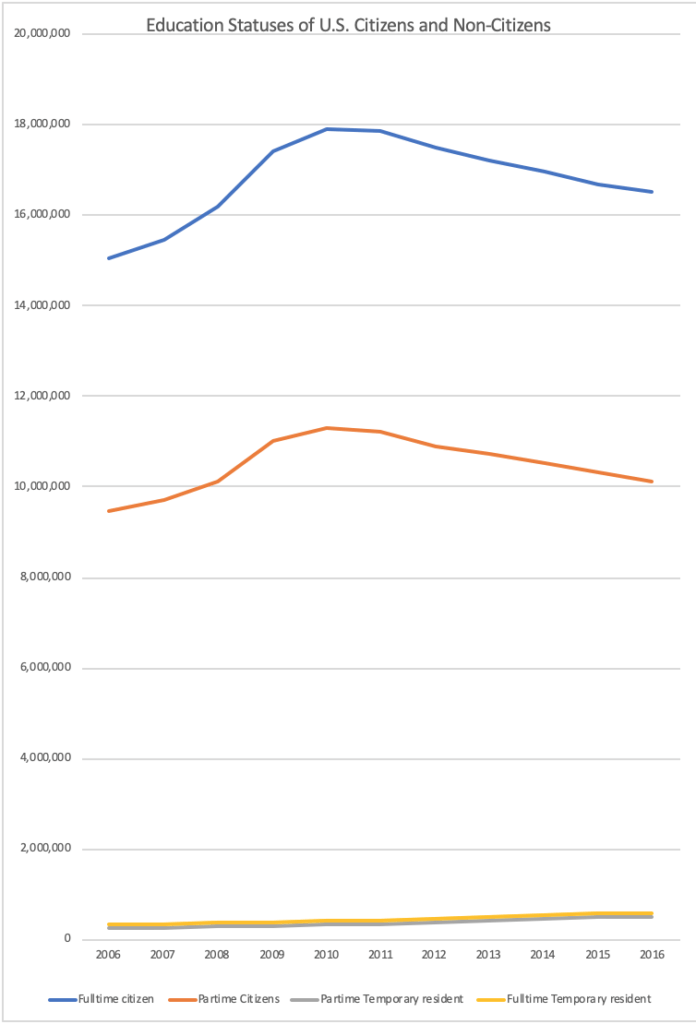
International students have a lot of influence on the U.S. university system, so when I saw how low the numbers were for international students in STEM. In Niall Hegarty’s article, he speaks about how vital international students are to the U.S. economy, and in 2012 they contributed more than $21 billion dollars to the economy. Generally, international students have, “more disposable income to invest in longer educational programs abroad.” so it seems like across the boars there needs to be a change in the way STEM classes are taught. One of the most important things that need to change, if it hasn’t already, is the way we make a sense of belonging in order for minorities to do well and thrive in STEM. Since it was a system that was for the longest time designed for white men, so we need to change the environment so that it’s welcoming to all.
Bibliography
Estrada, Mica, et al. “Improving Underrepresented Minority Student Persistence in STEM.” CBE—Life Sciences Education, vol. 15, no. 3, Sept. 2016, p. es5. Accessed 9 Dec. 2020.
- Estrada et al look at the underrepresented minorities in the STEM field and try to examine why there isn’t a similar trend for white and Asian students. They further go into potential “pathways” that will encourage underrepresented minorities to keep studying to be in the STEM field. The relevance of this journal article to my data visualization is that there is a general increase in those minorities in the STEM field so they could be implementing these methods and if so they’re proving to be effective.
Hegarty, Niall. Where We Are Now -The Presence and Importance of International Students to Universities in the United States. Vol. 4, no. 3, 2014, pp. 223–235, files.eric.ed.gov/fulltext/EJ1054975.pdf.
- International Students are vital for U.S. universities for certain academic programs to exist. The U.S. used to have a “monopoly” on international students but nations are trying to keep their brightest at home. The relevance to my final is that the results of this graph are proving what the journal is saying, the presence of international students is dwindling, especially with the increase in college prices.
Langin, Katie. “A Sense of Belonging Matters. That’s Why Academic Culture Needs to Change.” Science | AAAS, 16 Jan. 2019. Accessed 9 Dec. 2020.
- This article speaks about the importance of the environment surrounding STEM education. When underrepresented students have a sense of belonging with peers and educators they perform just as well as their majority counterparts. Its relevance in my final project is that in order to keep underrepresented minorities in STEM they have to feel like they belong, along with having support systems and resources.
Perna, Laura, and Chunyan Li. “College Affordability: Implications for College Opportunity.” NASFAA Journal of Student Financial Aid, vol. 36, no. 1, 2006, pp. 7–24, repository.upenn.edu/cgi/viewcontent.cgi?article=1032&context=gse_pubs.
- This journal article gives more statistics on the affordability of college and gives percentages on each financial class and how affordable they believe college is.
Washington, Harriet A. A Terrible Thing to Waste Environmental Racism and Its Assault on the American Mind. Little, Brown Spark, 2019.
- Minorities are historically underestimated in every aspect of the word, but especially when it comes to intelligence. This bias has made education fit many white men, so when teaching others it doesn’t always fit, so addressing these biases and reforming them it can make education accessible for all.
“Women, Minorities, and Persons with Disabilities in Science and Engineering: 2019 | NSF – National Science Foundation.” Accessed 9 Dec. 2020.
- This was the recourse that I used to create my data visualization. It allowed me to gain information on the number of college students in the United States that were majoring in a STEM field.
