1. Where do I start? I understand the whole concept and what you expect us to learn from the assignments, but still, I cannot find a clear way to go about it.
One tip to sort out this type of problem is to ask ourselves, what do we want the end product to look like? Then I would do this:
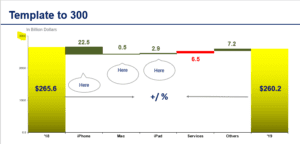
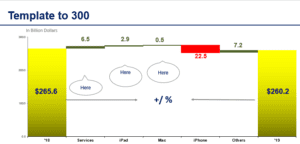
- We need to fill in a template with price increases, and the data must tie with the numbers on the annual report. The first step is then to fill in the data in that format, whether it’s by region or product.
- Think about the overall result. If the question is price increases, ask yourself “What would a reasonable number be? Should it be the same, higher, or lower than inflation?.”
- Do extensive research about how much your company increased prices in previous years. That information will not be on the company’s website, but it may be on their annual report, on investor’s presentations and or articles written by major business newspapers.
- Look at the examples from the submissions from other students.
- Read all the questions asked by other students here. That will give you tips on what to do.
In this class, there are no right or wrong numbers, so that makes it easier. It’s all about justifying the number we are proposing.
2. I feel a little unclear about this assignment. I just want to make sure all we need to do is to fill the Excel sheet and send emails to students from other companies then submit all the emails with responses and the Excel sheet.
Yes, the excel file is correct, but you also need to add slides justifying the price increases.
Required
- The template with the numbers
- Comments on the text box regarding why you increased or decreased prices
Encouraged
- The emails I have seen were excellent. I would recommend that you copy a picture of them to an additional slide
- Details on consumer responses and what you are doing about it.
3. Calculating the impact of a price increase
I will decrease Disney’s price by 15% at the end of the first quarter of 2023. I thought the impact would be 1/4 of the full-year impact, dividing the full-year impact by 12 and then multiplying by 3. I cannot figure out why the impact should be 75%. Could you please explain more?
This is a very common mistake, that seasoned CFOs also make. Here is one way to solve this: imagine a calendar with 12 months, and start with the easiest part. When do you have to increase prices for the change to have an effect on the full year? You have to do it on January 1st. If prices are 100, and you increase prices by 10% on January 1st, your sales will increase to 110 in Jan, Feb, Mar, April, May, June, and so on. Your sales used to be $1,200 ($100 per month) and they are now $1,320 (110 per month). What happens if you increase prices on July 1st? Then you have 6 months at the old price of $100, for a total of $600, and 6 months at $110, for a total of $660. The full year is $1,260 (600+660). That is equivalent to a 5% increase in sales of $1,200 instead of 10% if you do it on January 1st. We’ve now demonstrated that to calculate the increase, we need to count how many months are there at the new price. If we do it on July 1st, is one-half (6 out of 12 months); if we do it at the end of the first quarter, we have thee quarters or 75% of the impact; if we do it in the last quarter, we have 25% of the impact.
4. What if my price decrease is only for the first quarter?
Following the example we built above, your sales will now be 3 months at $110 and 9 months at $900. The total is now $1,230 for the entire year, which is 2.5% higher than $1,200. As shown above, the impact for one quarter (3 months) is 25% of the increase. 25% of 10% (from $100 to $110) =2.5%
5. Change price by Region, Business Unit, or Product
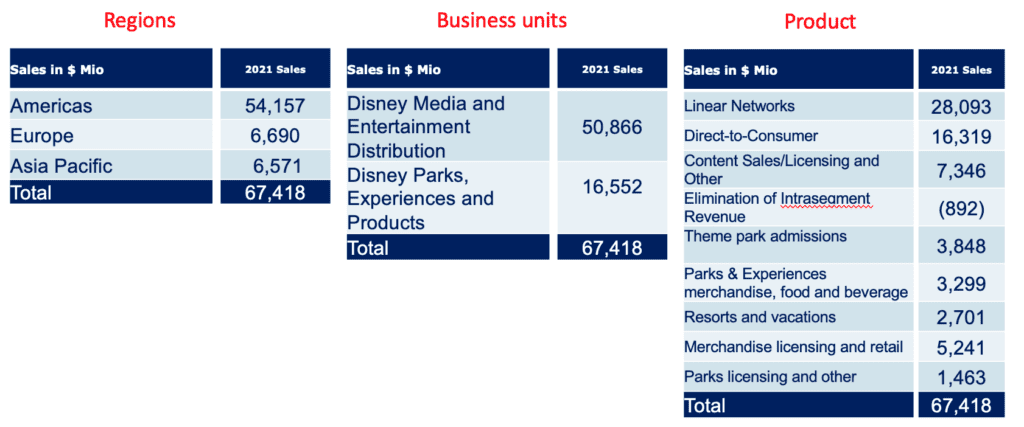
I’m uncertain about whether to change the price by region, business unit or product. According to Disney’s annual report, they display sales in all three ways. I thought of changing price by product, but I found some segments, such as content sales/licensing and merchandise licensing, are not directly charging consumers. I don’t know if I should include those segments in this assignment.
From a commercial perspective, you want to make the price increase based on the strongest arguments you are able to make. From an implementation point of view, as a Disney executive, you want to do it taking into consideration how easy it would be for you to get the data. In the table above you show that you have the data for all different segments, so it will make no difference. On the other hand, from a presentation point of view, if you do it by product, would you have time to explain 10 lines in 5 minutes? It doesn’t matter if you can’t go through all of them and exclude the ones for which it’s harder to find data, but the complexity of doing it by-product is what you want to consider.
Altogether, any of the three versions will be fine. For which of the three can you make the strongest case? Do it on that basis.
6. Change prices by region or by product line?
Can I work with price changes by region (North America, Asia, Africa, Europe)? Based on the students’ examples you attached, I noticed that most students were changing prices according to product lines (skincare, makeup, and hair care).
Yes, you can change prices by region. Remember my tips:
Work in whichever format the data is displayed by the company. If you pick regions, use the same regions that the company uses to display the data on the annual report, likewise for products.
Make sure that the totals march. Management always looks at totals first, because those are numbers easier for them to recognize., For example, ensure the total net sales are the same as shown on the charts by the company. Many companies will make minor adjustments for minor brands and other items. Either include that in the smaller region or product or add another line called Other.
7. Companies not reporting on calendar years
January 1st is considered the beginning of Nike’s third quarter, thus the beginning of the second half of the year. How do I account for that?
I recommend we take a pragmatic approach:
· Forget about Nike’s reporting or fiscal years (FY)
· Use a calendar year
· When you use their annual report numbers, pretend they are for a calendar year. For example, the one for ’21, was for calendar year ’21, regardless of whether it was 1/2 for ’20.
These are the advantages of doing this:
· Investors and consumers don’t care about Reporting years. We pay taxes on calendar years, thus we want to know what happens to a company during a calendar year.
· Comparability: companies use different reporting years, so it’s difficult to compare their numbers. That is why figures are always compared on calendar year terms.
To summarize, if you do a price on July 1st (the math is easier than June 1st, otherwise you have to 11/12), assume that has an impact on half of the year, regardless of whether it has an impact on the full reporting year.
8. Where can I find the most recent numbers?
It takes time to have access to the latest numbers, even if you work at the company. Assume the numbers for the year you need them are identical to the ones for the latest year for which full-year figures were published. For example, if you are looking for the 2021 numbers for Nike, used the 2020 numbers instead.
9.Cost, exchange rates, and government regulations.
I have a question about the assumptions
- Do we have to cover the 30% impact of costs?
- Can we assume how much is the exchange rate and how much is volume for the lower sales?
- Regarding the change in government regulations, what is the impact on the number of customers and how many units they can buy?
The described scenario is what happened to many firms during the pandemic. Let’s assume you were in the hospitality business. This is how we will address each of the 3 questions:
- If you were a restaurant and the cost of meat increased by 30%, you want to try to recover as much as possible. You don’t have to, but you need to.
- Yes, you can make assumptions as to how much is the exchange rate and how much is volume. Regardless of what the reason is, just like for the cost increase, you need to find a way to compensate for it.
- For the government regulations part, if you were in the hospitality business, you are only allowed to use ½ of the space due to social distancing rules. In the past you had 100 customers. Now you have 50 customers, and they are also buying fewer products.
10.For those who chose IBM, where can we find the numbers?
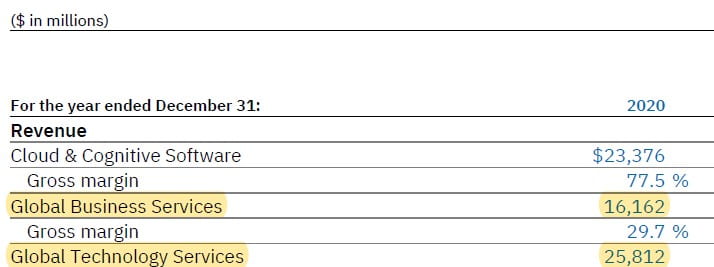
The decisions you are making are at a global corporate level, and you would never have access to a detailed level of information. For example, if you had chosen Procter & Gamble, you will be making a global recommendation for all products sold around the world. For those of you who have chosen IBM, assume that your sales are those shown on Page 30 of IBMs 2020 annual report for the sum of Global Business Services & Global Technology Services or $$41,974. That is, regardless of whether you picked CSR, Artificial Intelligence, Business Transformation, or Marketing & Innovation, assume your sales are $$41,974 in 2020.
If you have to recommend an overall global price change, how much would it be? In this scenario, imagine that you are the leader of these two segments, and the entire revenue is made up of IBM consultants who provide services to 3rd parties.
11. Can you give examples of how to calculate the impact when price changes occur during the year?
Sure, let’s look at 3 examples:
1.Disney + has sales of $300 Million and we decrease prices 5% on January 1st. Thus, the impact is for the full year or 12 months. 5% of $300 gives us -$15.
2.We also increase prices for tickets 20%. Sales are $100. That will be $20 for the full year. But we increase prices on October 1st. So the impact is for three months: October, November, and December.
To calculate it, we do the impact per month ($20 million divided by 12) and then we multiply it by the number of months it will be in effect. Since it will be for 3 months, the impact is $20 ÷ 12 * 3 = $5
3.We also increase prices for merchandise by 40%. Sales are $800. That will be $320 for the full year. But we increase prices on November 1st. So the impact is for two months: November and December.
To calculate it, we do the impact per month ($320 million divided by 12) and then we multiply it by the number of months it will be in effect. Since it will be for 2 months, the impact is $320 ÷ 12 * 2 = $53
Also, would you say it’s more beneficial to have an impact earlier in the year so there’s more time to analyze it?
From a financial point of view, you are better off increasing prices earlier and decreasing prices later. On the other hand, that is also riskier. So yes, if you do it later you have more time to analyze the impact.
12. Do we need to state how much we are increasing prices and when?
The advantage of providing clear information about price changes is that we save the time we would have spent responding to phone calls and emails to answer questions about it.
The disadvantage of providing clear information about price changes is that competitors can gain a competitive advantage.
One thing one can do is to “test” the pricing communication with a few customers to see how they react and then distribute it to everyone else.
We do not want to disclose our sales and the financial impact on customers. That is an internal document.
13. Do we need to respond to the price increase letters?
Yes, at least to some of them. As shown on the instructions:
How would you react if you get an email like that? Please do reply, as a consumer or client.
We want to have the chance to look at this exercise from both sides: as a company, trying to increase prices to others and as a business or customer having a price increase imposed on us.
14. Can we use different price increases in the same communication?
Yes, it’s perfectly fine to have an overall price increase listing different price changes. It’s a good idea to show price decreases first (if any).
It’s not a good idea to send the same note to customers having different price increases. For example, to say that we are increasing prices by 20% in New York and decreasing prices by 10% in Georgia. Customers in New York will believe is unfair. Customers in Georgia will ask for a refund for all past periods saying that they have been historically overcharged. It’s best to keep those communications separate.
15. If I increase North American prices by 10%. Does this mean that the price of each product would increase by 10%?
Only if that is your strategy, to increase prices in all products by 10%. For example,
Big Mac from $3.00 to $3.30
Dollar menu from $1 to $1.10
Hold on. Maybe you want to leave the dollar menu at $1. In that case, the price increase for the dollar menu (what I buy) will be 0%.
The overall price increase then will be less than 10%. Let’s look at one example
Sales With Price Increase Increase %
Big Mac 100 110 10%
Dollar menu 100 100 0%
Total 200 210 5%
The overall price increase in this example is less than 10%. You have increased ½ of your sales (100 out of 200) by 10% and one half by 0%.
16. How do we decide on how many months to apply for the price change? Can we base the decision on store openings, new launches, events, etc.?
Yes, that would be a good way to decide on timing. We need to have an excuse to increase prices because otherwise clients and consumers will want to know why we are increasing prices if the business was doing just fine with the old prices.
Good reasons to increase prices include an increase in cost, and product launches with improved, more costly formulas.
17. My company for this semester is McDonald’s, I checked all their reports and I can’t find individual product sales or region-wise sales
When I checked on Google, I saw that Statista has that information. It’s better if you do it through the NYU library, to get access to Statista Premium. I’ve uploaded their 56 slides PPT into Resources, on the Annual Reports and Statista folder.
18. McDonald’s hasn’t released information by region for Q4. How can I calculate their US sales for 2020?
The advantage of using the 2020 quarterly releases is that we get their latest figures. The disadvantage is that until they release the annual report the amount of information we get on those releases is limited.
Here is a workaround:
On their Q4 sales, their total global revenue in 2020 is $19,207 million. From their published 2019 Annual Report, we see that sales in the US were 37% (7,843 out of 21,077, page 12).
We could then multiply their 2020 sales of 19,207 by 37% to estimate their US sales for 2020 to be around $7,107 million.
19. What does “currency-neutral basis” mean?
Currency-neutral means excluding the effects of currency exchange.