Initial Software and Solar Server Development

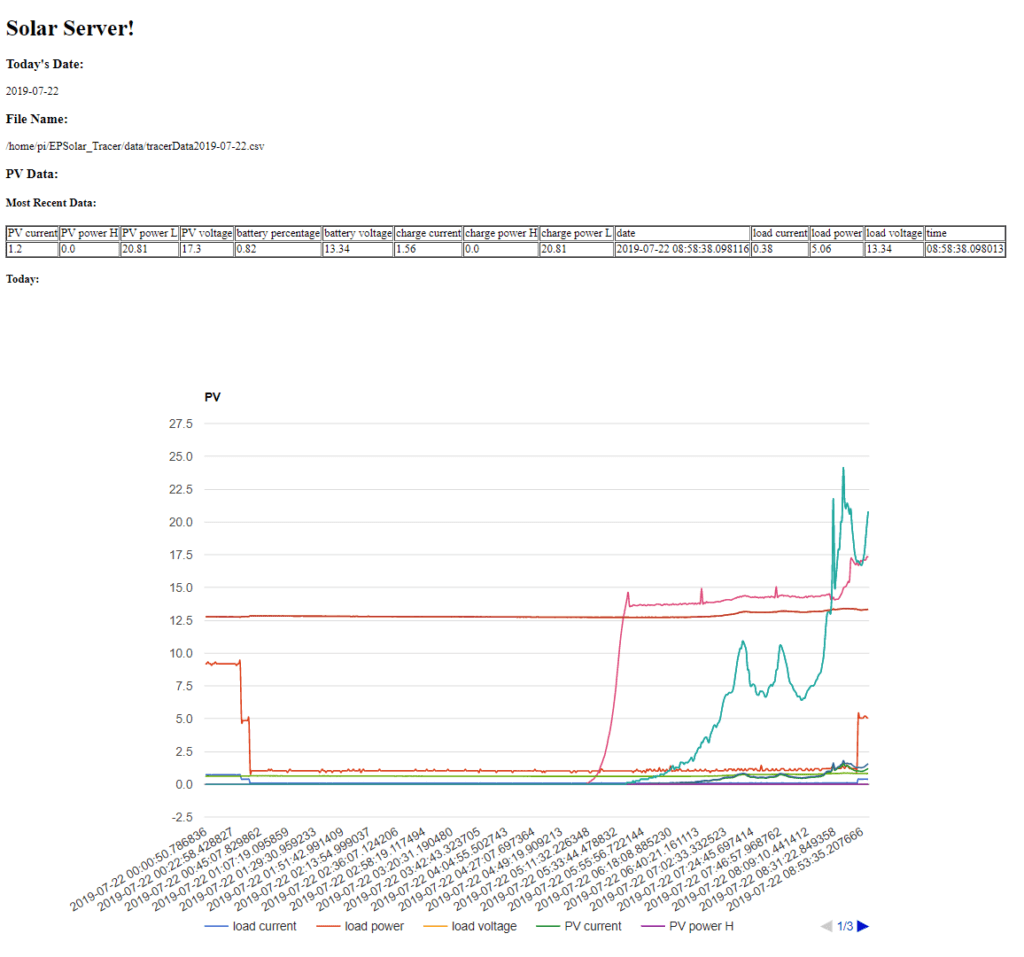
The initial goal was to log data from the solar power system and display it in a human-friendly way via a solar powered server.

Retrieving data from the EP Solar Tracer charge controller is done with python via modbus communication. The script we are using was built-off of work Alex had done previously. The EP Solar Tracer Git Hub repository includes a few different implementations and tools for communicating with the charge controllers. Because we need to log the data, we’re using the Raspberry Pi implementation.

https://github.com/alexnathanson/EPSolar_Tracer

Our initial server is a LAMP server (Linux, Apache, MySQL, PHP). We chose this type of server because of how common and accessible it is.

Instructions for installing the LAMP server can be found here at https://projects.raspberrypi.org/en/projects/lamp-web-server-with-wordpress.

The solarserver Git Hub repository contains the solar powered website content, which is presently written in HTML, PHP, Javascript, and uses the Google Charts API to graph the data. The repository will evolve as we go along.

https://github.com/alexnathanson/solarserver

The next steps will be to develop a low-res testing and benchmarking setup for determining the energy consumption of particular server activity.

Where is Power Consumed on a Website?

All of these approaches have similar end goals but use different tools and techniques to reach them. They all require consideration about what type of content is actually necessary, taking steps towards media austerity, and taking responsibility for the content we produce and consume.

Overall page size is the main determining factor that contributes to a power hungry website. A number of designers recommend starting with a target page size and designing with that target in mind.

Below is an overview of various power consuming aspects of a website along with some approaches that various designers have applied. In some cases there is a lot of overlap between elements based on how designers articulated their processes.

  • Interactive Design

Interactive design that involved dynamic web pages is typically more computationally intensive than static content.

  • Logos

Logos are considered to be a huge source of waste, because they are typically placed on every single page of a site. Designers can cut down on their usage, design for a hyper optimized aesthetic, or use pure CSS and HTML elements to create a logo.

  • Icons 

Icons can be optimized through the use of pure CSS and HTML design, rather than images or external libraries. There are a number of existing examples such as http://nicolasgallagher.com/pure-css-gui-icons/.

  • Fonts

Web safe fonts or default fonts already exist one a user’s computer and don’t require transmitting or storing font data. Is there an functional difference between a default font and a web safe font?

  • Automation, animation, and autoplay

Rather than presenting users with an animated image library, like a carousel, automatically displaying images, or autoplaying motion content, designers can give the user the option to open up an image or play an animation. This way heavy graphics that may be considered crucial can be used when the specific user actually needs them, rather than serving them to all users regardless of the demand.

  • Tracking and ads

Tracking users and ad services greatly add to the carbon footprint of any web service. 3rd party ads in particular are hard to keep light weight. This issue was thoroughly explored in 

  • Content Management System (CMS)

Without taking proactive steps, many CMSs can include a lot of junk that can add to a websites bloat. Kirby is a system that can be configured to be very light and Susty is a WordPress theme that is very minimal.

  • Static vs Dynamic

Dynamic pages are also opportunities for cutting down bloat, because each page requires at least some amount of processing on the backend. A number of designers mentioned that they develop a project as if it will be dynamic, using industry standard CMS tool and then use one of a number of services that will automate the process of turning dynamic pages in to static pages.

  • Hardware Impacts

This aspect is harder to quantify, but it is important for designers to consider the demands that software places on the hardware. One consideration is designing software that maximizes an piece of hardware’s life span by not depending on cutting edge features.

  • Backend

There are a variety of techniques for optimizing backend content, such as combining JS files and optimizing ram through less use of variables.

  • Caching

Some designers have used interesting energy optimizing approaches for cacheing data so that it follows logical user paths.

Assessing Power Consumption and Energy Efficiency of Software

Software energy consumption and efficiency can be determined through a combination of similar top-down and bottom-up methods that are commonly used in other areas of computer information technology (CIT) environmental assessment. The top-down method involves an assessment of the entire system, identifying what percentage of energy required by that system is consumed by your particular technology, and extrapolating the impact. The bottom-up method involves a specific case study that is then generalized.

Assessing the impact of software is complicated by the fact that there probably isn’t one most energy efficient configuration, but a variety of configurations that consume more or less power in different contexts. For example, does the speed of the connection favor different systems? Additionally, the ways that software interacts with specific hardware resources that can be dispatched or allocated via software is also an important factor. This could include running processes on multiple cores, running processes on the CPU vs the GPU, the impact of cooling systems and hardware temperature, and overall runtime, among many other possibilities. All of the variations can be tested, but it makes a simple determination of software energy consumption difficult. Additionally, most web applications do not exist in a void and it is also worth considering the impact of shared resources and browser settings, like cache-ing. Finally, user behaviour is a crucial factor in how these systems operate in real world conditions.

The study, Sustainable software products – Towards assessment criteria for resource and energy efficiency (Kern, Hilty, Guldner, Maksimov, Filler, Groger, Naumann, 2018) uses this combination approach to propose a software specific method for evaluating environmental impact. This paper contains a very thorough overview of existing criteria. Their method specifically focuses on the operation of the software and they note that well established LCA approaches can be applied to the hardware and a general “internet energy intensity” measurement in kWh/GB can be applied to data over a network when the specific network hardware is unknown. These researchers identify 3 primary criteria to consider – resource efficiency, potential hardware operating life, and user autonomy.

Their method for measuring energy resource efficiency dedicates one  machine as the system under test (SUT) and the software is run on that machine. A power meter measures the energy consumption of the SUT. Another computer, the workload generator or test runner, sends commands to that machine. A third computer collects the data from both the SUT and power meter, if needed. For each application a baseline measurement is taken, as well as the software in idle mode (if applicable), and the software running under a variety of typical usage scenarios.

The article How does docker affect energy consumption? Evaluating workloads in and out of Docker containers (Santos, McLean, Solinas, and Hindle, 2018) applies a similar method to measuring the differences between a Docker server and a “bare metal” linux server. The researchers measured the instantaneous wall power drawn by the test system via a Watts Up Pro device. They opted to measure all wall power, because they were interested in power usage of the entire system (CPU, memory, cooling, etc.). They determined the energy usage (i.e. power over time) by sampling the Watts Up Pro data and attached a timestamp to estimate to energy demands of different software implementations. The researchers ran their tests on the server in three different configurations, WordPress, Redis, and PostgresSQL, plus a baseline setup. Of particular relevance to us is their WordPress test. They used Tsung 1.6.0 (http://tsung.erlang-projects.org/1/01/about/), an open source load testing tool, to perform HTTP load stress tests on the wordpress server. Their paper contains detailed descriptions of their methods and the python code they used is also available, though not directly applicable to our work. Some of the articles cited in this paper look specifically at the energy use of virtualization and containers, which may be relevant if we are able to get access to the IDM website server and it turns out that it is not running on its own piece of hardware, but on a virtualized machine operating on a shared piece of hardware.

Overall both papers provide a strong roadmap for determining power consumption of different server configurations. In our particular case, once we finalize our system boundaries, we can select features from the various web designers and researchers who have proposed more environmentally sustainable web design techniques and apply similar tests.