Course: Statistics for Business and Economics
Instructor: Grace Haaf, Assistant Professor Faculty Fellow of Business Analytics
Students enrolled: 40
Technology used: NYU Classes, Kaltura Capture, Zoom, and FlipGrid
Grace Haaf, Assistant Professor Faculty Fellow of Business Analytics, is teaching Statistics for Business and Economics from New York to a class of 40 undergraduate students this semester. This course introduces students to the use of statistical methods, including sampling, standard deviations, proportions, correlation, linear regression, and so forth, and to apply them to empirical situations.
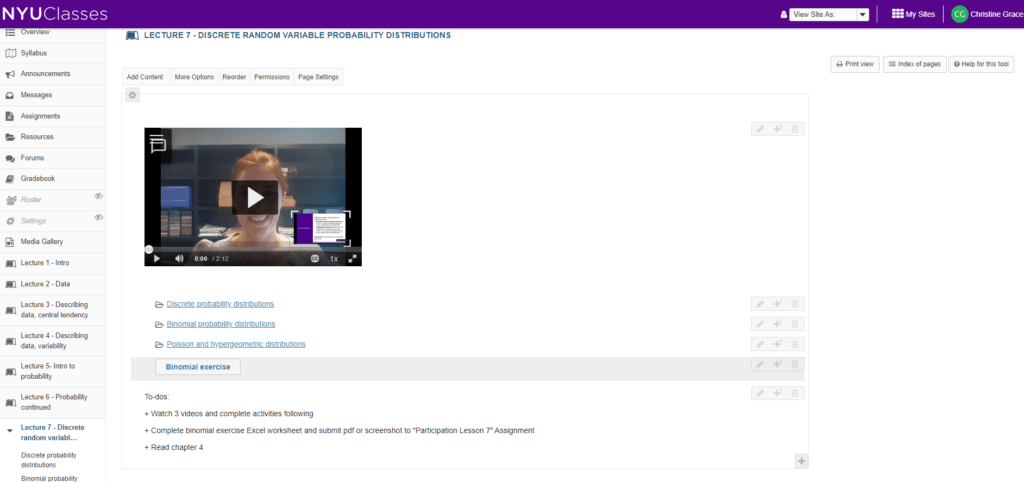
The 40 students are spread out over different time zones with most of them are located in China, South Korea, and the United States, while others are located in South America, Europe, and Australia. Haaf uses asynchronous methods to deliver lectures in order to cope with time zone differences. She records instructional videos using the screen recording tool Kaltura Capture and screen capture on an iPad with a stylus, with which she is able to explain Powerpoints with annotations. All the videos are uploaded and organized on NYU Classes, and students are given 48 hours to watch them after the regularly scheduled class time.
Haaf breaks each lesson into a series of short videos which last no longer than 10 to 15 minutes, in order to maximize students’ attention spans. She also added questions to the end of each video to check students’ understanding of the lecture and make the experience more interactive.

Because students are not able to get real-time responses to their questions in asynchronous lectures, Haaf schedules regular synchronous office hours and accepts personal appointments for face-to-face communication via Zoom. She also encourages students to help with each other by answering classmates’ questions in the videos.
Another challenge Haaf tries to address is that of social isolation. As students are not able to meet each other in person, it takes time for them to become familiar with each other and really engage in the class.
To break the ice, Haaf assigned a self-introduction assignment to the class, where students were tasked with uploading a short video introduction of themselves to FlipGrid. Then, they were asked to watch their classmates’ videos and choose a variable for data collection. By doing this, Haaf hoped that students would get to know each other more quickly while applying statistical knowledge.
Challenges and Lessons Learned
In addition to the issues of low concentration on videos, lack of timely response to questions, and lack of familiarity with classmates mentioned above, Haaf also noted difficulties in setting up devices. “It’s going to take you much longer than you expected to set up the technology. It took me two weeks to adjust and test online tools and devices under the guidance of the IT department,” said Haaf. “So early preparation is definitely needed. ”