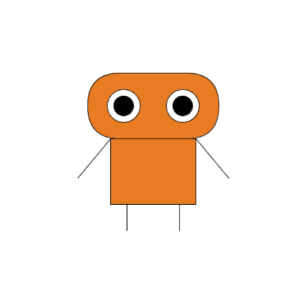
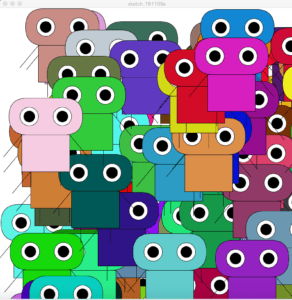
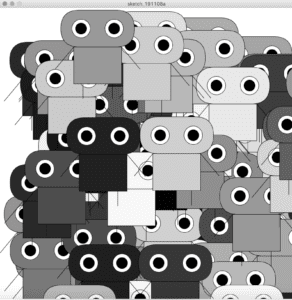
In this recitation, I created a sketch with many similar items at the same time, based on the graph that I designed in class.
Step 1:
In Step 1, we needed to make a function that takes parameters such as x position, y position, and color.
Code:
void setup(){    //step1
  size(800,800);
}
void draw(){
  background(255);
  robot(400,400,233,124,34);
}
void robot(float x, float y, float a, float b, float c){
  fill(a,b,c);
  rect(x,y,200,100,100,100,200,400);
  quad(x+35,y+100,x+165,y+100,x+165,y+200,x+35,y+200);
  line(x+35,y+100,x-15,y+160);
  line(x+165,y+100,x+215,y+160);
  line(x+60,y+200,x+60,y+240);
  line(x+140,y+200,x+140,y+240);
  fill(255);
  ellipse(x+55,y+50,50,50);
  ellipse(x+145,y+50,50,50);
  fill(0);
  ellipse(x+55,y+50,30,30);
  ellipse(x+145,y+50,30,30);
}

Step 2:
Instruction from the recitation website: Create a for loop in the setup() to display 100 instances of your graphic in a variety of positions and colors. Make sure to use the display function you created in Step 1. Then move your for loop to the draw() loop, and note the difference.
Code (setup()):
float x; //step2
float y;
int a;
int b;
int c;
void setup(){
  size(800,800);
   background(255);
   for(int i=0; i<100; i++){
   x =(random(width));
   y =(random(height));
   a =int(random(255));
   b =int(random(255));
   c =int(random(255));
   robot(x, y, a, b, c);
  }
}
void draw(){
}
void robot(float x, float y, int a, int b, int c){
  fill(a,b,c);
  rect(x,y,200,100,100,100,200,400);
  quad(x+35,y+100,x+165,y+100,x+165,y+200,x+35,y+200);
  line(x+35,y+100,x-15,y+160);
  line(x+165,y+100,x+215,y+160);
  line(x+60,y+200,x+60,y+240);
  line(x+140,y+200,x+140,y+240);
  fill(255);
  ellipse(x+55,y+50,50,50);
  ellipse(x+145,y+50,50,50);
  fill(0);
  ellipse(x+55,y+50,30,30);
  ellipse(x+145,y+50,30,30);
}

Code (draw()):
float x; //step2
float y;
int a;
int b;
int c;
void setup(){
  size(800,800);
   background(255);
}
void draw(){
  for(int i=0; i<100; i++){
   x =(random(width));
   y =(random(height));
   a =int(random(255));
   b =int(random(255));
   c =int(random(255));
   robot(x, y, a, b, c);
  }
}
void robot(float x, float y, int a, int b, int c){
  fill(a,b,c);
  rect(x,y,200,100,100,100,200,400);
  quad(x+35,y+100,x+165,y+100,x+165,y+200,x+35,y+200);
  line(x+35,y+100,x-15,y+160);
  line(x+165,y+100,x+215,y+160);
  line(x+60,y+200,x+60,y+240);
  line(x+140,y+200,x+140,y+240);
  fill(255);
  ellipse(x+55,y+50,50,50);
  ellipse(x+145,y+50,50,50);
  fill(0);
  ellipse(x+55,y+50,30,30);
  ellipse(x+145,y+50,30,30);
}
Step 3:
Instruction from the recitation website: Create three Arrays to store the x, y, and color data. In setup(), fill the arrays with data using a for loop, then in draw() use them in another for loop to display 100 instances of your graphic (that’s two for loops total).
Code:
float[] x = new float[100];  //step 3
float[] y = new float[100];
float[] c = new float[100];
void setup(){
  size(800,800);
   for(int i=0; i<x.length; i++){
   x[i] =random(width);
   y[i] =random(height);
   c[i] =random(255);
  }
 printArray(x);
 printArray(y);
 printArray(c);
}
void draw(){
 background(255);
 for(int i=0; i<x.length; i++){
 robot(x[i],y[i],c[i]);
 }
}
void robot(float x, float y, float c){
  fill(c);
  rect(x,y,200,100,100,100,200,400);
  quad(x+35,y+100,x+165,y+100,x+165,y+200,x+35,y+200);
  line(x+35,y+100,x-15,y+160);
  line(x+165,y+100,x+215,y+160);
  line(x+60,y+200,x+60,y+240);
  line(x+140,y+200,x+140,y+240);
  fill(255);
  ellipse(x+55,y+50,50,50);
  ellipse(x+145,y+50,50,50);
  fill(0);
  ellipse(x+55,y+50,30,30);
  ellipse(x+145,y+50,30,30);
}

Step 4:
Instruction from the recitation website: Add individual movement to each instance of your graphic by modifying the content of the x and y arrays. Make sure that your graphics stay on the canvas (hint: use an if statement).
Code:
float[] x = new float[100];  //step4
float[] y = new float[100];
float[] c = new float[100];
void setup(){
  size(800,800);
   for(int i=0; i<x.length; i++){
   x[i] =random(width);
   y[i] =random(height);
   c[i] =random(255);
  }
 printArray(x);
 printArray(y);
 printArray(c);
}
void draw(){
 background(255);
 for(int i=0; i<x.length; i++){
 robot(x[i],y[i],c[i]);
 x[i] += random(-5, 5);
 y[i] += random(-5, 5);
 }
}
void robot(float x, float y, float c){
  fill(c);
  rect(x,y,200,100,100,100,200,400);
  quad(x+35,y+100,x+165,y+100,x+165,y+200,x+35,y+200);
  line(x+35,y+100,x-15,y+160);
  line(x+165,y+100,x+215,y+160);
  line(x+60,y+200,x+60,y+240);
  line(x+140,y+200,x+140,y+240);
  fill(255);
  ellipse(x+55,y+50,50,50);
  ellipse(x+145,y+50,50,50);
  fill(0);
  ellipse(x+55,y+50,30,30);
  ellipse(x+145,y+50,30,30);
}
Question 1: In your own words, please explain the difference between having your for loop from Step 2 in setup( ) as opposed to in draw( ).
Answer: Having the loop in setup( ) only lets the code run once, so the outcome will be a still image. Having the loop in draw( ), instead, lets the functions be looping. The data is refreshed continuously, so the outcome will be an animated version.
Question 2: What is the benefit of using arrays? How might you use arrays in a potential project?
Answer: We can store data in the arrays, instead of writing repetitive functions that wastes time. Besides, by combining arrays with loops, we can store and retrieve all sorts of information. In a potential project, I can create shapes by using both arrays and loops, so that it will enable me to set the shapes in different positions, sizes and colors with parameters at the same time. I can also store predefined data in arrays, and use them as the output of my project.