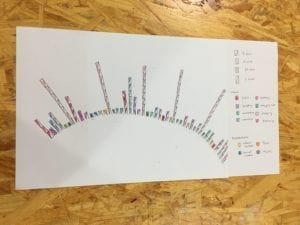
I wanted to keep track of how I spent my time in a given week. Most of the time we are bombarded by distractions, so other than the major events where I spent blocks of time, I also logged how often I was distracted by activities such as social networking and video watching.
I visualized each time segment by using boxes with different slashes to indicate increments of time from 5 minutes, 15 minutes, 30 minutes, and 1 hour. The individual colors represent each activity.