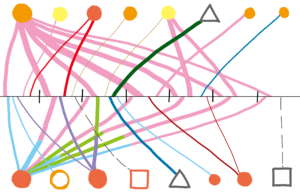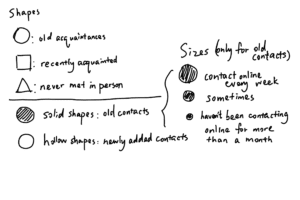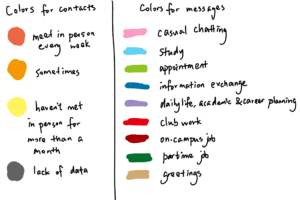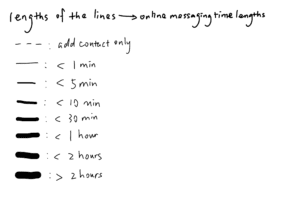
The map I created is a map of my last week’s online messaging. It maps what I used online message for, relative lengths of time I spent on messaging every day, the dates when I messaged each contact and the frequencies of previous online and offline contacts with these people. The representations can be read according to the explanation below.


The data is visualized in this linear way to represent the length of a week. The black line represents the week with seven sections representing each day. Size and width are intuitive in representing time lengths and frequencies. Colors can separate different types of messaging clearly. The density of the ending points of the lines in each day shows the time spent on online messaging in that day. The map shows not only how I use online messaging as a device of communication, but also various kinds of relationships between me and my contacts.
One set of data shown by the lines is about online messaging in the last week. The icons of contacts are placed in the order of their first message exchange with me during last week. This map shows that I used online messaging more on weekdays than on weekends, but more casual chatting towards weekends. Also, the map show that my need for online messaging is mainly based on chatting with friends, keeping track of my work, making appointments and study.
I included another set of data about the frequencies of previous online and offline contacts of these people to find out interesting facts about different online and offline connection patterns with different people. It is intriguing to see that some people who I meet in person frequently do not often communicate with me online. Online messages exchanged with these people are mostly about work and study. Other people that I often chat with but meet in person less frequently have a more personal connection with me in spite of geographical distance.