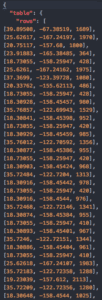
I looked through the WCS data and found that most of the animals didn’t have data downloadable but I was able to get a JSON file of deep sea corals. However the were over 600,000 data points so I decided to look at specifically Stoloniferan coral and I cleaned up the data to only include lat, lon, and depth.

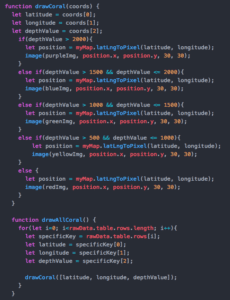
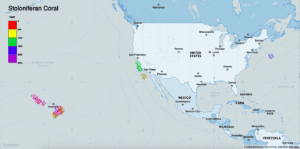
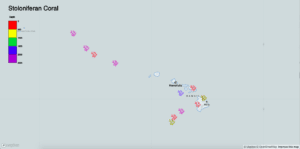
Once I had the data I based my code off Leon’s flight example to find the right piece using console log and then plotting them all. I originally started out just suing circles but then I decided I want to better represent the data visually so I found a coral image and changed it to five colors to show the different depths of the corals.


I also included a legend to match the color of the coral with it’s depth. In the future I would like to make this legend a slider where it will show or hide the corals based on their depth.