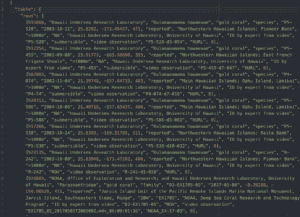
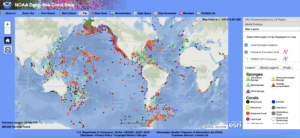
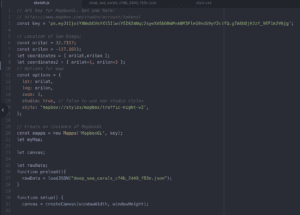
The digital map assignment was particularly difficult for me since it included gathering massive amounts of data and then manipulating it. After figuring out which data to use, I downloaded the JSON files from the MARCOS website, which massive. Going through 20,000 lines of data was extremely difficult. Atom was loading pretty slow, so I went into a text editor and manually selected the data that I wanted to use, which was the gold coral (around 2,000 lines of data) and deleted the rest of the other information. The data is on a local host, like the one Leon demonstrated in class.


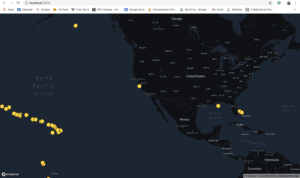
After that, I console.logged the data and created ellipses to show up on my map, to show where the gold corals are scattered around on a world map.
Overall, it was difficult to work with big data and deciphering which one to use which a hassle, but it made the process of coding easier after the data was neatly organized.

