CPD: Digital Map – Ashley Zhu (Chen)

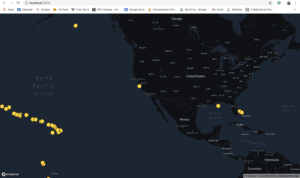
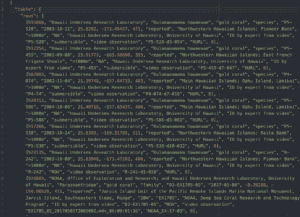
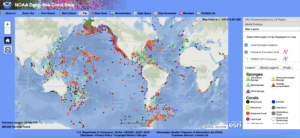
The digital map assignment was particularly difficult for me since it included gathering massive amounts of data and then manipulating it. After figuring out which data to use,  I downloaded the JSON files from the MARCOS website, which massive. Going through 20,000 lines of data was extremely difficult. Atom was loading pretty slow, so I went into a text editor and manually selected the data that I wanted to use, which was the gold coral (around 2,000 lines of data) and deleted the rest of the other information. The data is on a local host, like the one Leon demonstrated in class.

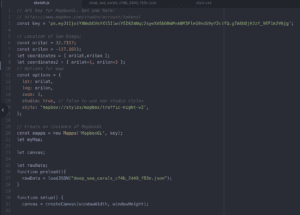
After that, I console.logged the data and created ellipses to show up on my map, to show where the gold corals are scattered around on a world map.

Overall, it was difficult to work with big data and deciphering which one to use which a hassle, but it made the process of coding easier after the data was neatly organized.

CPD: Digital Map–Ann(Candy)

Documented by: Candy Bi

Project name: Color visualization of flight

Professor: Ann

Link: https://editor.p5js.org/candy/full/JDRj8RNQh

Video: video

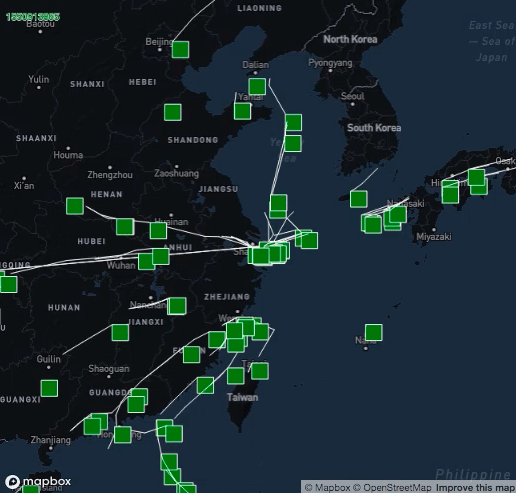
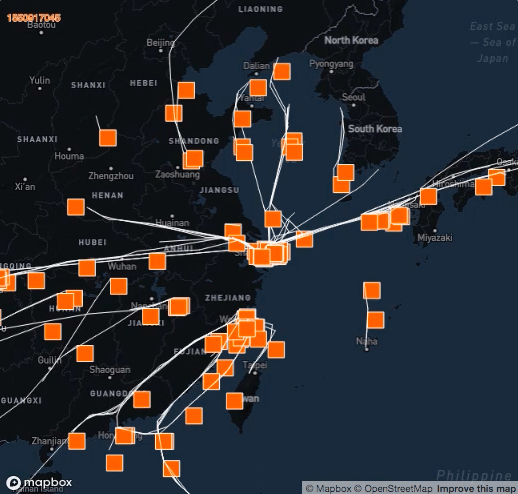
Description: I find it hard to change the data I download from WCS into nested json data set. Thus I choose to develop on the data of the flight we use in the workshop. What we already have is those planes flying to Shanghai as “clock” goes. To better visualize the data, I made each plane a rectangle and make them bigger. The time is visualized by different colors rather than just displayed on the top-left of the canvas: all planes(rects) are originally green, as time goes, they became redder and redder. “Clock” on the top-left corner are made the same color of those planes. This way, by looking at image itself, audience could get a direct idea of what is going on. Lines are drawn to display the trial of flying.

Week 3 – Digital Map – Jingyi Zhu

Date: 03/06/2019

Links: Full screen: https://editor.p5js.org/jz1111/present/n2Ed68jPW

           Codes: https://editor.p5js.org/jz1111/sketches/n2Ed68jPW

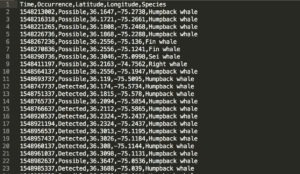
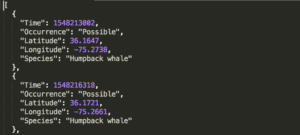
I first manually processed the data collected from a robot about baleen whale acoustics from “Autonomous Real-time Marine Mammal Detections” website. The part of data I used is the location, time, species of whale and certainty of the detected sounds. I used Python to clean up the file and used an online converter to convert the csv file to json file. It was hard to decide on the organization of different categories. Since I chose to map the data according to the time of detection and due to my limited file manipulation skill, I organized the data with non-nested objects and put the objects in an increasing order of time.

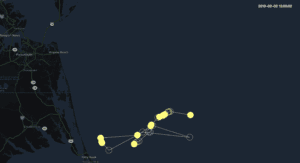
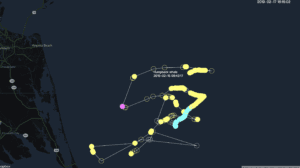
Then I made the digital map based on Leon’s example. The duration is from January 23rd, 2019 to March 3rd, 2019. There is a clock on the upper right corner telling the time. The solid circles stand for certainly detected whales and the hollow ones are possibly detected whales. Yellow stands for humpback whale, magenta for right whale, cyan for fin whale and green for sei whale. The lines show the route of the robot during this period of time. Each circle and line appear once the clock passes the time of the detection of each whale. The animation repeats after all the data are drawn on the map. I also added an interaction. When the mouse hovers on each circle, the species and detected time will be displayed.

Reading Response 1–Ann(Candy)

A Four-Century Retrospective of Marine Fauna and Fisheries Around New York City

The authors provide a quite detailed picture of fishery industry in New York City by providing related information of the past four centuries. They point directly to the problem of overfishing that though species composition has changed relatively little, population sizes, and the mean size of individuals have greatly declined. It surprises me that facing such situation, government is still investing into the expansion of fisheries and promotion of
seafood consumption. However, I do acknowledge that this is a difficult problem to solve for governments worldwide. Overfishing does not seem to be a new problem and It is impossible to simply tell the population just stop consuming fish. The problem is how we deal with it. I recall a good example I saw on TV: fishing nets is made to suit the size of local species in a way that it would avoid small fishes that are still young.

WCS Informational Sheets

It is my first encounter with this organization and I am deeply impressed by what they are doing. I really appreciate the education program WCS founded for it is crucial important to educate children about the current natural situation on the planet. Since 1895, WCS gradually involved 60816 members. However, I do think this great organization should get more attention from the society and I believe it will.

The Ainu: Beyond the Politics of Cultural Coexistence

This article presents the charm of Ainu music and dances as well as their situation and struggle in Japan. It seems to me the Japanese government is trying to deny the existance of this minority by claiming there are “no pure Ainu people”. One culture can only be protected when it is acknowledged by the public. The first step to take for Japanese government is to recognize Ainu before it trys to protect its culture.
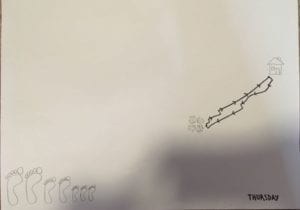
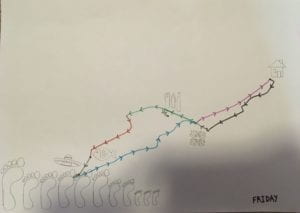
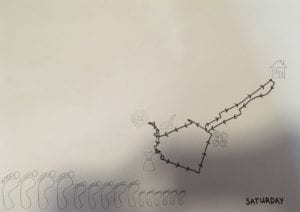
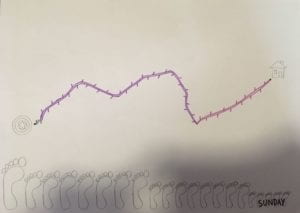
CPD Data Visualization – Hope Myers

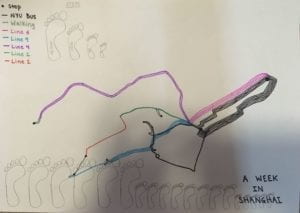
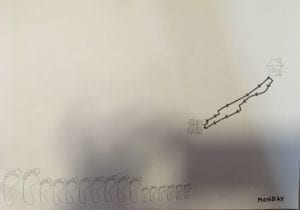
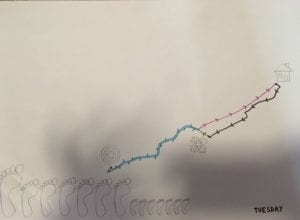
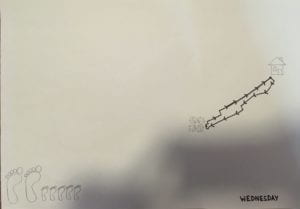
For my week of data project I decided to map out everywhere I went by mode of transportation. I color coded the lines based on the color of the subway lines and used black and grey for bus and walking repectively. The full week is compiled above and below are individual days. The number of lines represents how many times I followed the same path, for example throughout the week I took the NYU bus to school six times and took it home from school four times. On the individual day maps I used arrows to show which direction I was going and included icons to represent what I was doing at each place, but I thought including these on the week map would make it too crowded. I also included a count of footsteps, which often correlate with where I went, for example monday, wednesday, and thursday I only went to and from the AB and my footstep count was much less than other days.