Week 7: Geocinema – Hope, Theresa, Vicky

Collaborative Project Development – Geocinema

Hope Myers, Theresa Lin, Vicky Chen

March 25th 2019

Shanghai: The Sinking City

https://drive.google.com/file/d/1JceFybAID001YDOmid5qdkas_CKWLiEz/view?usp=sharing

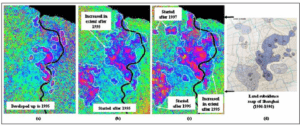
In the beginning we struggled a little bit because we did not completely understand the concept. We originally decided to focus on the area of Lujiazui but were having trouble relating it to the concept of weather. After spending a lot of time on google we found a paper talking about the subsidence of Shanghai and after researching the issue more and finding it very interesting we decided to base our geocinema video on that. However we also still focused on Lujiazui and the bund because those are the areas with the tallest buildings and most subsidence.

We started off storyboarding using the five categories Solveig and Asia showed us in their workshop and from there we were able to create more of a timeline. The structure of the video is based of the history and development of Shanghai as a land mass as well as a city.

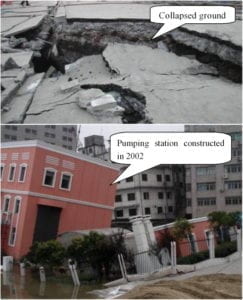
When deciding what assets to use for our video we had a bit of trouble originally because the concept of subsidence is hard to show since the movement is so slow and we also could not film underground. We decided to shoot mostly cityscapes, people, and the metro to cover all the aspects that impact ground subsidence. We also found some graphs and timelapses online. One thing we wanted to shoot ourselves was the cracks or sinkholes on the streets, however since they get repaired very quickly we did not find any and instead used pictures posted by other people.Vicky also hand drew an outline of the Shanghai skyline which we used to create a stop motion animation. With Ann’s suggestion to create a clip of what we imagine the future of Shanghai to look like, we submerged the drawing of the Bund in water to blur the ink. This created the illusion and our interpretation of what Shanghai would be in the near future. We felt like it would give our viewers a more tangible image of the importance of this issue.

Because we already had a good idea of what direction we wanted to take our film in, the editing process was fairly simple. All we had to do was combine the footage and photos into an order that matched with our script. We also decided to add subtitles so it would be easier for the audience to understand clearly what was being narrated in the video. We added Chinese translation because it’s an especially important topic for Chinese speakers since our video is about Shanghai.

Overall we are pretty happy with how the film turned out and I think it captures the story that we were trying to tell. If we were to work on it more in the future, and maybe make it a longer film, it would be nice to be able to find some of the cracking streets as they happen. It would also be interesting to extend the story line more to include the aspect of climate change and rising sea levels and that impact on Shanghai’s elevation, as well as interviewing some local people or government officials to see what they know about the problem and what things can be done to prevent it.
CPD | Digital Mapping | Ashley Friedland

For this project, I wanted to map out the Sea Pen data from MARCOS. I downloaded their data and took a few of the locations from it to put into my code. I based my code off of Leon’s workshop. I took the code he made with us, copied it into a new p5.js project, and typed in the new longitude and latitude. But for some reason, the Sea Pen data wasn’t showing up. I tweaked the code in different ways to see what was showing up. It would only show the first one, and sometimes first two, and then wouldn’t show the others. I’m thinking there is a small typo or incorrect calling in the code that I can’t find. I decided not to upload the whole JSON file to the project, because the sets of brackets and braces were so dense, I’m not sure I would’ve been able to correctly call the data I wanted. 

This is the code I currently have: https://editor.p5js.org/ashleyfriedland/sketches/fCuTAgYQt

CPD Digital Map – Hope Myers

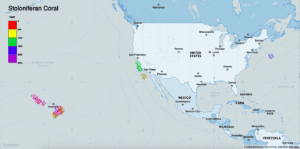
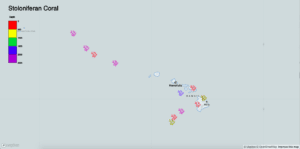
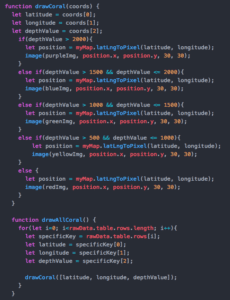
I looked through the WCS data and found that most of the animals didn’t have data downloadable but I was able to get a JSON file of deep sea corals. However the were over 600,000 data points so I decided to look at specifically Stoloniferan coral and I cleaned up the data to only include lat, lon, and depth.

Once I had the data I based my code off Leon’s flight example to find the right piece using console log and then plotting them all. I originally started out just suing circles but then I decided I want to better represent the data visually so I found a coral image and changed it to five colors to show the different depths of the corals.


I also included a legend to match the color of the coral with it’s depth. In the future I would like to make this legend a slider where it will show or hide the corals based on their depth.

Geocinema Storyboard – Hope, Theresa, Vicky

Blog post:

For our storyboard, we want to focus on how development and change on the Bund has affected the geology of Shanghai starting from the late 19th century to the present.

Location: underneath shanghai (geology)

  • Shanghai is built on soft sediments
  • It has developed a lot in the past 50 years
  • The bund was the center of activity and the old buildings have been converted into hotels, high-end restaurants, etc.
  • Lujiazui is now the financial center and many new skyscrapers have been built in the past 30 years
  • The first metro line was opened in 1995 and now 25 years later there are 16
  • The population of shanghai has doubled in the past 30 years and it’s also an extremely popular tourist site
  • This rapid development and increase in population has affected the geology of shanghai
  • More groundwater is being used, leading to subsidence (the city is sinking about 7mm per year)
  • Subsidence is also increased in the areas where there are the most tall buildings
  • Metro tunnels being dug deeper have led to some tunnel collapses as well as the buildings above
  • Satellites can capture even small changes in the elevation of ground in shanghai and the government is working to offset subsidence
  • The city has soared economically with all the growth but subsidence and sea level rise has lead to its literal sinking
  •  

CPD Week 3: Carlo G (Professor Ann Chen)

Professor Ann Chen 

Carlo G

March, 10th 2019

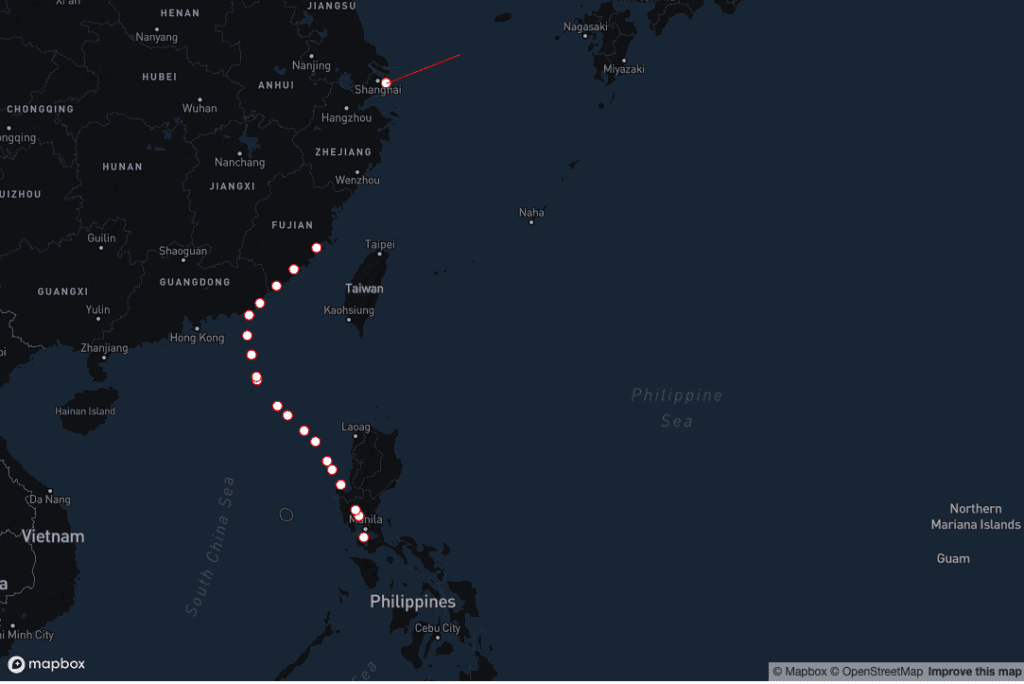
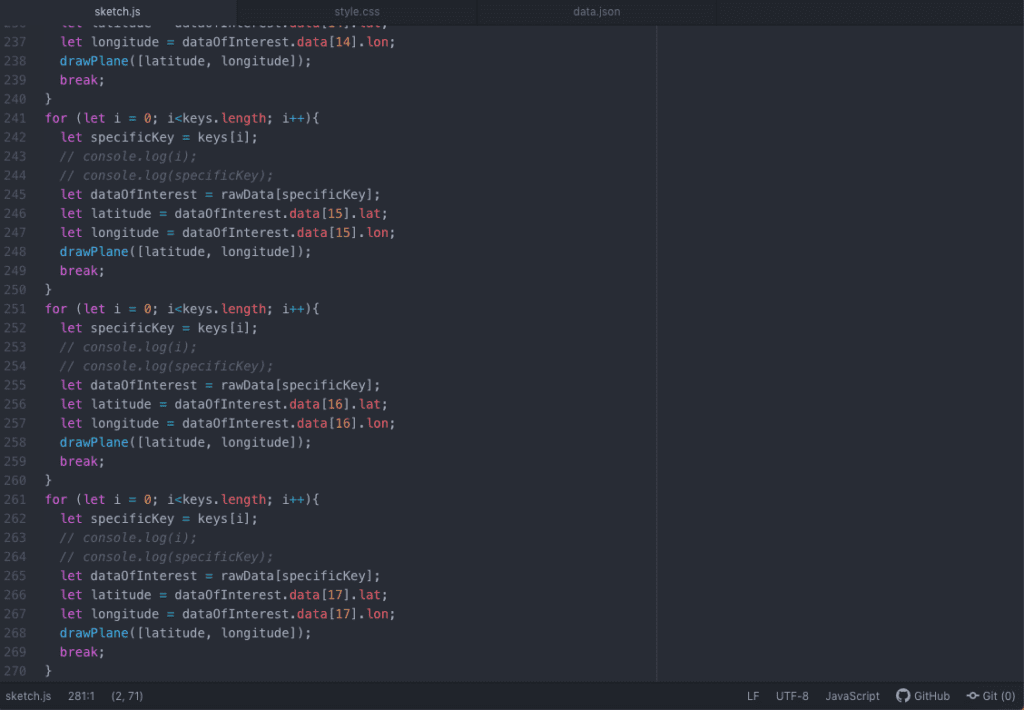
For this week’s assignment, I had to practice with a set of data pertaining to flights across the globe. I decided to track the trail of MH flights from the Philippines to Fujian, China. Using the .json data provided by Leon, I used the information of MH’s latitudes and longitudes to track it on the map. Below are the screenshots of my results: