WCS Progress Report – Jingyi Zhu

Project: Interactive Digital Map – Data Visualization

Date: 04/24/2019

My project idea is to visualize marine animal related data and to raise awareness of marine animals around New York City by making an informative interactive map.

So far, I have identified two datasets that I would like to work with. One is the detection data of two tagged sand tiger sharks in Great South Bay provided by WCS, and the other is the detection data of four kinds of whales outside New York Harbor found on Robots4Whales website.

I am at the stage of understanding and analyzing data, trying to form an idea to visualize the data. Both datasets are about the existence of the target animals detected within the range of the signal receivers. I think a practical way of visualization is to show the frequency or length of existence. My inspiration comes from Nine Point Five Earthquake Visualization, a 3D visualization of earthquakes happened each year. 

Information that I currently need to help me understand the datasets are the age of the tagged sharks, the choice of the locations of the receivers, the detection range of the receivers and the range of transmission the sounds of whales.

I am also planning to add a layer of human activities that might affect sand tiger sharks and whales. After some research, I find that by-catch and noise from marine traffic are two major threats in addition to commercial fishing. I am currently looking for available datasets about marine traffic and fisheries. However, it is rather difficult to find recent data about fisheries.

My plan for this week is to finish data scraping and cleaning of the whale data and data mining of marine traffic and fishery data. My plan for next week is to finish information gathering on sand tiger shark and whales and make a prototype based on my current idea.

WCS Progress Report

-Interactive Trash-

Group Members: Hope, Katherine, Carlo, Sebastian

For this project, we hope to design a game on a website with an interactive comic format.

What we have so far is a webpage with the NY skyline. The story follows the journey of a trash bag once it’s carried into the NY harbor by a gust of wind. As the trash bag sinks into the ocean, it encounters different marine animals at different depths as indicated by the anchor on the right side of the page. Each encounter with a character (ex. microbead, plastic bag, dolphin) is accompanied by dialogue that has a fact about plastic in the ocean. When you move your cursor, the trash bag follows. 

https://drive.google.com/file/d/1zdD4RLfsXtvCkGyYCND9d6UCBNt8_fDz/view?usp=sharing

The goal is to ultimately make our game more New York Harbor-centric. We hope to incorporate tools that scientists will use underwater such as a magnifying glass to draw attention to particles that go unseen such as microplastics that are as small as 5mm; more trash in the water to illustrate how most wastes do not simply float at the top of the water; and possibly new, unexpected ecosystems underwater such as recycled subway carts.

For this coming week, we will finalize on the storyboard, characters, and research; continue to work on the website by incorporating new characters; and begin to brainstorm on the audio component.

Ainu Website Progress Report

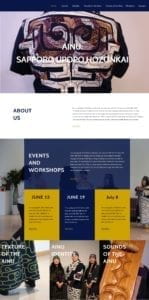
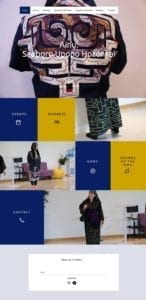
So far, we created four different mockups of the website homepage using Inviison Studio. We chose a navy blue (#081748) as the primary color and a darker yellow color (#CCA300) as the secondary. The navy blue reflects most of the Ainu’s apparel. The layout of the website are based on actual Wix themes that we were considering.

From the feedback we received in class, most preferred the second layout where an events section is shown on the homepage. This way, the events and workshops section is emphasized as a bigger part of the Ainu group’s focus. Some people were unsure about the color combination, mainly the yellow color. There was also suggestions for more image transition so there would be more interaction.

Next, we would like to focus on actually making the website on Wix and add transitions to the images. We are also planning to start going through the content and start the editing process.

WCS Progress Report 4/22

Team Members: Maike Prewett and Candy Bi

Candy and I started by researching and collecting data on different animal measurements, and figuring out ways to represent these measurements in an urban landscape.  Some examples of this were:

    • A North Atlantic right whale’s swimming speed (5-6 mph) which is roughly walking speed
    • the speed of oncoming cars in a residential street (25-30 mph), which is roughly the same speed as a shortfin mako’s average swimming speed (with bursts up to 46 mph); a mako shark will be slightly shorter than a mini Cooper
    • the size of a street bike (a spiny dogfish will be slightly shorter and a leatherback sea turtle 1-2 feet longer)
    • if the listener goes to the 7th floor of a building, they will be able to gauge the depth from the surface to the bottom of the Nearshore Zone (72 feet) and be able to view how far the Nearshore Zone extends to (about 8 miles from shore; someone on the 7th floor will be able to see about 10 miles)
    • if the listener goes to the 40th floor of a building, they will be able to visualize the depth of the continental shelf

We used the following audio projects, documentaries, conservation projects, and sound libraries as inspiration:

After collecting this information, we had to choose a narrative scope and focus for our interactive sound walk. Candy and I decided to focus our scope on a single animal, the North Atlantic right whale (which is endangered). So far, we have begun writing chunks of script using Janet Cardiff’s style of narration. Some examples are:

    • A right whale is about fifty feet long. That’s as long as a semi-trailer, or the length of twenty average-sized footsteps. Let’s walk together – ready? One…two…three…four…
    • A right whale can dive to depths up to 1,000 feet, which is roughly the height of some of the tallest skyscrapers in New York. Imagine you’re deep in the ocean, surrounded by blue water. You look up and see the sunlight glinting on the surface, just above the tallest skyscrapers.
    • Currently, there are no more than 400 or 450 surviving right whales. Laying end to end and side by side, these giant mammals would not even fill up a city block.
    • Hold your breath for as long as you can…

This week, we are looking to record a demo, edit it in post-production, and user test it next week.


CPD – Geocinema Project Personal Reflection – Hope Myers

Shanghai: The Sinking City

Partners: Theresa Lin & Vicky Chen

Link: https://drive.google.com/file/d/1mPz7Hrng-BfNPqdMZegS3uQhRlQHJKIZ/view?usp=sharing

Overall I am pretty happy with how our project turned out. Although it was a little difficult at first I enjoyed the process of matrix storyboarding and learned a lot about how to structure our thoughts to create a coherent story. I agree with a lot of the feedback we got on the film, especially about interviewing locals or government officials and including their clips to break up the monotone of the narration, however since that would have required a lot of time and remaking pretty much the whole video I focused on changing the things that could be done in editing.

Based on class comments I changed the video to:

– make the background music a little softer

– have the line held constant while the outline of the buildings sink below it

– take out the side comment at the government so it can be appropriate for Chinese audience

– take out the Boom to make the tone more similar

– only show the paper with water pouring, don’t let people see the sink

In the future I think it would be interesting to combine subsidence with knowledge about rising sea levels due to climate change to further emphasize the criticality of the issue. One thing that might be cool would be to make a timelapse map, like the ones that show rising sea levels covering Shanghai over time, that also includes subsidence. I found some heat maps of subsidence online which we included in the geocinema video but I think a moving map would be more interactive and make the film more interesting rather than just having a static picture.