Focus Helmet, Rudy Song

Instructor: Rudi

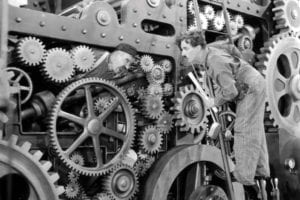
The concept of my final project changed several times over the process of production and testing. Initially, I would like to build a wearable device that visualizes users’ anger into smokes – intimating the anger presentation in the cartoon. However, with the adjustments I have made over time, the concept for the final project, Focus Helmet, is fairly simple – visualizing the level of focus of users into smoke. The idea behind linking the level of being focus and smoke comes from comparing the human brain as engines/machines. With the higher level of input of an engine, the more likely it consistently generates smoke and visualizes its input. It also reflects a larger problem of modern society, we always see ourselves as individuals with freedom of choice and will, but in the meantime, we are always powerlessly subjected to the wheels of the economy. The society requires us always to stay focus on the personal inputs by different means, but rarely ask whether we wanted to do so or not. The recent societal issue of “996” is right on top of this problem. Just like in the Modern Times by Chaplin, workers almost integrated into the machines as part of it.

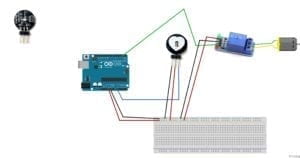
I started the project with the use of a pulse sensor, a relay, and a 5v humidifier. I purchased all the parts and jumped on working on it. Upon user testing, the circuit I built was still with the pulse sensor attached. 

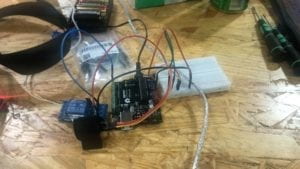
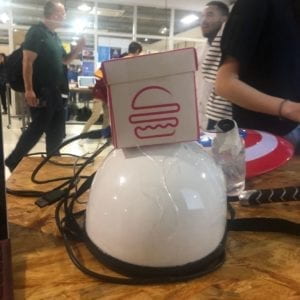
However, because of its raw look, users were not able to tell how to work on it rather than putting the sensor on, especially, because of the comparatively slow change in a heartbeat with the change of emotions, the prototype was not able to visualize the change in the emotion efficiently but only to track the pulse. Thus, I decided to change the pulse sensor to a brain wave sensor which is more efficient in capturing the change in the mind into data. With the Neurosky brain wave sensor I purchased online, I was able to move forward the project. I ran into a lot of difficulties in replacing pulse sensor with the brain wave sensor given the complexity of the brain wave sensor. I had difficulties in nearly all steps of using it, from connecting it to Arduino and coding on Arduino, to analyzing the raw data. The data collected from the brain wave sensor is fairly unstable and ranges dramatically. Eventually, I have successfully mapped it into a range that could sufficiently reflect the individual level of focus, and have the humidifier react to it. On the Processing side, I have applied a real-time graph to present the raw data from the brain wave sensor.  Furthermore, to make it more presentable, I have attached the whole device to a helmet while dismounting the original humidifier into a smaller one attached to the side of the helmet. Eventually, the “focus helmet”, detect the level of the concentration of users, and generates smoke when users are consistently focused.

My project, different from most of the ones of peers, didn’t really involve two actors much “behavioral” interaction, but rather focus on the individual spheres. As I wrote in the previous posts, I believe one of the most important elements of interaction is the process of translation, translating the message from one actor to another, and I have always believed that technology is something that could strengthen the translation of messages. By visualizing a not really visible mental state – focus, my final projects aim to reflect a bigger problem, we are not born to concentrate on things, especially not things we don’t enjoy. What’s the difference between machines and us, if we keep concentrating on things that we are asked to.

Recitation 10, Rudy Song

In this week’s recitation, I created a Processing sketch that can manipulate images with a physical controller made with Arduino. I decided to make a sketch that manipulates the live image with different filters, connecting a potentiometer and a button to the Processing.

However, the processing of doing so was quite challenging, most of the time I was struggling with making the live image pop up. It ended up to be the problem of my laptop setting and resolution settings. With the help of Tristan, I was eventually able to set up the potentiometer to send analog values to Processing and adjusting the filter of the live image.

 Reflection:

Computer vision, with its development, has been applied in a wide range of different uses including interactive art. I am pretty sure that our work is far away from the computer vision described in the text, but I do believe the media controller opens the door for peers who have an interest in this trajectory. By connecting values on the one hand to a camera on the other side, computer vision strengthens the human vision by further processing and analyzing the data. Rather than strictly comparing computer vision and the work I have done, I would say the concept behind it was generally similar – media manipulation.  Reading the article does further my understanding of the meaning of the media controller exercise, knowing that simple manipulating the filters and sizes/speed could serve as a stepping stone for digging deeper into the whole system of computer vision.

Recitation 8, Rudy Song

Exercise 1,

In this week’s recitation, I have made an Etch A Sketch with Processing and Arduino, sending analog values of two potentiometers from Arduino to Processing. I met some difficulties when there is some delay in the value sending, and led to several crashes of my system.

The final look is like this,

The code for Arduino is as following,

int valueX;
int valueY;

void setup(){
Serial.begin(9600);
}

void loop(){
valueX = analogRead(A0);
valueY = analogRead(A1);
Serial.print(valueX);
Serial.print(“,”);
Serial.print(valueY);
Serial.println();
delay(50);
}

For Processing: 

import processing.serial.*;

String myString = null;
Serial myPort;
int NUM_OF_VALUES = 2;
int[] sensorValues;
float x, y, lx, ly;

void setup() {
size(500, 500);
background(0);
setupSerial();
delay(1000);
updateSerial();
printArray(sensorValues);
lx=map(sensorValues[0], 0, 1023, width, 0);
ly=map(sensorValues[1], 0, 1023, height, 0);
}

void draw() {
updateSerial();
x=map(sensorValues[0], 0, 1023, width, 0);
y=map(sensorValues[1], 0, 1023, height, 0);
if (keyPressed && key==127) {
background(0);
}
stroke(color(255, 255, 255));
strokeWeight(2.5);
line(x, y, lx, ly);
lx=x;
ly=y;
}

void setupSerial() {
printArray(Serial.list());
myPort = new Serial(this, Serial.list()[1], 9600);
myPort.clear();
myString = myPort.readStringUntil(10);
myString = null;

sensorValues = new int[NUM_OF_VALUES];
}

void updateSerial() {
while (myPort.available() > 0) {
myString = myPort.readStringUntil(10);
if (myString != null) {
String[] serialInArray = split(trim(myString), “,”);
if (serialInArray.length == NUM_OF_VALUES) {
for (int i=0; i<serialInArray.length; i++) {
sensorValues[i] = int(serialInArray[i]);
    }
}

Exercise 2

I have written a Processing sketch that sends values to your Arduino based on your mouse’s x and y positions and/or keyboard interactions. However, I was not able to make it work eventually, mainly due to the crashes on my laptop. However, I believe I was really close to getting

it. 

Arduino code is like following:

#define NUM_OF_VALUES 3

int tempValue = 0;
int valueIndex = 0;

int values[1];

void setup() {
Serial.begin(9600);
pinMode(11,OUTPUT);
}

void loop() {
getSerialData();
analogWrite(11,values[0]);
if (values[0]==1){
tone(6,map(values[1],0,1023,200,4000),map(values[2],0,1023,20,200));
}
}

void getSerialData() {
if (Serial.available()) {
char c = Serial.read();
switch (c) {
case ‘0’…’9′:
tempValue = tempValue * 10 + c – ‘0’;
break;
case ‘,’:
values[valueIndex] = tempValue;
tempValue = 0;
valueIndex++;
break;
case ‘n’:
values[valueIndex] = tempValue;
tempValue = 0;
valueIndex = 0;
break;
case ‘e’:
for (int i = 0; i < NUM_OF_VALUES; i++) {
Serial.print(values[i]);
if (i < NUM_OF_VALUES – 1) {
Serial.print(‘,’);
}
else {
Serial.println();
}
}
break;
}
}
}

For Processing:

import processing.serial.*;

int NUM_OF_VALUES = 3;
int values[] = new int[NUM_OF_VALUES];

Serial myPort;
String myString;

void setup() {
size(500, 500);
background(0);
myPort = new Serial(this, Serial.list()[ 1 ], 9600);
myPort.clear();
myString = myPort.readStringUntil(10);
myString = null;
colorMode(HSB,255);
background(0);
strokeWeight(2);
for (int x=0;x<width;x++){
for (int y=0;y<height;y++){
stroke(map(x,0,width,0,255),255,map(y,0,height,30,255));
point(x,y);
}
}
}

void draw() {
if (mousePressed) {
values[0]=1;
} else {
values[0]=0;
}
values[1]=int(map(mouseX, 0, width, 0, 1023));
values[2]=int(map(mouseY, 0, height, 0, 1023));
sendSerialData();
echoSerialData(200);
}

void sendSerialData() {
String data = “”;
for (int i=0; i<values.length; i++) {
data += values[i];
if (i < values.length-1) {
data += “,”; // add splitter character “,” between each values element
}
else {
data += “n”; // add the end of data character “n”
}
}
myPort.write(data);
}

void echoSerialData(int frequency) {
if (frameCount % frequency == 0) myPort.write(‘e’);
String incomingBytes = “”;
while (myPort.available() > 0) {
incomingBytes += char(myPort.read());
}
print(incomingBytes);
}

Final Project Essay by Rudy Song

Anger Visualizer

From my previous research dedicated to the final project, I found my interest in exploring how interactive projects could contribute to the visualization of human emotions and even the emotions of animals. Crawford in his article The Art of Interactive Design emphasizes the importance of communication in an interactive process, and I believe that the interactivity could serve as a platform for extending communication, strengthen and more accurately translate the messages from one actor to another actor. In my previous documentation, I have looked at two successful interactive projects in the genre of emotions visualization: INUPATHY, which visualizes puppies’ emotions into different colors based on an algorithm studying the heartbeat; and Atlas of Emotions, which is an interactive learning tool guiding users in the exploration of their emotions.

To build on my previous research, also acknowledging my limitation in skills in making something as complex as INUPATHY or Altas of Emotions, I decided to narrow my research trajectory down and focus on the visualization of anger and visualizes in a funny manner with the tools of processing and Arduino.

Since I focus on anger, I have been looking for a form of visualization could be easily understood but reflect my understanding of the visualization of anger. One example I have found is linking “smoke” to “anger.” It is often used in cartoons to offer a more direct presentation of the character’s emotions. Once a character turns mad, smokes coming out the head/ears presents their emotion but also implies the “heat” in their head while turning mad. In my final project, I decided to go in this trajectory, and design an interactive machine to visualize anger linking it to both smoke as well as the “temperature of the heat.”

To expand my project, I would like to use the Arduino vibrant sensor to track the change in the heartbeat of the user to translate the change from “calm” to “anger.” Further, with the data collected I would like to link it to a smoke-maker, could be either humidifier or a vaporizer, to function with the change based on the data collected from the sensor. Also, I would like to have the data to be translated into a thermometer of anger with the tool of processing.

Anger to me may not be necessarily a bad status, but rather a release of extreme emotions. This is why I would like a build a mechanism of translating anger into a funny and more visible manner, and in addition, to encourage people to more willing to express anger rather than preserving this negative emotion to himself.     

Preparatory Research and Analysis, Rudy Song

Crawford in his article The Art of Interactive Design has touched on several points that largely in line with my previous understanding of interaction. First of all, interaction is an “a cyclic process involving at least 2 actors in possible forms of senses”. Furthermore, one very important point is that interaction always requires some form of communication, and the communication inevitably involves a certain degree of translation between the messages of actors, either processed on the individual level or with the help of the machine. Moreover, it not only applies to sound and space but also may evolve to other forms of sense. My understanding of interaction gradually become more and richer in the understanding of the importance of communication with more projects I have parted in. I gradually realized that on the definition level, it is true that interaction inheritably falls on the level of exchange between actors via senses, but the specialty of communication defines the significance of interaction.

Two projects have come to my eye while conducting the preparatory research that to a large extent corresponds to my understanding of interaction.

INUPATHY is a technology that visualizes the emotions of puppies with changing colors. It carries an algorithm that tracks the changes of heartbeats, analyzes the change, and translates into several categories. In this sense, the gap in communication between puppies and human, to a certain extent has been filled, making dogs’ emotions, previously less visible and understandable more accessible. This form of interaction has played the communication sphere of the interaction – with the help of the machine, dog owners are more likely to be delivered the message from their pets. 

Another project I have looked at also came in the genre of emotion visualization.  A recent project called Atlas of Emotions takes the idea of detachment in data visualization and turns it on its head. This series of interactive, annotated graphs is infused with the visual manifestations of five universal emotions: sadness, fear, enjoyment, anger, and disgust.

Atlas of Emotions is an interactive learning tool, guiding the user through each emotion, inviting him to explore and contemplate the nuances of each specific feeling. From the triggers that can spur an emotion to the actions with which we respond, Ekman is thorough in his investigation of what makes us human. The visualization of emotions and the interactivity allows readers to view emotions differently, which strengthens the communication, message delivering, via the help of modern technologies.

To add on to my previous definition of interaction, I would define interaction as a cyclic process of exchange and translation of messages,  involving at least two actors, could be either humans or non-humans, in all possible forms of senses. I would argue that because of the inevitable involvement processing of messages in an interaction, technologies, could be simply human language or as future-based as a telepath,  we can always the importance of strengthening messages actors would like to deliver to each other, either intentionally or randomly. Gregory Bateson in his writing classified information as “a difference that makes a difference”, so the interaction, which carries out by the information exchange, is more likely to be the process of difference meets each other and creates commons. 

Reference:

http://atlasofemotions.org/ 

Home

Gregory, Bateson. Steps to an Ecology of Mind: Collected Essays in Anthropology, Psychiatry, Evolution, and Epistemology 1. Chicago: University of Chicago Press. March 10, 2000: 321. ISBN 978-0226039053