https://drive.google.com/open?id=18l2NbgEouwdJFJlJ940HA4EKyNo0yKpe
Nature of Code: Week 4 assignment–Moon(Candy)
Documented by: Candy Bi
Project name: Slope
Professor: Moon
Date: 3/12/2019
Description:
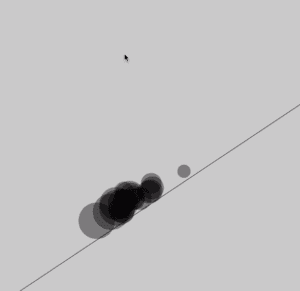
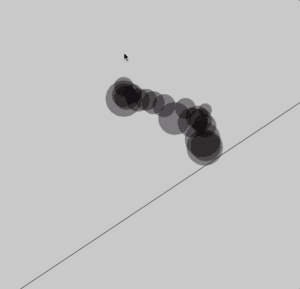
I made a solid slope for assignment 4 which would make the balls bouncing on it. The slope is made as a single line.
To create the effect of balls bouncing on a solid slope, I caculate the angle of the slope and add a force verticle to it to those balls. At first, I just check the position of the balls relevent to the slope and the balls seem to be half-inside the slope: 1.
To make it more natural, I put the “p.size” into my calculation: 2.
Then I make the balls transparent to make it looks prettier: 3.
Kinetic Light Project One_Flip–Eric(Candy Bi)
Title: Flip (headphone)
Documented by: Candy Bi
Professor: Eric
Description:
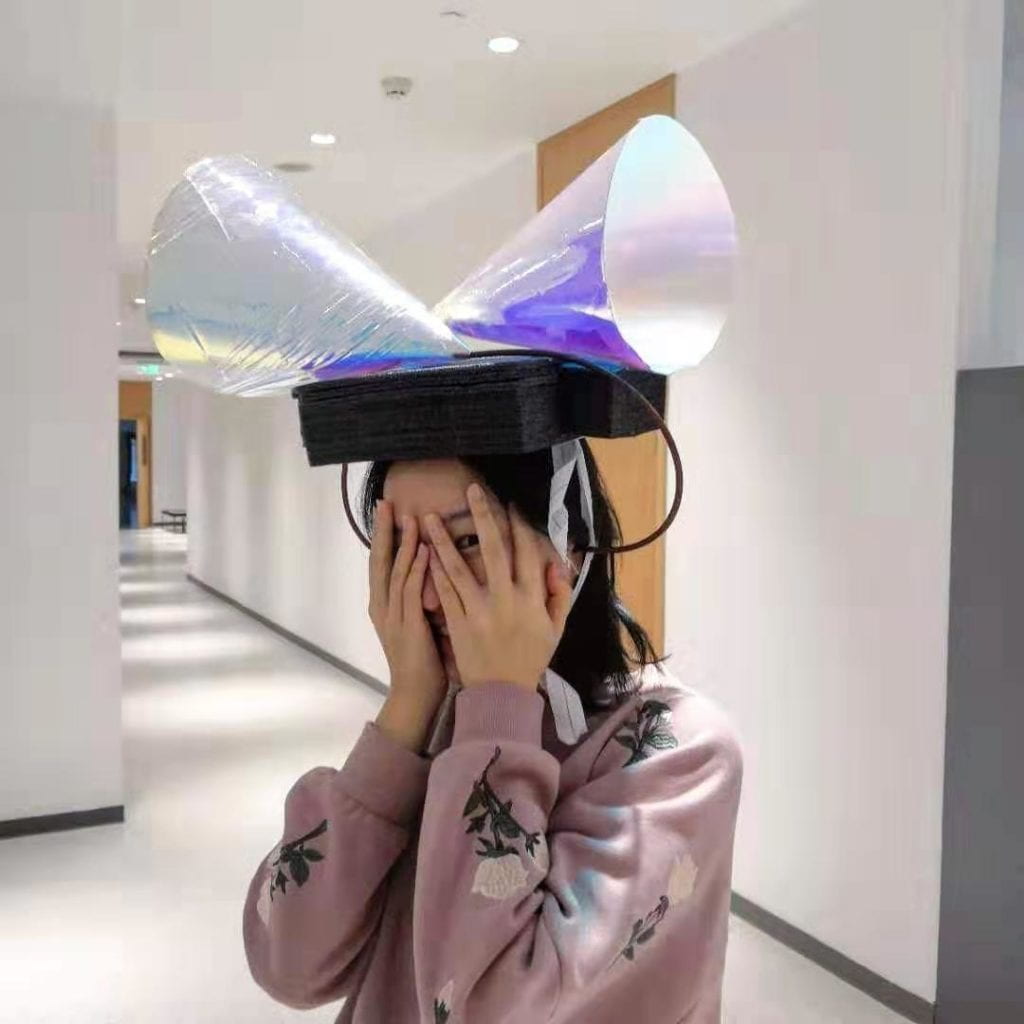
Flip is developed upon the idea of fliping the direction of sound came into the two ears. For example, someone was standing on you left talking to you, rather than hearing his voice in you left year, you would feel like he is speaking on your right.
The inspiration of Flip is a “blindfold walking” experienment in class during which my partner was tring to judge the direction she is facing by listening to the sound surrounding. What if the the sound on the right comes into the left ear and the sound on the left comes into the right ear?
Continue reading “Kinetic Light Project One_Flip–Eric(Candy Bi)”
CPD: Digital Map–Ann(Candy)
Documented by: Candy Bi
Project name: Color visualization of flight
Professor: Ann
Link: https://editor.p5js.org/candy/full/JDRj8RNQh
Video: video
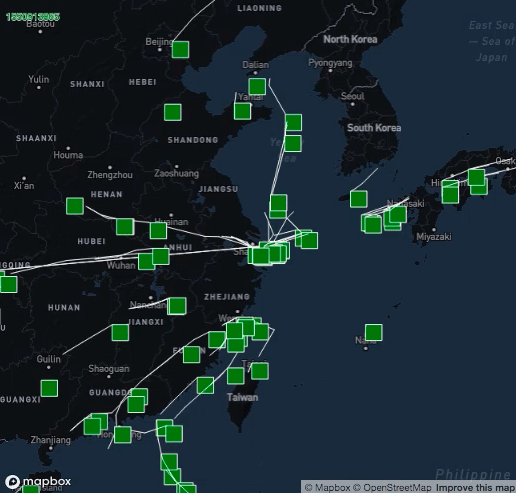
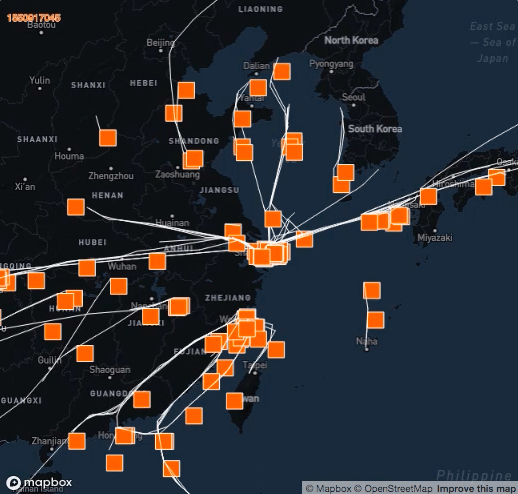
Description: I find it hard to change the data I download from WCS into nested json data set. Thus I choose to develop on the data of the flight we use in the workshop. What we already have is those planes flying to Shanghai as “clock” goes. To better visualize the data, I made each plane a rectangle and make them bigger. The time is visualized by different colors rather than just displayed on the top-left of the canvas: all planes(rects) are originally green, as time goes, they became redder and redder. “Clock” on the top-left corner are made the same color of those planes. This way, by looking at image itself, audience could get a direct idea of what is going on. Lines are drawn to display the trial of flying.
Nature of Code: Week 3 assignment–Moon(Candy)
Documented by: Candy Bi
Project name: Rect Map
Professor: Moon
Date: 3/5/2019
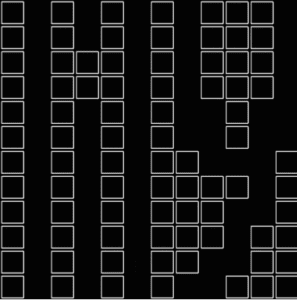
While playing around with vector and object, I came up with the idea of making a map of rectangles that could have some interesting interactions with “mouse”.
I first make a map of reactangles using objects.
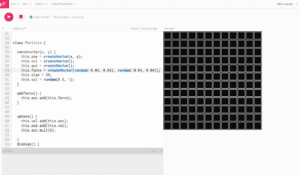
For better user experience, I change the opacity of background in draw function, so that each rect could leave some trails of moving.
I add another fuction of “addforce()”, in which I compare the mouse position and the position of each rect. By using this function, I successfully achieve the effect of rect would only move when the mouse hover on it.
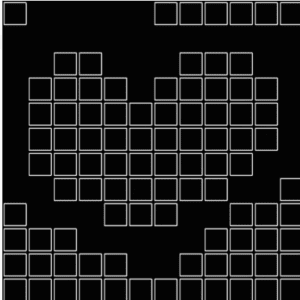 HeartShape Image I drew.
  “Lily” text I wrote.