Final project documentation

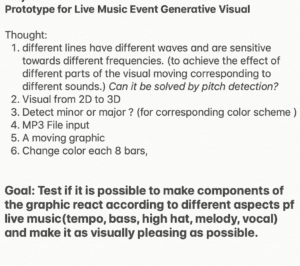
My final project is a continuation of the midterm project. With a goal in mind, I wanted to improve on the midterm based on the feedback I received from the judges.

First, stylistically I should pin down if I should do 3D or 2D visuals. I found that it is hard to create a lot of change visually with 3d visuals because of limiting 3d capacities in p5.js. So I decided to create a 2D graphic as the main visual. Right about this time is also when I was creating designs for my Programming design systems class, I really enjoyed the idea of having a system of design that can output different products that visually represent the same distinct style. So I decided to directly implement some of my designs to the audio visualization project.  

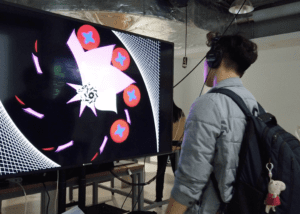
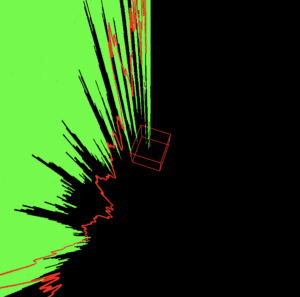
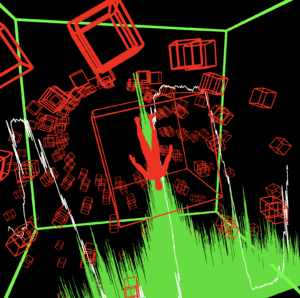
Second, I was also instructed to look into more inspiration from other audio visualizers.  I recognized that there most of the graphics that I really liked have motion in the 3d background that makes the graphics look more impressive. So I added a 3D background that complements the main 2D visual.

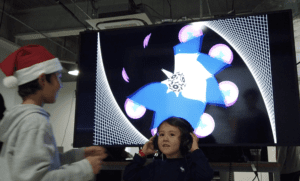
Third, I also received feedback on the style of the graphic only fitting EDM music and hip-hop and not love songs and ballads. So I made a much softer floral design that complements softer songs. 

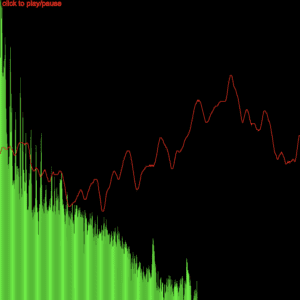
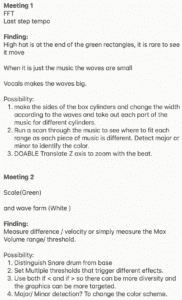
My last and most important suggestion was that my midterms graphics were too centered around the waveforms and spectrum of the audio itself and lacked complexity in utilizing the data from the audio file. To address this issue, I was instructed to take a deeper look into how the spectrum interacts with the music. What part of the sound wave is triggered by bass and what part is triggered by snares and what part by vocals?  After observation, It took some time to calibrate and find the right range of data to select and use. After that, we added further data manipulation to map the value into a usable range for the most effective visualization needs.  

Also, I gave the project a name. I called it META. Because I want it to always change.  

To sum it up, I am so glad to have been able to take MLNI with Moon. Looking back, I am so surprised that I can take part in creating something like this, both visually pleasing and technically complex.  I loved the fact that we presented our ideas at the beginning of our semester as pitch after learning a little about what ML technology can do. It was just enough information for us to recognize the power of the technology and be creative with imagining its capacities.  After that, I was excited to see what kind of prototype I can make to test my idea. In order to create something I enjoy, I was more motivated to work than any of my other previous IMA classes. Big big thanks to Moon for being so patient with me and helping me so much both creatively and technically. 


Final Project Idea

Ideation

  • Something I can continue working in the future.
  • Something that speaks to me.
  • Use the design knowledge I’ve learned and create a design system that can output anything.

My goal; Start building a brand

What’s my system?

  • Design Principles
  • Logo
  • Colors
  • Typography
  • Imagery
  • Voice and tone

Stylistic Elements

  • Color
  • Font
  • Material

Creative elements 

  • Organic
  • Vision
  • Yin yang
  • Chinese Calligraphy
  • Pyramids
  • Wood

Goals for system output

BRANDING

  1. Name
  2. LOGO
  3. Hows the brand different 

DESIGNS OF PRODUCTS

  • Objects with patterns
    • T-Shirt print
    • Chinese handheld toys

Challenges

BRANDING

  1. Narrowing down  concepts to find compatible ones
  2. Finding the right physical thing to convey a message
  3. Making the system upgradable and inclusive.

Perlin Noise

https://editor.p5js.org/Tgr/sketches/PsuHGOIdl

I was interested in the organic free form movement enabled by Perlin noise. 

Centering on the idea of organic shapes I wanted to use a circular shape and put it in motion. 

On my own time, I’ve been experimenting with webgl. So I really wanted to incorporate it into this project. 

This is the result.


This project demonstrates the idea of nonduality with two rotating orbs, one white and one black. Representing there are two sides of everything it is the self (big orb in the middle) to regulate the balance between the two. 

The concept can be easily misinterpreted as duality and not nonduality.  To make sure this concept of togetherness is represented, I set all the orbs to use the same Perlin noise value.  In a way, they move and rotate and breath together as a whole. 

Midterm Tiger Li MLNI

I started off knowing what I wanted to build. Thanks to the ideation presentation at the beginning of the semester, I thought of an idea to improve the live music event experience by integrating generative graphics.  

I immediately thought of the machine learning pitch detection model. The graphic we made in class was two dimensional and consists of two parts. The green representing the scale and the red wave displaying the sound waveform.


I recognized a few challenges. First I have to change the input from the computer microphone to an mp3 music file. Second, I have to find multiple ways of inputting information to the generative graphics for it to change according to the music. At last, there is the graphic itself. The first issue was very easy to address with a simple load function. So I spent the majority of my time dealing with the last two issues.  

I started off by creating the visuals. Professor moon recommended me to check out WEBGL and the rotating box. After making a simple box and changing the usual 2D p5 canvas to 3D I was quite amazed by the results.  


After seeing the effects of 3d in p5 I wanted to explore what else I can do to the graphics. So I searched up some 3D models I can add to the graphics to make it look nicer. 

By adding in a human-shaped model and sine graphic, after some adjustments, I was quite happy with the results.

Meanwhile, professor Moon told me to observe the sound waves and see if I can find any patterns. I realized that certain parts of the waves are reactive towards the base and others are more reactive towards the treble. I also realized that vocals make the waves move in an intense fashion. Most of all the peaking of the base is very rhythmic and shows a very consistent pattern. 

In my second meeting with professor moon, we created a function that sets a threshold for the value of a certain region of the sound wave that is the most reactive towards the base. Seeing the graphics change according to the music, I was mind blown by the results. 

Though the results are noticeable the previous detection method was still not sensitive enough. Then I proposed the possibility of measuring the velocity of the change in the scale. By setting a threshold for the change we were able to achieve a better effect and it is also more compatible with different genres of music.

At last, I made some adjustments to the graphics to math graphics with the bass sounds without having too much going on. 

I was so happy with the results I showed it to all my friends and also my parents paired with their preferred type of music. The response was the best for hip hop and EDM music. Mainly because of the style of the graphics. 

These are the notes I’ve made from setting goals to new learnings and possibilities after each meeting with professor Moon.

I see myself further developing this project in the future and I also gave this project a name. Project META, Because it sounds cool and comes from the word metamorphosis that resembles change.  

Since the majority of the graphics right now are based on the visuals of the actual sound waves, professor moon suggested improving this project by making all the graphics responsive to the actual music itself. I believe taking this advice would take the project to another level and improve my understanding of both code and sound. So I will definitely take this direction. Along with professor Moons suggestion, Tristan also gave very good advice about using lerp to sooth out the graphics. 

MLNI Week 5 HW Tiger Li

To complete this assignment I had to completely understand what the demonstration code was doing. 

To decipher the parts of the code I don’t understand I had to resort to the fellows at the IMA lab. 

The main part, I did not understand about the body pix code was how the rectangles were displayed not by the X and Y value of the canvas but by the index generated from body pix using the camera. 

After figuring that out I was able to brainstorm more ideas on how to make an interesting game based on it. 

As I played around more with the code, I realized that the white rectangles from the original code over a black background are almost like a mouse cursor moving on a black screen. That’s when I had the idea of making a “searching “game.

The goal of the game is to let the users find a red dot using their hands.