Final Project (Net Art) Reflection – Jiannan (Nan) Shi

Project Reflection

Link: http://imanas.shanghai.nyu.edu/~js9686/net-art/index.html

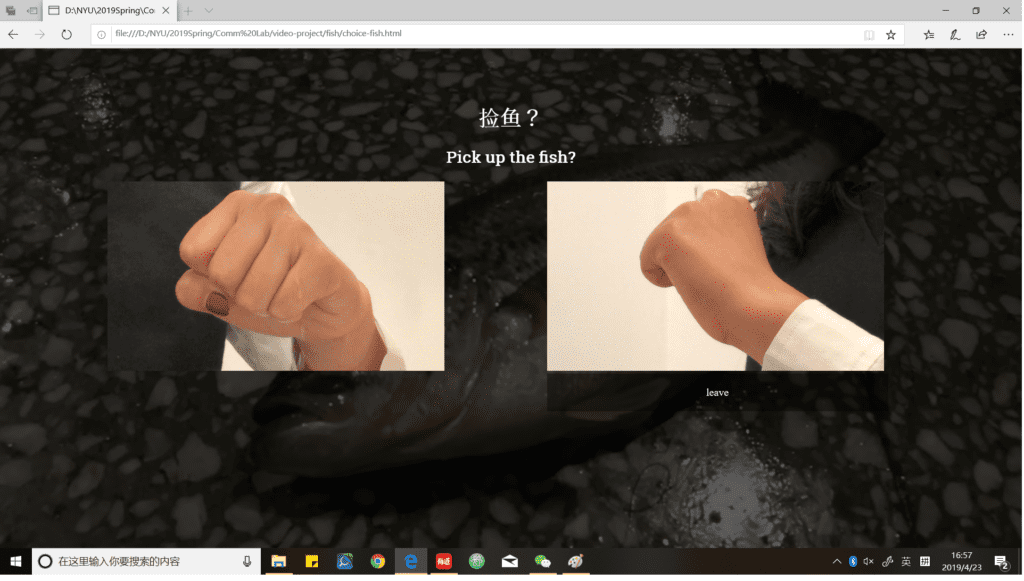
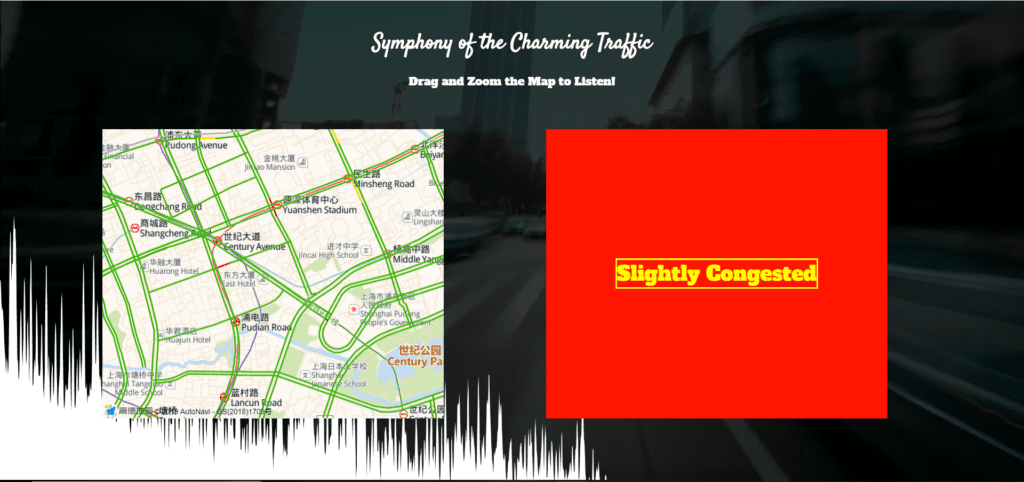
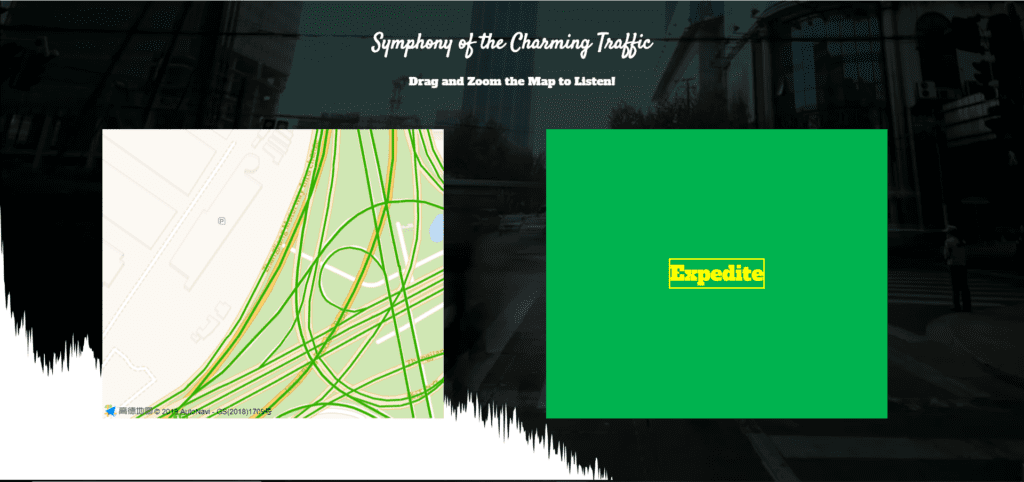
My net art project, Traffic Symphony, presents the traffic status of 40 cities in China in an audio-visual form with API from Gaode map. On the interface of this website. there are two squares in parallel with each other. The one on the left is a map where the user can zoom or drag to locate the portion that he or she wants to see and listen. The one on the right can visualize the traffic status using colors and phrases (green-expedite; red-slightly congested; dark red-congested). When the traffic is expedited, the background sound would be full of cars passing by. When the traffic shows congestion, there would be horns and whistles from the police. The frequency of horns would reflect how congested it is on the road. Meanwhile, there is a layer that is behind the two squares visualizing the traffic sound. The main background is video clips from the traffic.

congested-red
congested status
slightly-congested
slightly congested status
expedite-statues
expedite status

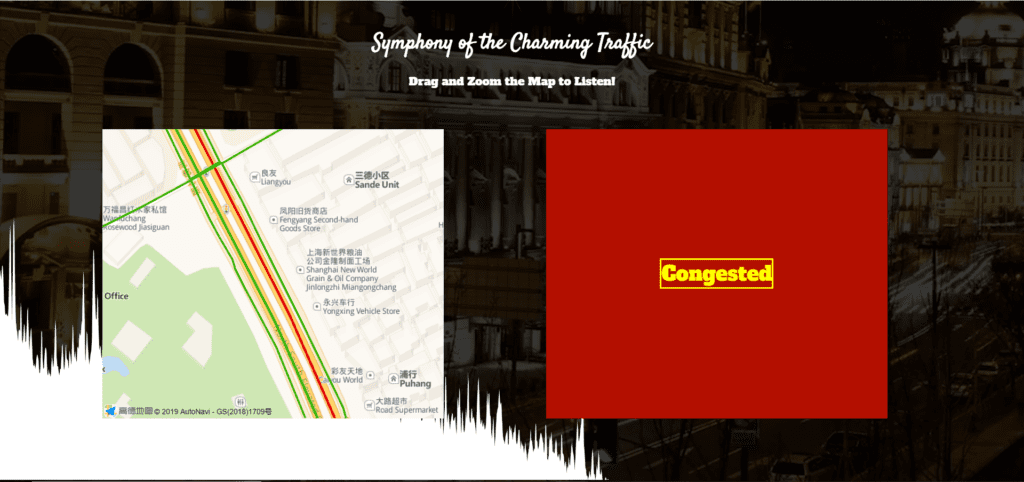
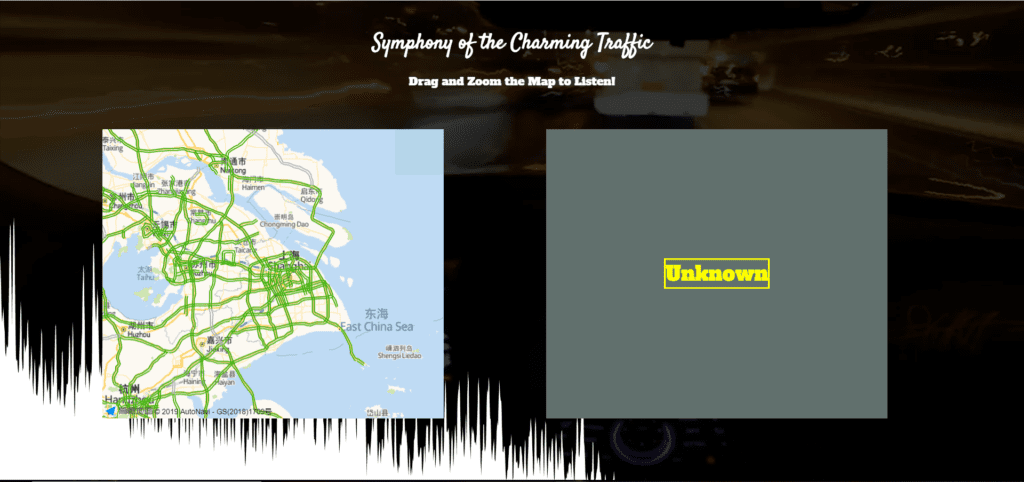
Also, if one moves the map into a place or scale that I couldn’t get information from the API, the square on the right would say “unknown.”

unknown-status
unknown status

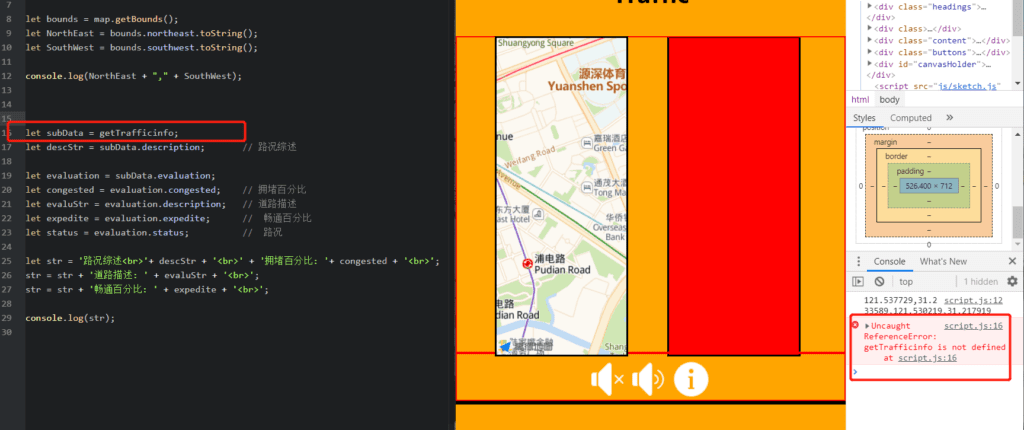
Since I want to use API, I get information from Gaode to see if there are any tutorials that I can follow. However, I only get instructions on how to call the functions using the phrases that they provide. Then I tried by myself to see how to retrieve data from Gaode. This was my first attempt:

JSON-needed
JSON needed

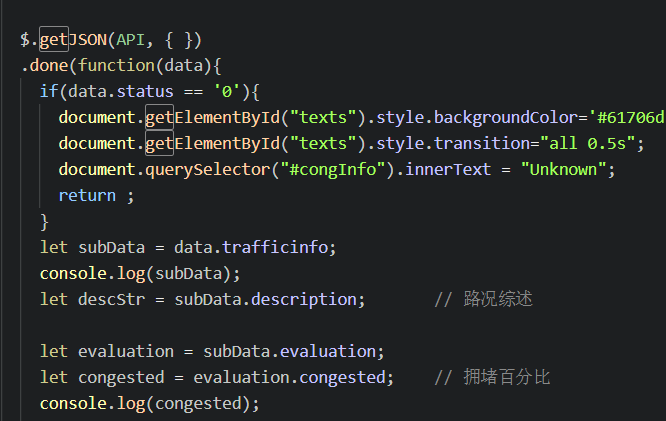
After I put the map on the website, I found that I could not get any data. After a reference to these projects (https://blog.csdn.net/theArcticOcean/article/details/68950692; getBounds: https://lbs.amap.com/api/javascript-api/example/map/map-bounds), I knew that I need to use JSON here, and I revised my code accordingly:

How-I-use-JSON
JSON

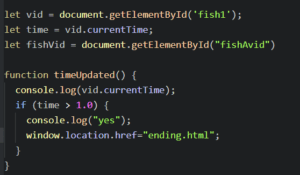
Since my intention is to change the beats according to the traffic status, I tried to use setInterval(“playSomething(), frequency”) to achieve it, and I put the frequency in a format like this in every traffic status:

wrong
it’s wrong

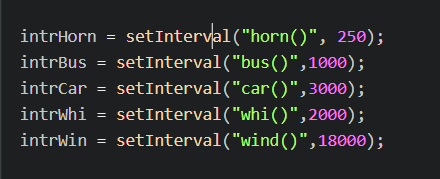
But then I found that if I do this, the functions wouldn’t stop no matter how the traffic status change. In other words, the functions wouldn’t stop after changing the frequency. Then, I tried “return” function, and if I use “return,” the webpage would make no sound. Finally, for the sake of convenience, I only declare frequencies inside each traffic status and created a new function out of the if statements using the frequency generated, and tried to use clearInterval().  However, the functions would still not stop when a new frequency is declared. This confused me for a long time until I met Leon. I realized that I need to declare the variables at the top of the page out of every other functions to let them refresh according to the frequency. I realized that a variable would only work within one function, and it would not be applicable to other functions. I need some global variables to let my functions run.

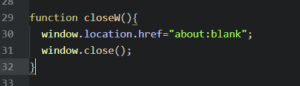
Then it comes the p5.js part that I want to use to visualize the sound (reference: https://p5js.org/examples/sound-frequency-spectrum.html). By referring to the sounds examples on p5.js reference, I found that the audio files could only be loaded within p5 otherwise nothing would be recognized. Therefore, I came up with an I idea that I could read all the sounds coming from the computer to be the source of sounds. However, I found that it is impossible. I later used the mic sounds instead. But, if the user plays with my project with an earphone, the sound visualization would be nothing. After consulting Leon, I know that I can declare all the things in the script.js (map, squares, audios) using one function and then run this function within p5. By doing so, I am able to load sound files within p5 without needing to use the microphone. In order to fill the p5 canvas to the full screen instead of creating one with certain pixels, I also referred to this example: https://p5js.org/reference/#/p5/windowResized.

Due to my limited sense of aesthetics, I didn’t realize how the colored square is distracting because my main point is to show the traffic symphony. If there’s anything to change if I could redo it, I would definitely redesign the layout of the page. In the future, I would play with the API more to see what it could offer, and extend the project without the limit of traffic. If I could read the land use arrangement (which I think I could), I would find other ways to make sounds. 

Internet Art Project Proposal (final version) – Nan

Terrible as many urbanists have argued to be, contemporary urban design orients the traffic web into a direction that is less human-friendly. With the growth of vehicles per capita, traffic congestion happens all the time, and it would get even more intense during the rush hours. Traffic status may trigger emotional change. When you are driving on the road and trapped in a block, it is highly possible that you would get anxious, angry, and even mad especially if you have an emergency. If you always see green lights whenever you meet a road crossing, and the traffic is expedited all the time, it is also highly possible that you would be pleasant. Music or melody, as I would argue, also embody human emotion. A series of tones with high tempo arouses anxiety, and for those with low tempo may express a relaxing feeling. In light of such a connection, I associate the urban traffic status as a kind of symphony that is composed of anxious congestion or pleasant expediteness.

As for my final project, I propose to visualize and audiblize the real-time traffic status within the area out of the user’s choice in the city of Shanghai as an Internet Art. On the website, there would be two parallel squares in the center. One on the left would be the map, and the other on the right would be a board telling the audience how the traffic in the selected area in the map is crowded via an index in 1-10 scale (10 means super crowded). The sound, as well as the background color in the index board, would change according to where the users would move their map on the screen. The piece that the audience would hear would be a composition combined with the audience’s subjective choice as well as what the urban traffic has granted to the web page. The visualization and audiblization of the traffic status offers us a new angle to see the things happening in the urban environment, and

My project idea is mainly inspired by Listen to Wikipedia (http://listen.hatnote.com/) by Mahmoud Hashemi and Stephen LaPorte. In that project, the artists connected the API from Wikipedia, and visualized real-time updates as well as their sizes, with sounds accompanied. It inspired me to use a similar way in connecting the map API, visualize the data and audibilize the information on the website. Another inspiration comes from Matthew N. Le-Bui’s mapping project (http://usc-annenberg.maps.arcgis.com/apps/View/index.html?appid=dfdf73b1faa64daea9cb7835d62ce1can) where the author mapped the artisanal coffee shops and connected that idea with gentrification. This is a drawable, clickable, and scrollable interactive map. Although I would not do one webpage as complex as such, the idea to have a scrollable, scalable, and drawable map is what I want.

In this project, I would use JavaScript and API based on HTML and CSS to frame the webpage. Gaode Map (https://www.amap.com/) shares its API with real-time traffic status with the users, and I could incorporate that in my project with the guidance and help from Leon. As for the audio part, I would look out for sound libraries if there is any that I may use. Otherwise, I would record some scaled sounds from instruments including piano, guitar, drum, etc. The user would interact with the web page by dragging or scrolling (to resize) the map. The audio, or the symphony piece made by the traffic, would be generated from what is on the user’s screen.

Response to Rachel Greene’s “Web Work: A History of Net Art” – Nan

Greene’s work links me back to McLuhan’s statement on “the medium is the message.” The emergence of a new generation of medium evokes a series of changes in communication or idea expressions. The emergence of the internet gives rise to web art, firstly as a new platform of illustrating the traditional art and then after evolution as a whole new school of art. Regarding web art, we need not only to recognize how the development of technology changes the way we communicate but also to appreciate how art thrives in this new medium. The web art combines our visual and auditory sensors as well as interactions together, and therefore it brings us to a new age which opens the door for novel ways of artistic expression and topic discussion. We could talk about more things in different ways, and make a much bigger impact on the surroundings.

Internet Art Inspiration Link – Nan

Project: an interactive data visualization project from the marriage market in the People’s park in Shanghai.

English version: https://interaction.sixthtone.com/feature/2018/Shanghai-Marriage-Market-Data/index.html

Chinese version (identical): http://image.thepaper.cn/html/zt/2018/08/seekinglove/index.html

Following up interactive program:

(English) https://interaction.sixthtone.com/feature/2018/How-I-Matched-Your-Mother/index.html

(Chinese) http://projects.thepaper.cn/zt/2018/xiangqin/index.html

interaction
int
page-4
page4
page-3
page3
page-2
page2
coverpage
cover page

I encountered this website when I was preparing for a research project on the interpersonal interaction in the people’s park in Shanghai. Not only is this website an interactive one where the user could click, hover, or scroll the screen to trigger some function but it also provides socially significant information in an artistic way.

This project inspires me because it makes boring statistics easy and interesting to read on the platform of the internet as the medium. My understanding of media art is basically “media + art,” or the artistic communication/illustration via a platform that is up-to-date. This project by Sixth Tone utilizes the web to tell a story, and it is a practical and artistic use of media. It also inspires me that doing an art project, I could also make it socially significant.

Video Project Documentation – Nan

Project link: http://imanas.shanghai.nyu.edu/~js9686/video-project/index.html

Last update: since Chrome does not offer autoplay function, I changed all the autoplay into an event listener in JavaScript that allows the user to click to start. Play it when you click it.

Project Philosophy (Jamie’s idea!)

People tend to believe that the development of things results from multiple factors, including environmental actors, the subjective choice from an individual, etc. People may believe that the result of one thing in front of us is generated from all these factors in a reasonable way.

However, when too many factors are mixed up and intertwined with each other, how can we make sure that the result we see is led to by an integrative action from all the factors that we are aware of, rather than – a random result that can be led to regardless of what factors are influencing it?

Things, therefore, may develop in a random fashion, and the result may not be led to, as what people imagine, by the factors that they are aware of. Then, what is the power that is determining this seemingly random result?

Project Description

Following our philosophy, we designed an interactive website that allows the users to make choices, choose options, and see the results.

The first scene begins with a water-dropping scenario. When water drops on one joint of your fist, the direction of where the droplet would go may also have to do with many factors, as you are aware of: the inclination of your fist, the roughness of your pore, or the orientations of your fine hair. However, do they actually making the final destination of the water drop different?

The thing that we want to convey here in this project is that: we all make choices, and sometimes would regret some choices that we have made. However, no matter what choices or options that you may have chosen, even if you believe that that you have made a really really bad choice, the result of things may have little to do with that very choice.

Then, we designed three plots respectively to let the users make choice. 

The first one is a moral situation whether you would like to pick the fish up or not. The second one is on whether you would help your friend cheat in the exam. The third one is through the first person perspective deciding whether the user himself/herself would commit suicide or not. Then, there’s a following ending where we explicitly talked about what our philosophy is.

Process:

Jamie, Clover, and I are collectively working on this project. We went shooting together according to the storyboard. Jamie was in charge of directing and filming the scenes, and she was also the major editor. Clover was the professional actress in our film. She was also involved and assisted in coding and editing, without whom our project couldn’t be polished as it is right now. I was the major coder and involved in filming and recording as well.

Following the storyboard, we began to brainstorm where and how we could get the footage that we need. Things went on smoothly, and we just went for shooting on April 12 and 13.

Difficulties during filming:

In the suicide scene, we wanted to have footage that shows the process of falling down to the water. In order to do that, we borrowed GoPro and wanted to record the moment of sinking into the water. However, it turned out that GoPro has fairly strong light sensitivity, and it looks really fake when we went back to see the footage. We finally decided not to use that.

Also, the read-write rate of SD card was not strong enough for a long-time shooting. We have to reduce the resolution of the footage to accommodate that hardware deficiency. We strongly recommend IMA to purchase some decent SD cards for cameras to solve this issue.

DIfficulty in coding:

  1. cannot full screen. Shows like this:
    layout1
    layout1


solution: I referred to the “full screen” sample on our GitHub, and change the code using:

window.onload = function() { adjustVideoSize(); }

window.onresize = function() {adjustVideoSize();}

function adjustVideoSize() {
if (window.innerWidth/window.innerHeight >= 16/9) {
fishVid.width = window.innerWidth;
fishVid.height = window.innerWidth * 9/16;
} else {
fishVid.width = window.innerHeight * 16/9;
fishVid.height = window.innerHeight;
}

2. layout of divs: cannot horizontally be laid out; cannot standardize all items in the same size. See:

layout4-w
layout4-w
layout5-w
layout5-w
layout6-w
layout6-w

Solution: I consulted Leon, and he gave me a wonderful tool to use when adjusting the page layout:

outline: 2px red solid;
outline-offset: -2px;

It helps greatly to see the relationships among browser size, the size of container/div, and the small divs that I am going to arrange. 

To arrange responsible layouts, to calculate the percentages of what I need is of great help. First, set the small divs in a large div/container in which the width = 100%. Then, calculate the width of each small div that I need out of 100%.

3. I wanted to trigger a function after a video is ended. Initially, I used this method that was introduced in class: I read the currentTime of the video showing, and console.log that time. Then, set up an “if” function using the time point near to the end to trigger the function that I want. However, it doesn’t work.

a message
the current time wrong message

I googled and found that I can use “onended:xxxxx” to read whether a video is ended or not, and it solved my problem. (But I still don’t know why my former method doesn’t work.)

4. js cannot close the window via a button: the window.close() function doesn’t work.

This is what I did as an alternative: I opened a blank page to close the current page. But I still don’t know how to close the page ideally. Therefore, I deleted this function.

message
cannot close it

5. After uploading the code, some pages couldn’t work properly. Then I checked the code, and found out two problems:

a) javascript linking to another html failed. I’ve arranged so many js files so I get myself confused in one of the files.

b) some file names have misspelled alternating letter cases.

Then I solved these problems.

Unsatisfactory things:

My code is not scalable enough. I used too many HTML, javascript, and CSS pages inside each segment to trigger interactions, and it added a lot of confusion to my coding partner Clover because every time when we wanted to add a new page to an old page, it was hard to find how to link to the new page and where the original source is. It was only me, the original coder, who was completely clear about what each line of code means. Next time when doing a collective project (or even an individual project), it is always good to make the code clear, simple, and scalable. (It is hard and needs practice, I know.)

For this project, it could have been easier just by linking the common js/css files to different segments, but it’s already towards the end when I discover this trick.

Last update: since Chrome does not offer autoplay function, I changed all the autoplay into an event listener in JavaScript that allows the user to click to start.

Screenshots of our project:

choice-page
choice
ending-page
ending
choices-page
choices
starting-page
the starting page