Final Project – Proposal – Audrey Samuel

In preparation for my Final Project, I looked into a range of existing art installations and interactive educational exhibitions. I then came up with three possible projects that I could work on for my final project. 

1. Walk Through History Board Game

  • For last week’s research blog post I looked into a number of interactive educational projects that have been done in schools and museums. One that I really found interesting was the “Augmented Reality Sandbox”, which allows individuals to create their own topographic map by moving the sand with their hands to create rivers, valleys and mountain ranges. It was very interactive and engaging, as users were encouraged to shape the sand however they wanted which would then project a custom-made map. This made me think of designing a board game shaped like a Historical Timeline (eg. from the Start of World War I to the end of World War II). The board would include various time periods or years during which significant historical events occurred. The players would then have to move roll a dice and move their board pieces according to the number on the dice. When they land on a certain time period, an infrared sensor will detect it and project an animation on Processing with details about the event that occured and its impacts (eg. Treaty of Versailles – 1919). This could be used as a fun way to teach children history and could be placed in a museum or school. 

2. Monuments Around the World!

  • Another project I had previously looked into was an art exhibition in D.C. that was based on an existing cultural festival. This led me to think of the different ways one could use interaction and media to educate the public on historical and cultural monuments within a specific geographical location. In order to persuade users to interact with this project, I would have to design the board and monuments to make them look as fun as possible. I could 3D print these monuments, place them on a board and when users place them in the correct geographical position, the correct animation will appear on a screen (using Processing) providing more details about the monument such as the year it was built, its size, its historical significance, etc. I would incorporate various sensors to match the monument to its correct location (still uncertain about how this would work but I am doing more research.)  This could be used in an educational exhibition on history, geography or cultures around the world for students.

3. Pirate Chase Obstacle Course! 

  • For the midterm, my partner and I made an interactive boat racing game where two players stood across from each other and had to blow their ship towards the finish line. We installed infrared sensors to two separate Arduino Uno boards to detect when the boat was close to the finish line. To develop it even further for my Final Project and incorporate Processing, I thought I could increase the size of the box we used and make it more wider and less rectangular. In this way, we could include various obstacles such as an ‘island of thieves’ in the middle or towards the sides of our boxes so that whenever the boat touched these, either an ultrasonic sensor or an infrared sensor would detect it, emit a sound through a buzzer and project various graphics of  thunder or a storm etc. on the laptop screen through Processing. Through this, we could see if teenagers at a carnival or Fun Fair will collaborate with the other players or be competitive and play against them to win the grand prize.
Recitation 7: Functions and Arrays – Audrey Samuel

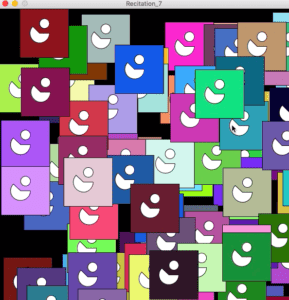
During last week’s recitation, we were required to use what we had learnt in class to create a sketch, incorporating “for and if” functions as well as arrays. This was quite fun to do, although I needed to watch a few tutorials and constantly go back to the slides to learn how to properly use these functions. 

Step 1:

I began by creating a function similar to the one provided to us in the Recitation example. I had to create a void display and include float values for “x and y” as well as for color “c”. I  would use these parameters to create my image, just as we had done in class. I began by first setting my size under void setup() and then typed in void display(int size, float x, float y, color). The three shapes I chose to use were a rectangle, ellipse and arc.  I wanted the arc to look like Pac man so I searched through the processing sheet and found that if I included PI+QUARTER_PIE instead of only PI I would get my desired shape. I had to keep adjusting the various x and y values and size to make sure my ellipse and arc were fitting nicely into the rectangle. This took quite some time and a lot of trial and error. 

Step 2:

For step 2, we were required to create a “for loop” in setup to display 100 instances of my image in different positions and colors. I had to keep referring back to the slides for this step. I did something similar to what I had worked on in class, by stating for(int = 0; i < 100; i++). I learnt what “int” was and that I had to include the number of instances I wanted this to appear by stating i <100 then i++. I was then asked to move my function to the draw() loop section. Under setup() my image replicated itself a 100 instances but stayed stagnant as Processing was only performing this task once. However, when I moved it to draw() it began to loop and replicate itself many times across the screen in different positions.

Step 3:

For step 3 I was asked to create three arrays to store x,y and color date under setup(). We were given a sample example to help us do this. Before setup() I had to define my global variables by creating “new floats” for them and determining my “numberOfInstances” which was equal to 100. In setup() I had to use a “for loop” and fill the arrays with data. I did this by defining my x [i], y[i] and c[i]. In draw() I had to use another “for loop” to display 100 instances of my image. For this I had to refer type in a for loop function and underneath it type: display(size[i],x[i],y[i],c[i]), calling on “display” which had used to draw my shape initially. 

Step 4: 

Step 4 asked us to include movement to each instance of my image by changing the content of the x and y arrays. We also had to make sure the images stayed within the canvas by using an “if” function. I made sure I included float speedX and float speedY under my global variables. I then defined these speeds using “i” under my setup(), giving them both a random speed between (-6,6). I then had to include an if function under draw() and referred to my previous recitation exercise to help define the parameters and control the movement. For the optional activity I tried to include mouseX by replacing it in the “x” figure under my “rect” shape function. This controlled the movement of the shape depending on where my mouse was placed on the screen. 

My Code:

//global variable
int numberOfInstances = 100;

int []size = new int [numberOfInstances];
float [] x = new float [numberOfInstances];
float [] y = new float [numberOfInstances];
int [] c = new int [numberOfInstances];
float [] speedX = new float [numberOfInstances];
float [] speedY = new float [numberOfInstances];

void setup() {
  size(600, 600);
  for (int i = 0; i < numberOfInstances; i++) {
    x [i]  = width;
    y [i]  = height;
    size[i] = 100;
    c [i] =color(random(255), random(255), random(255));
    speedX [i]= random(-6, 6);
    speedY [i] = random(-6, 6);
  }
}

void draw() {
  background(0);
  for (int i = 0; i < numberOfInstances; i++) {
    display(size[i], x[i], y[i], c[i]);
    x[i] = x[i]+speedX[i];
    y[i] = y[i]+speedY[i];

    if (x[i] >width ||x[i]<0) {
      speedX[i] = -speedX[i];
    }
    if (y[i]>height||y[i]<0) {
      speedY[i] = -speedY[i];
    }
      if (keyPressed) {
    if (keyCode == UP) {
      x [i]--;
    } else if (keyCode == DOWN) {
      y [i] ++;
    }
    //local variable
  }
}
}

void display(int size, float x, float y, color c) {
  fill(c);
  rect(x, y, size, size);
  fill (255);
  ellipse(x+size*0.5, y-size*-0.3, size*0.2, size*0.2);
  arc(x +40, y + 50, size*0.4, size*0.4, 0, PI+QUARTER_PI, PIE);
}

Question 1:

Under setup() my graphic replicated itself a 100 instances on my screen but did this only once as Processing was only performing this task once. However, when I moved it to draw() it began to loop and replicate itself across the screen in different positions and kept on moving, as opposed to setup() where it happened only once. 

Question 2:

Arrays help to store data in a much more clearer and efficient way in order for each element to be read individually. Instead of repeating a function a 100 times to draw multiple graphics, I could just use an array function to call this same function in a clear and simple way. An array function would easily do this in one line. I could use arrays in future projects if I want to map out data in a histogram or bar chart. I could also use this if I want it a large number of graphics to show up on my screen in different positions and colors (ie. maybe for an animation or background setting).

Final Project: Preparatory Research and Analysis – Audrey Samuel

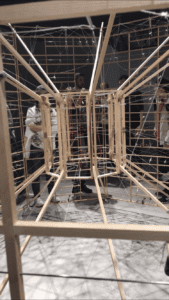
In preparation for my Final IMA Project, I decided to look into existing interactive projects such as various art installations and interactive educational exhibitions. One of the exhibitions the school took us to was the Chronus exhibition located in the M50 Art District. We were shown six various technology-based art pieces that used electronics we had used in class, such as servo motors. The Rechnender Raum sculpture by Ralf Baecker is an art installation that uses servo motors, fiber strings, rubber bands and beechwood sticks to create an illusion of the inner workings of the computer. I noticed how the servo motors would move thereby causing the fiber strings to also move and change the position of the wooden set-up in the middle. Other exhibitions I have been to have both similar and different aspects with relation to the Chronus Exhibition.

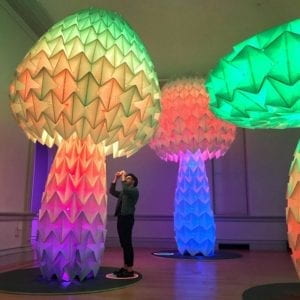
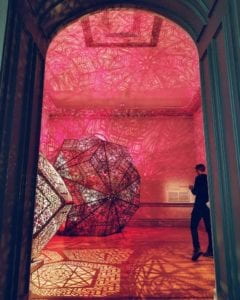
I visited the Smithsonian Renwick Art Gallery while in Washington D.C. and one of the exhibitions I came across was titled “No Spectators: The Art of Burning Man”. This exhibition used technology, lights and various installations to portray a cultural festival that takes place in Nevada. However, unlike the Chronus exhibition, the mechanics or ‘behind the scenes’ components were not clearly visible (ie. in Chronus you can visibly see the DC Motors). I liked the Smithsonian’s exhibition because it focused on human connections in an age where digital media is so prevalent in our day to day lives, by allowing us to interact in a technological space while also preserving ancient culture and tradition. Similarly, the Chronus exhibition also tries to cast a light on man’s dependence on the computer and how this can have detrimental impacts. However, it did not allow for much interaction between the user and the installation and neither did the Renwick Gallery exhibition as they were both art installations and not interactive projects.

Rechnender Raum – Ralf Baecker
Renwick Art Gallery
Renwick Art Gallery

In order to further understand interaction with relation to technology I looked at other art installations and educational exhibitions. Researchers at UC Davis created an Augmented Reality Sandbox that projects a real-time and colorful “topographic map on a sandy surface”. The project allows individuals to create their own topographic map by moving the sand with their hands to create rivers, valleys and mountain ranges. This was a successful interactive project in my opinion as it allowed participants to interact with the sand and shape it into whatever they wanted. These shapes would then be translated into a topography through the use of augmented reality and could be placed in a museum to allow individuals to learn about geography and mapping. By creating a 3D visualization of earth and science concepts, the Augmented Reality Sandbox serves its purpose as an interactive and educational project. 

Another project I came across was the Alive Art Gallery in Seoul, Korea that allows users to interact and talk to works of art. The project through various technology, was able to bring life to Da Vinci’s Mona Lisa allowing users to have a conversation with her. Although I found this somewhat interactive I did not really think it fit my definition of interaction as the audio voice-overs were pre-recorded and did not really engage the user in a proper conversation. I also personally found this to be a bit controversial as it was just putting random words in the mouths of age old paintings that have been revered all over the world, especially with specific religious paintings such as Da Vinci’s Last Supper.  

All these projects made me rethink my definition of interaction. During the group project I had defined interaction with reference to the article “Art of Interactive Design”. The author likened interactivity to a conversation and so I had defined interaction as the ways in which humans communicate with electronic objects and how these objects react to our communication, creating a two way effect. In a conversation between two people, one participant has to listen, think and then speak or respond depending on what the other participant has just said and I saw this similarly in various technological projects I had come across. For instance in the Alive Art Gallery project, there was an actual conversation occuring between the user and the technology. However, by the time I had started doing research for my midterm project, my definition of interaction had altered. After delving deeper into Arduino and doing more readings on interactivity I saw it to be not only a form of communication but also a way of blending technology and human abilities together in the most natural way without undervaluing the capabilities of humans. This can be seen in the Augmented Reality Sandbox as it allows the users to use their hands and mould the sand to form a mountain, river etc. which would then translate into a topographic projection. This encouraged the use of one’s natural abilities and skills rather than making one fully dependant on technology to do all the work.

In researching for my Final project, I found my definition of interaction changing yet again. After reading “A Brief Rant on the Future of Interaction Design” by Bret Victor, I began to think about the ways in which technology of today is fully set on only fulfilling the needs of humans. Bret Victor on his blog encourages us to think outside the box and go one step ahead in terms of how technology can be revolutionary. He encourages us to not restrict interaction to the use of a single finger on a touch screen. I really agree with this as we had to consider this during our midterm project. Did we want to give the user the power to just push a button? Or were we going to think outside of the box and encourage the user to use his or her naturally given talents and capabilities? We settled on the latter option as we felt this would allow for interaction between man and technology without undermining man’s abilities. Similarly, this can be seen in the Augmented Reality Sandbox and even the Augmented Reality in Education Project which I had come across when researching for the Group Project. 

Resources Used:

Recitation 6: Processing Animation – Audrey Samuel

During last week’s recitation, we were required to create an interactive animation using Processing. We had to make sure we included some level of interaction by using the mousePressed or keyPressed functions etc. After watching a number of videos on Daniel Shiffman’s “The Coding Train” Youtube channel I felt much more ready to use all that I had learnt in class to design my animation.

I first began by defining my terms. I included float values for my circle’s x and y values as well as float values for the speed I wanted. I also wanted to include images as my background instead of simple colors. After looking on the Processing website, I learnt that I had to use “PImage” to define my images before void setup() as well. Next, under void setup() I included the size of my canvas (640×360), my two circles as well as the yellow and blue images I wanted to include in my background . Under void draw(), I used the if function to control the movement and speed of my circle. This took a lot of work to perfect. I visited a number of tutorials and used the class slides to learn how to properly use the if function. I had to first define – if CircleX was greater than width, speed would be -3 and if CircleX was less than 0 speed would be 3 (as seen in my code below). I then used the mouseX function to switch my background colors with the movement of my mouse. If the mouse crossed the white line, the background would change color. I found this to be a really useful function that I could use in the future. I then drew my ellipse and made sure I included speed. Finally, I included a line of code to change the color of the circle if a key was pressed. I was also able to increase the speed of the circle when a key was pressed. Overall this exercise was quite difficult and took a lot of trial and error before I perfected the circle’s movement etc. However, it was fun in the end and I enjoyed making my first animation.

float circleX = 0;
float circleY = 0;
float speedX = 3;
float speedY = 3;
PImage img;
PImage imgtwo;

void setup() {
size(640, 360);
img = loadImage("brown.jpg");
imgtwo = loadImage("green.jpg");
circleX = 200;
circleY = 100;
}

void draw() {
background(img);
if (circleX> width) {
speedX = -3;
}
if (circleX<0) {
speedX = 3;
}
if (circleY>height) {
speedY = -3;
}
if (circleY<0) {
speedY = 3;
}
//switching background colors with mouse click
if (mouseX >320) {
background(imgtwo);
}
//dividing the board in half
stroke(255);
line(320, 0, 320, height);
//Me Drawing my moving circle
fill(255, 191, 0);
strokeWeight(4);
stroke(225);
rectMode(CENTER);
ellipse(circleX, circleY, 100, 100);
circleX += speedX;
circleY += speedY;
//changing color of circle if key pressed
if (keyPressed) {
fill(255, 69, 0);
ellipse(circleX, circleY, 100, 100); 
//increase speed of circle with key pressed
circleX += speedX;
circleY += speedY;
}
}

VideoOfAnimation

Additional Recitation Homework:

Step 1:

For the additional recitation homework, we were required to sketch a circle at the center of our canvas. We had to make sure our canvas size was 600 x 600. 

Step 2:

Next we were required to modify the circle so that it expanded and contracted periodically. This was quite hard as I had no clue how to go about it at first. I looked over the slides and the Processing website and figured out that I had to use the “boolean” function here with an “if else” statement to define my parameters. I therefore began by defining my x and y sizes (both being 300) and “boolean CircleIsShrinking = false” before void setup(). I then included the size of my canvas under void setup and proceeded to include a background color of white (255), fill(255) for my circle and a stroke weight of 10 to deepen the border of my circle. I then drew in my circle including both the x and y values I had defined earlier and the radius as my ‘height and width’. Next I had to include a series of “if else” statements to increase the radius ++ or decrease the radius — thereby allowing it to expand and contract. As part of the boolean function, I learnt I had to define the maximum and minimum parameters of my radius splitting them with ||. I also learnt that including an exclamation mark before my boolean statement made it true. 

Step 3:

I then had to modify the sketch so that the outline changed color, by setting the colorMode() to HSB. This was quite a tedious task and I had to ask one of the learning assistants for help. I learnt that because I wanted the color to change randomly I had to define it on top using “float Color”. I then had to include colorMode(HSB) in void setup(). Under void draw() I included stroke (Color, 255, 255) and an If function which stated that if Color was greater than or equal to 255 (the maximum value for a color) then Color would equal to 0. If not – “else”, then Color would increase (Color++). This function made sure that the Color would keep changing from 0 until it reached 255 and when it reached 255 would set Color back to 0, creating a loop. 

Step 4:

Lastly, we were required to change the movement of the circle based on my keyboard’s arrow key input. I learnt here that I had to use the keyPressed function, and include keyCode = UP and keyCode = DOWN. I also had to include an if statement when using this code in order to modify the movement of x and y depending on which key was pressed. Overall, some of the useful functions I learnt during this recitation were mouseX, Boolean, keyPressed, keyCode, strokeWeight and PImage for background. 

Recitation 5: Processing Basics – Audrey Samuel

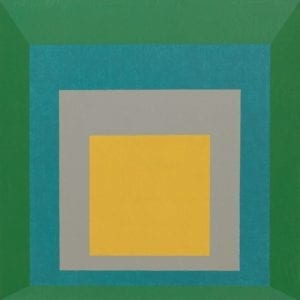
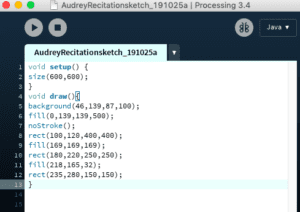
During this week’s recitation we were tasked with using the Processing software to draw an image based on a painting, art work etc. that we liked. We were provided with a few sites to choose our images from and one of these sites was The Bauhaus School of Arts. I scrolled through and picked the painting by Josef Albers called Homage to the Square: Apparition. Josef Albers was a German professor who left Germany to the United States in 1933 to teach at Yale University and in few other art schools. Albers’ art focused on geometrically based abstraction as can be seen in the Homage to the Square: Apparition which was painted in 1959.

It belongs to the series: Homage to the Square which Albers began in 1950 and spent 25 years completing. What is unique about his geometrical styled art is that he creates optical effects and gives texture to the squares he paints thereby creating an “illusion of receding and advancing planes” as noted in Guggenheim’s website. This can be seen in the painting I chose (find below) whereby the viewer of the painting is confused by the illusion of whether the squares move from inwards to outwards or vice versa. This allows everyone to enjoy Albers’ art in their own way and allows people to appreciate even the most basic shapes such as a square. 

Josef Albers – Homage to the Square: Apparition 1959

Using Processing

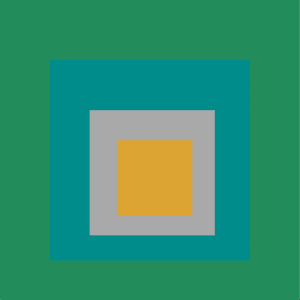
I decided I would attempt to recreate this painting using Processing. I made sure my canvas size was 600 x 600 pixels and began working on recreating the painting. I had trouble at first using Processing on my laptop due to software issues so I used another laptop. I was provided with a cheat sheet on Programming which was very helpful. I got a tip from one of the learning assistants to start outwards and work my way inwards. I had started the other way round by drawing the yellow rectangle first and so when I tried drawing the gray rectangle it completely covered the yellow one. I then started my drawing from scratch with the background color, by trying to match it to the shade of green Albers uses in his painting using fill(). I searched online for an RGB Color Code Chart and found a shade close to the green in his painting which I then typed in. 

I then started working on the turquoise colored square. I had to type in the fill code first before I started drawing the square and so I searched up a similar color I could use. I made sure I included noStroke() in order to make my squares appear with no borders similar to the squares in Albers’ painting. To draw my square I used the rect() function. I found it easier to sketch my squares on the graph sheet provided because it was quite hard to determine the position of the squares without mapping it out properly. I learnt that the first two values determined the position of the square with relation to the x and y axis and the other two values determined the height and width of the square I was drawing. By finally mapping out these four values using the rect() function onto the graph I was able to roughly estimate where I wanted my squares to be and began typing in the code. I went back and forth adjusting the position until I finally found the perfect values I wanted. I continued to do these for the gray and yellow squares until I was able to find the right sizes, positions and colors that matched Albers’ painting. 

My rendition of Albers’ Painting

Experimenting with different code

However, I wanted to go further and include texture into my drawing without giving it solid colors, so that I could make it look as close to Albers’ painting as possible and give it that same ‘illusion look’ he is able to give in his painting. I went onto the Processing website and searched for the texture function. I was asked to insert an image that I would want to use. I then typed in the code but I could not finish adding an image and including it into my painting. I also tried my hands on the Simple Linear Gradient code provided in Processing to adjust the gradients of the colors in my painting. After defining my colors and uploading the code I changed the entire shape of the painting by mistake and so had to work on rewriting the code. 

Resources:

Homage to the Square: Apparition