CPD | Dear Data: Songs Stuck In My Head | Ashley Friedland

For this week’s project, I mapped out the songs that got stuck in my head. 

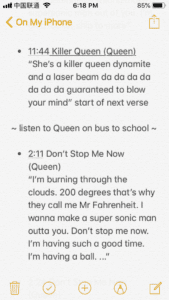
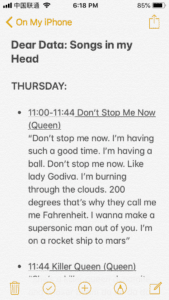
I kept a list on my phone’s Note app. I noted the time, the song, the artist, and sometimes the repeated phrases. I realized through this project that when I have a song stuck in my head, I don’t sing the entire song, I sing a section (usually the chorus). Sometimes I would have the chorus running in my head over and over for about an hour. 

Some of my notes:
For my visualization, I made circles for each song. The size corresponds to how many times it entered my head. I accidentally made my circle for 2 times just as big as the circle for 5 times. Each song is color-coded and has an arrow going to the next song that popped up. The starting line has the day of the week. There are also time stamps. There is a little headphone icon that is placed in certain areas, noting that I listened to music in between the songs stuck in my head. For example, I had “Don’t Stop Me Now” stuck in my head, then I got on the bus, listened to music, got to school, stopped my music, then “Killer Queen” was stuck in my head. 

Map

One issue I ran into was whenever I went to log my song, I would see the ones I’ve logged before, then start singing them. I would then try to do an activity that would get it out of my head to get back to an “organic” manifestation of a song getting stuck in my head. I also noticed that sometimes my lyrics weren’t right, so it forced me to really think about that. In one instance, I was meshing two songs together so that was something interesting to note.

CPD | Week 1 Readings + Project Ideas | Ashley Friedland

THE AINU: BEYOND THE POLITICS OF CULTURAL COEXISTENCE:

This was a good introductory article to some of the main political background of the Ainu. I couldn’t help but think about how similar or different this story is from the Okinawans’ story. The article mentioned them once when talking about ethnic minorities, but their story goes deeper than that, just like the Ainus’. This is an article that forces the conversation of intangible heritage in the reader’s face. Definitions are hard to pin down and what may have been once solid lines are now blurred (or at least questioned). This article made me understand why the Ainu group we will be working with clearly stated that they don’t want to cute or be associated with a primitive viewpoint.

WCS INFORMATIONAL SHEETS:

These sheets convey WCS’s dedication not only to the wildlife they are saving but to the communities they are serving. It gives good introductory information about the extensive variety of programs WCS has to offer, plus a little call to action at the end, making the reader want to join in their cause. I expect that this is what WCS will want from a project in this class: information, then a call to action / audience participation. I think that’s something special they can continue to use. 

A FOUR-CENTURY RETROSPECTIVE OF MARINE FAUNA AND FISHERIES AROUND NEW YORK CITY (2012): 

This piece is much more in-depth than the previous two articles. That’s partly because it’s covering 400 years worth of information and history. It’s a very thorough look into the fisheries and marine life around New York City, even taking into account the human population growth and how that may be influencing the fish population.  With so much data, they were able to look at trends that occurred, are occurring, and possibly will occur. I appreciated the graphs and charts in their sources sections. I like visuals, so those helped me with the stats a bit better. Because of the amount of data in this one paper, several projects could come out of this.

Project Ideas:

When reading the WCS info sheets and the Fisheries paper, I started getting ideas similar to the MARCOS map. I really enjoy interactive maps and this one has such a wealth of information, it’s kind of overwhelming. The WCS sheets made me think of a live map of all the sharks in the area, so kids could learn about a particular kind of shark, maybe even one shark in particular, and then track its movements in the water. Of course, this only works if WCS has trackers on the specific sharks (or other marine life). I’m wondering if there could be some sort of trivia game made for some of this information. A small picture could be on the screen with a few facts about it, then the user would have to guess where in the local waters it most likely could be found. Maybe something about fish (or other marine life) migrational pattern(s) and the user could guess time lengths for each area or what outside influencer would be the biggest hindrance to that migration.