Date: 03/06/2019
Links: Full screen: https://editor.p5js.org/jz1111/present/n2Ed68jPW
Codes: https://editor.p5js.org/jz1111/sketches/n2Ed68jPW
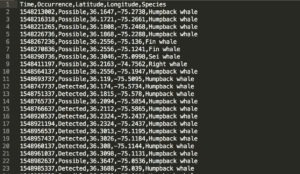
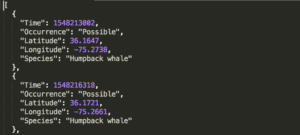
I first manually processed the data collected from a robot about baleen whale acoustics from “Autonomous Real-time Marine Mammal Detections” website. The part of data I used is the location, time, species of whale and certainty of the detected sounds. I used Python to clean up the file and used an online converter to convert the csv file to json file. It was hard to decide on the organization of different categories. Since I chose to map the data according to the time of detection and due to my limited file manipulation skill, I organized the data with non-nested objects and put the objects in an increasing order of time.
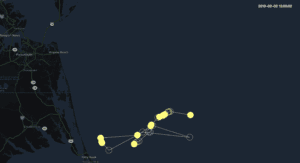
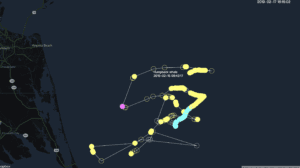
Then I made the digital map based on Leon’s example. The duration is from January 23rd, 2019 to March 3rd, 2019. There is a clock on the upper right corner telling the time. The solid circles stand for certainly detected whales and the hollow ones are possibly detected whales. Yellow stands for humpback whale, magenta for right whale, cyan for fin whale and green for sei whale. The lines show the route of the robot during this period of time. Each circle and line appear once the clock passes the time of the detection of each whale. The animation repeats after all the data are drawn on the map. I also added an interaction. When the mouse hovers on each circle, the species and detected time will be displayed.