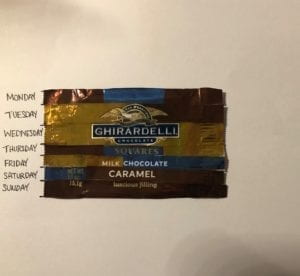
For this assignment, I chose to create a data visualization of the amount of chocolate I ate last week. Instead of drawing it out, I collected the wrappers of the chocolate I ate and put them together. Since the chocolate I had were all from the same bag and had the same wrapper design, I cut them into pieces and put them together to make one wrapper. I cut each wrapper into seven, horizontal strips to represent the seven days I observed starting from Monday to Sunday. Each strip would them be split into however many sections that represented the number of chocolate I ate and the sections would be from those wrappers. Then I taped all the sections together to put them together as one wrapper. Representing the data this way, I can see what kind of chocolate I ate the most in that week at a glance.
