Final Project
Sound Wave Visualization
Freddie
Instructor: Rudi
My ideas and the concepts of the project
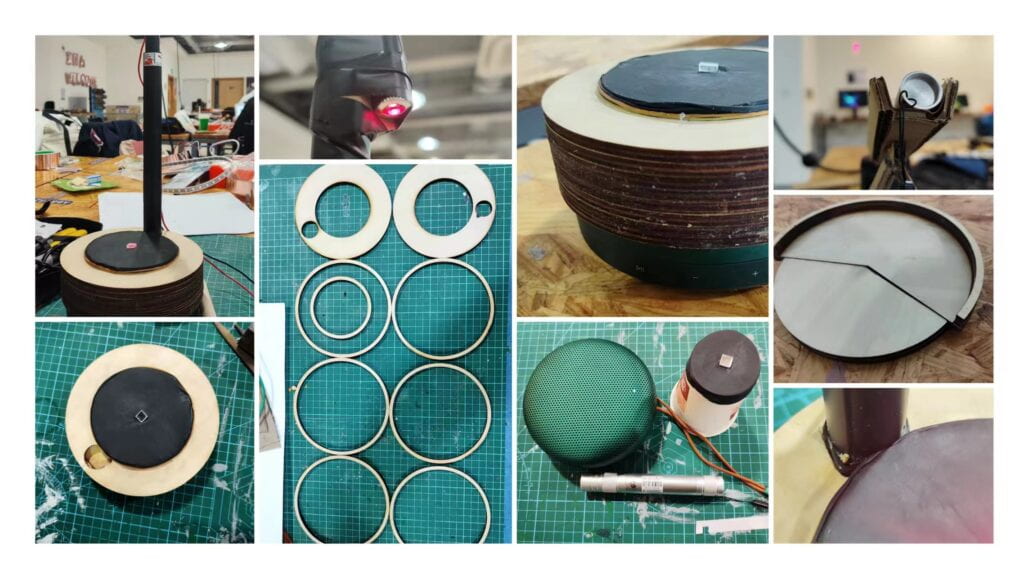
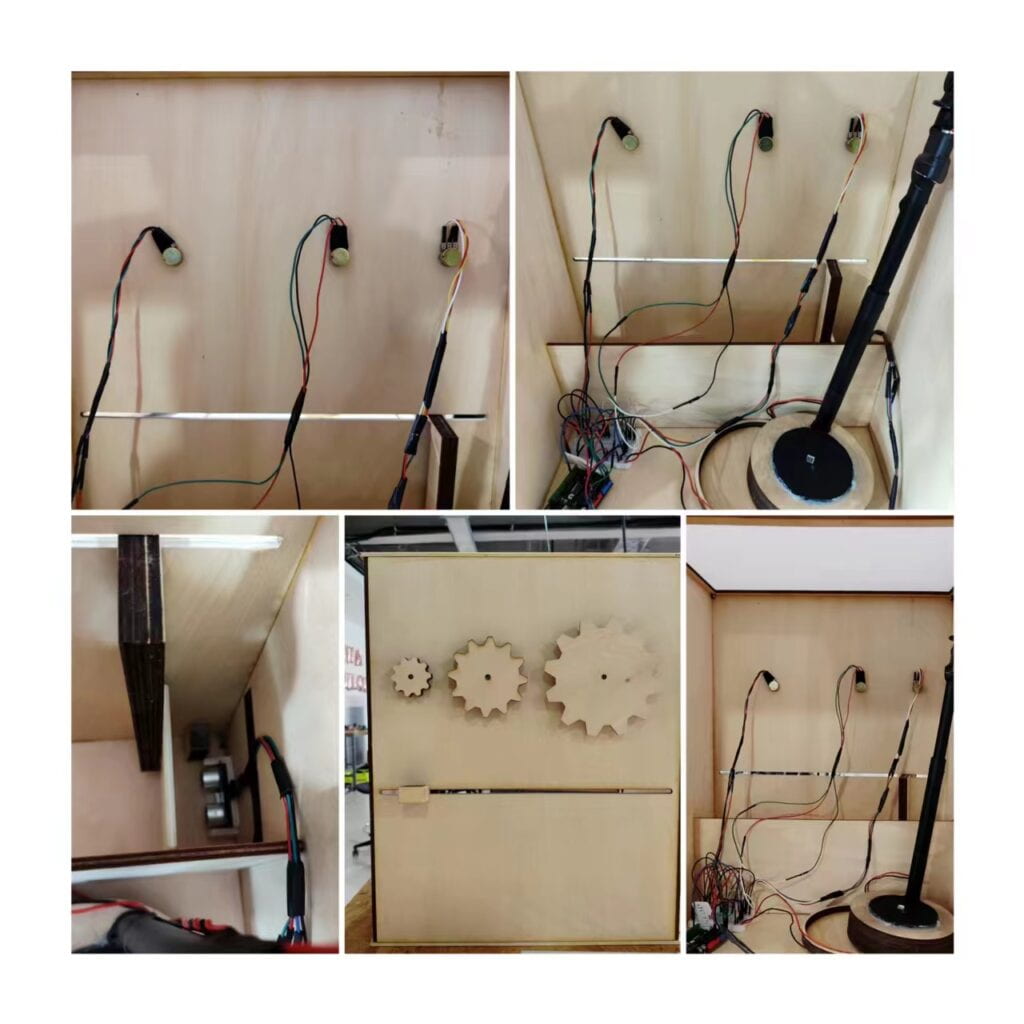
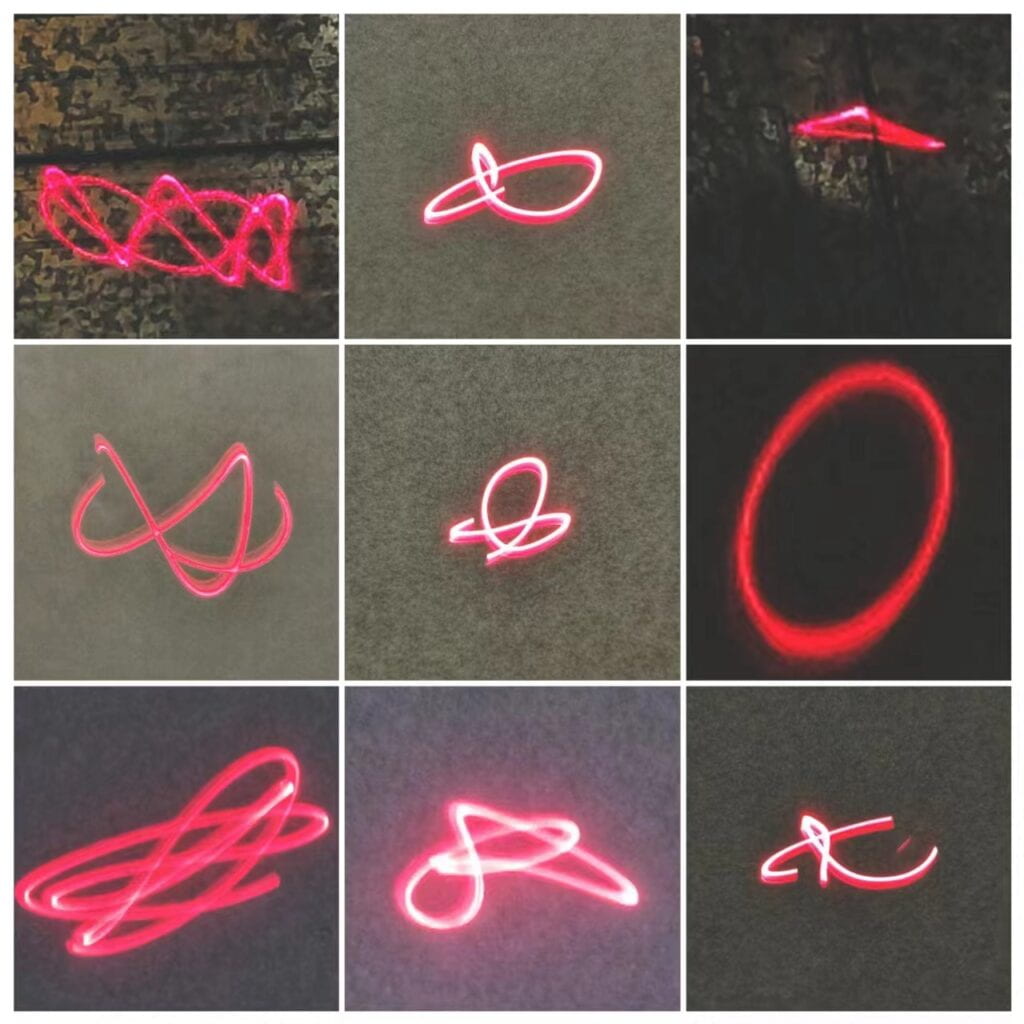
I was first inspired by a Youtube video called Mirror + Laser + Sound. https://www.youtube.com/watch?v=C-V1uXeyGmg It is my first preparatory research project. The main idea of this project is to visualize the vibration of sound. Simply put, it combines the vibration of sound with the mirror, then the laser reflects on the mirror so that the vibration is expanded, finally you can see some cool figures and animation displaying on a surface. I mainly used three sine waves, each with a different range of frequency, combining them together and make cool figures moving on a surface. I designed the main equipment based on the structure in the video and made modifications. It is composed by a B&O loudspeaker, a wooden container made by laser cutting, a stretched balloon, a little mirror and a laser. This physical part is recognized by users and many professors. The figures works really well so once it is completed before the user test, I never changed it. This is only the physical part so far. The way how I add the interactive part is by changing different frequencies and amplitude of the sound waves I used. I respectively used potentiometers and an ultrasonic ranger in Arduino to change values and sent the values to processing and change the variables I wanted. The reason why I used these two types of equipment is because they both gives users continual change of values when they’re controlling the project and try to change something. For example, the continual change of frequencies can change the sound of the waves continually, thus, the visualization can display continual change as well. Same thing works for ultrasonic, when your hand waves above the sensor, the volume of sound waves change according to it, reflecting on the visualization, the size of that figure differs over time. For the user test part, I only worked out the three potentiometers, so at that time, users can play with them, change the whole sound into some certain chords or a certain group of waves which creates beautiful or interesting figures. I thing a user mentioned is that she said these continual figures actually attracted her to watch it for a very long time. “I can watch it all day”, she said. But people also criticized about the potentiometer itself. They think it is too obvious of the audience to know what they’re exactly doing, maybe some cover or decoration is needed. Also, our learning assistant Sylvia mentioned that the project is poorly displayed because the part where people moves these potentiometers is away from the A3 paper surface where people can see the figure moving all the time and it should be positioned at a certain height to make it convenient for everybody to look at it. Her words made me think of putting all the potentiometers on one side of the big box. The box can be semi-opened so that people can not only interact with buttons on the wall but also see the structure and base of the project. It is also more convenient for me to explain the physical mechanism behind. So instead of just building a platform, I covered three sides of the box structure and made different holes for the potentiometer and the ultrasonic ranger to work. Also a user mentioned the potentiometer is a bit hard to use, maybe making it bigger. So instead of turning that little stick, I designed different sizes of gears and stick those gears on top so the users can turn gears instead of the little sticks, making the interaction easier. The gears are welcomed in the present class. The codes I used is really a big challenge. First I tried downloading different waves from Google. After I talked to professor Rudi and Professor Andy, they found me a sound library in Processing that produce different basic waves and encourage me to try combine things together. Professor Andy also found a website that explain how sound wave changes, combines and makes different effects. It is primarily determined by three variables: frequencies, amplitude and panning. As I mentioned before, I only focused on amplitude and frequencies. So far I still have little idea about panning. The variable do change when I used “mouseX” in processing but it is either too hard to detect or inconspicuous on the paper. During the user test, I did let user to change by using the mouse on PC, but the overall interaction experience is badly divided so I gave up on that idea immediately. Instead, I added another ultrasonic hoping it can change the user experience, but the value I defined for the panning failed to work due to the sound library error saying panning has to be in an interval of value [-1, 1]. I failed to solve this error eventually so the final version is without the existence of panning.
My work and production process
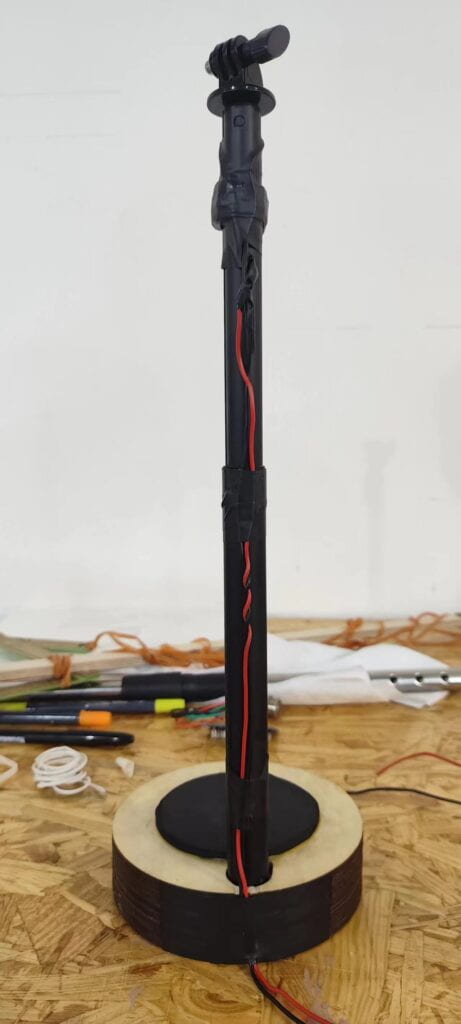
My work are divided into three parts. The first part is about producing the physical mechanism of this project. As is mentioned above, I built a device that realized the visualization. This device consists of a loudspeaker, a container with a hole on top, a small mirror fragment, a stretched surface made of a balloon, a black stick and a laser. The basic mechanism is the container will contain the vibration of sound waves played by the speaker. The balloon surface on the top center of the container will also vibrates with the waves The mirror fragment in the center of the balloon surface will vibrates as well. When the mirror vibrates, a laser displaying a piece of light on it can be reflected on a surface. Also, the laser will expand the vibration effect, thus producing figures far bigger than the actual vibration scale. One essential problem to solve is where should the display screen be put. Initially, I decided to make a slope about 45 degrees and make an individual screen that stands on the table, but the light would reach too much height so a large screen is needed, which consumes material, hard to make and take too much space. When I tried to reduce the slope, the reflection on the mirror is poorly displayed so it didn’t work either. Professor Rudi gave me this inspiration, he made the laser lighten straight towards the mirror above it and made the light reflect back on top of the ceiling first. Then, he gave me a black stick to put to laser in its right position. I sticked the laser on top of the stick and let the light be in the center of the mirror fragment. The will now users see the figures on top of the box.
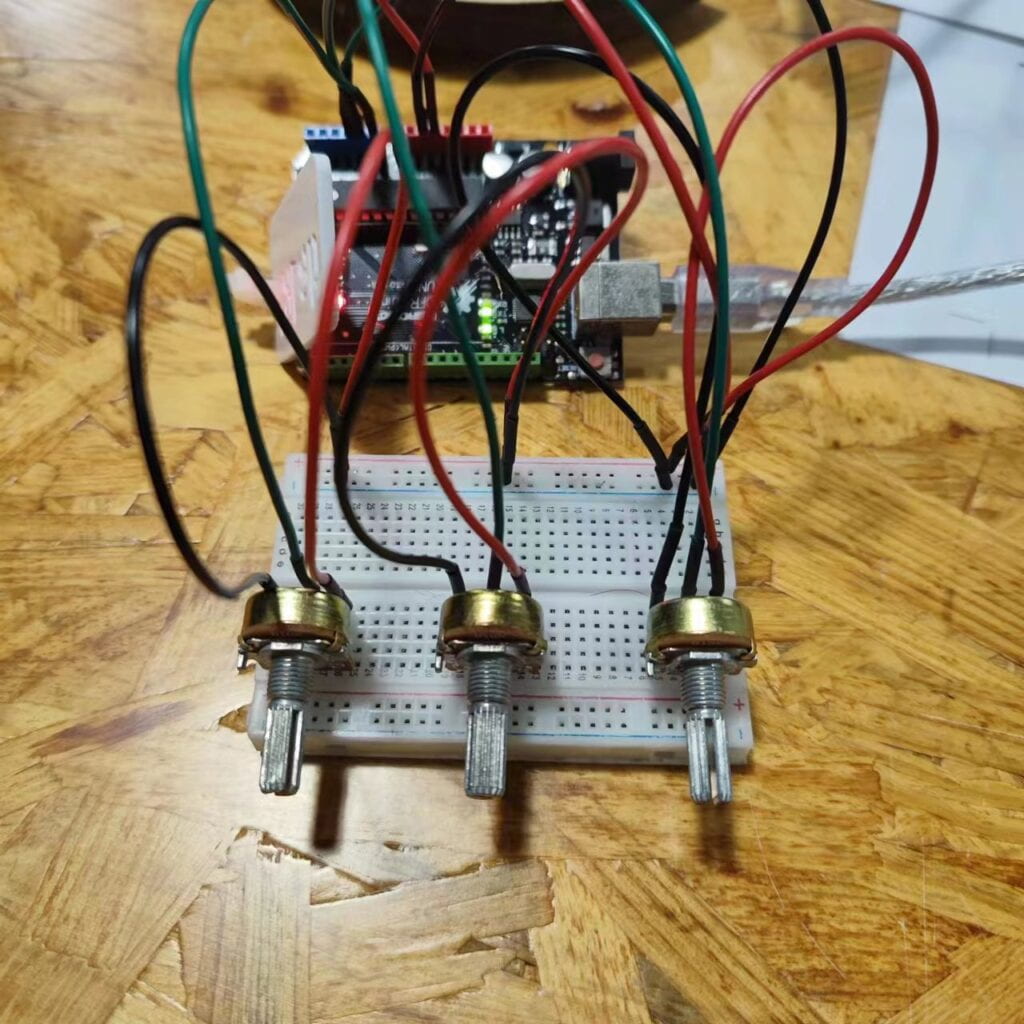
The second part is about choosing what sensors or equipment to realize the interaction. My initial ideas was to built many pressing buttons to trigger different single sounds and effects. By combining them users can make cool figures. But when I talked to professor Rudi about it, he wasn’t impressed. I think it is the lack of interaction in this process. So I started looking for equipments that gives continual feedback. The potentiometer is the first equipment I can think of. By spinning the stick, users can give continual change to values defined in processing. Also by using three of them, the group of changing frequencies made various figures on the screen. After the user test, many colleagues told me that they want more changes to the figures. Professor Andy also said the sound of these waves reminded him of Taiji, so he suggested I use the ultrasonic ranger to try something with distance. After connecting the sensor to the circuit and tried, it worked surprisingly smoothly as the continual change of distance changed the size of figure over time. So far I’ve done with the choice of equipment. The codes in both Arduino and Processing weren’t difficult. In Arduino, I made 4 serial values send: three of them are the values of potentiometers, the other is the ultrasonic sensor. In Precessing, I simply play three sine waves, every one of them with different ranges of frequencies and the same change of amplitude, due to the failure of making full use of panning, I still used a “mouseX” in my coding.
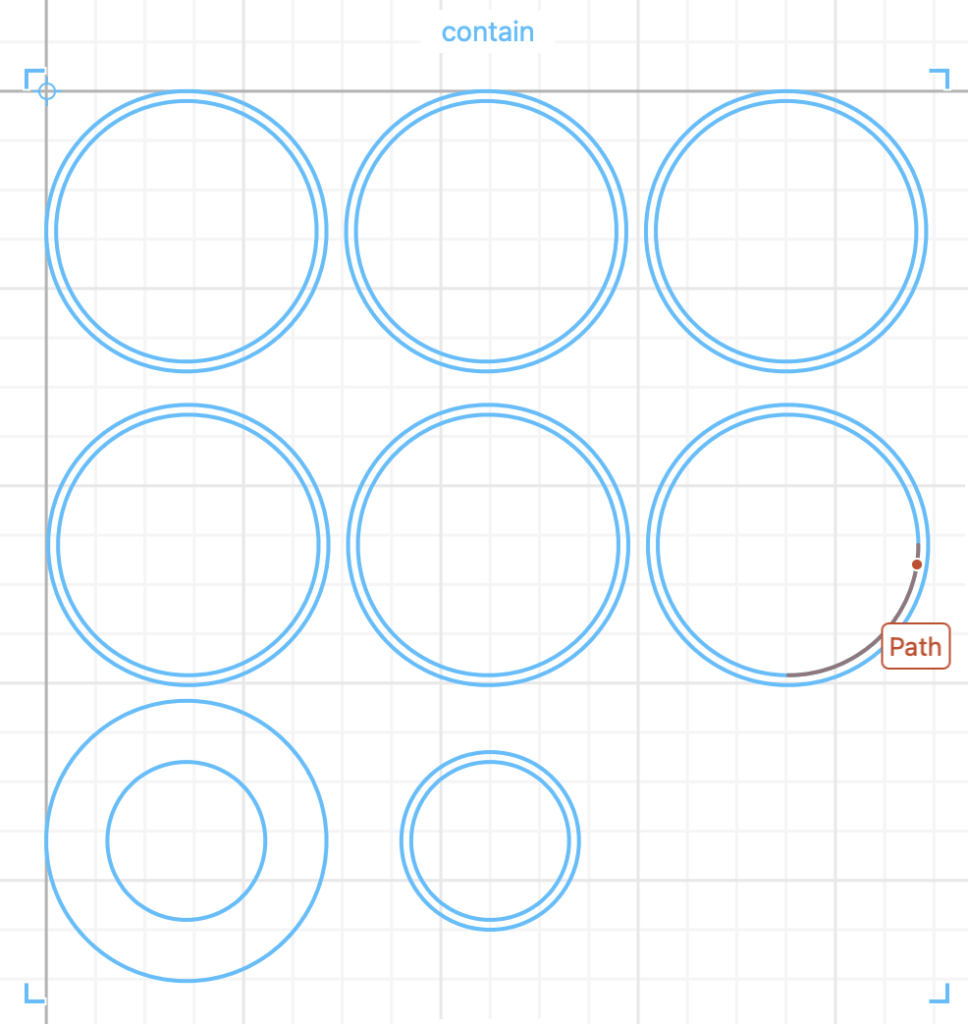
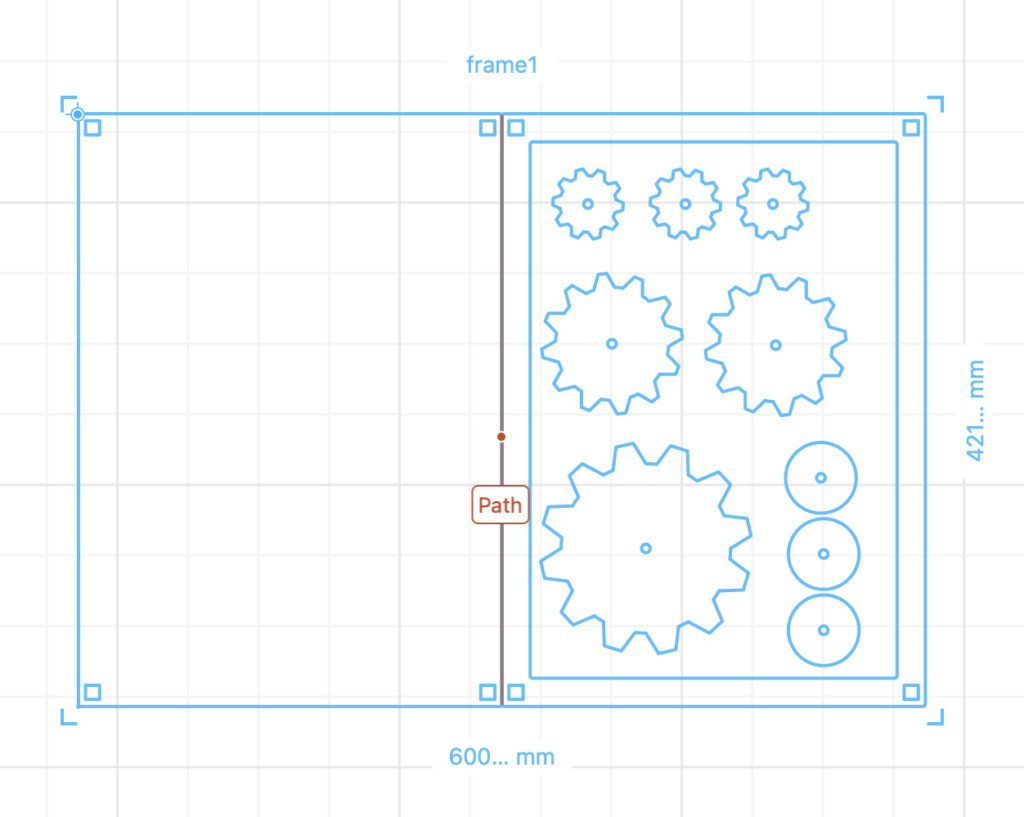
The third part is how to display those equipments that triggered all the interaction. For the three potentiometers, I listened to a user’s advice during the user test. She said that making these buttons bigger definitely helps users feel convenient to use. So associating with the feature of potentiometer– turning, I thought of gears. So I drew my design in Cuttle. Each frequency has a certain size of gear. I also made three little holes on the front side of my box and stuck three potentiometers in them. For the ultrasonic ranger, I really suffered thinking of physical structure to make it convenient to use. Initially I think of building a small railway inside the box and use a handle to push and pull an obstacle on the railway. The ultrasonic ranger is sticked on one side so when the obstacle is moving, the distance between the sensor and the obstacle changes, thus changing the figure. But by doing this means that an obstacle must be outside the box when it has to be pulled out, it isn’t useful and it takes extra space which isn’t beautiful. My solution is to cut a “railway on the front side of the box and put a handle with an obstacle inside the “railway”. The handle can be moved left and right to change the distance. By doing this, the only part that comes out is the handle, which makes the project more beautiful.
My conclusion and reflection
My initial goal of the project is to successfully make the device that display the visualization of three sound waves and create functions that change the value in the waves to realize the interaction experience. I think my project reached most of my goals. During the present class, many of may colleagues made good comments on the interesting animating figures I’ve made by visualizing waves of sound and they’re surprised at the physical mechanism behind. They are willing to watch the figures changing and try to create some certain patterns they like. I’ve seen amazing figures that I can’t even make by myself. But there are drawbacks as well. A few of our learning assistants consider the way how this project is presented incomplete. They think this isn’t the perfect way to make people playing around and watch those figures moving so I still need to consider on the comfort of user experience. Also something I’ve been keeping asking myself, my professors as well, is what exactly is this project for? What exactly is people watching and what’s the point of watching this? I consider my project do include interaction because I’ve been emphasizing I want continual change between the user and the project and I did made it with continual feedbacks that wouldn’t stop users from playing with it. Another simple reason is the sound wave visualization is really a cool thing to build and I’m definitely sure anybody who happens to play with it would get a deep impression by the figures. But this isn’t satisfying. When people are playing around I notice something. They all try to find the coolest figure they like or some figures that haven’t been discovered previously. Compared to normal figures with lots of complex chaos. The figures people found interesting is always something simpler but unique. It might be two circles taking turns moving, it might be a figure of a fat star, it might be even one stretching circle. It might be anything we found different, anything we are able to describe compared to other figures of chaos. So it seems a little meaning of doing all this is trying to find orders in chaos. Likewise, that’s how the world is developed, our society is developed. From a planet with a mess to an advanced, modernized world. After all, my current ability doesn’t allow me to figure out the exact physical logic behind the sound wave and the regulations of its vibration. The only thing I do is to bring out these regulations in a way that everybody can feel. And that I think is the further meaning of my project. If I had more time, I think I would focus on decorating my project more instead of thinking I could do more things about it. Throughout the final project, I’ve been trying new things and never stop, so my plan of the project isn’t clear at all, it is about adding more and more functions or making the project bigger and bigger. Professor Rudi and professor Andy pointed out this bad decision to always try more and suggested I stop, reflect and make good decorations. As a result, I can only decorate the whole project after my presentation and I consider myself a lack of arrangement of time. Anyway, one day after the present, I re-designed the whole box and made it a steampunk style. But unfortunately that was one day after the final presentation. I did learn a lesson that my efforts can’t always match with my ambition so a practical plan is always needed.
My other documentations and codes
This is my code for Arduino:
import processing.sound.*;
import processing.serial.*;
import osteele.processing.SerialRecord.*;

SinOsc sine1;
SinOsc sine2;
SinOsc sine3;

Serial serialPort;
SerialRecord serialRecord;


void setup() {
  size(1024, 256);
  background(255);

  sine1 = new SinOsc(this);
  sine2 = new SinOsc(this);
  sine3 = new SinOsc(this);

  String serialPortName = SerialUtils.findArduinoPort();
  serialPort = new Serial(this, serialPortName, 9600);
  serialRecord = new SerialRecord(this, serialPort, 3);
  serialRecord.logToConsole(false);
  serialRecord.logToCanvas(false);
}

void draw() {
  serialRecord.read();

  int freq1 = 100 + serialRecord.values[0]/8;
  int freq2 = 150 + serialRecord.values[1]/8;
  int freq3 = 200 + serialRecord.values[2]/8;


  sine1.play();
  sine2.play();
  sine3.play();

  float amplitude1 = map(ampli, 125, 0, 1, 0);
  sine1.amp(amplitude1);
  float frequency1 = freq1;
  sine1.freq(frequency1);
  float panning1 = map(mouseY, -0.2, 0.2, -1, 1);
  sine1.pan(panning1);

  float amplitude2 = map(ampli, 125, 0, 1, 0);
  sine2.amp(amplitude2);
  float frequency2 = freq2;
  sine2.freq(frequency2);
  float panning2 = map(mouseY, -0.2, 0.2, -1, 1);
  sine2.pan(panning2);

  float amplitude3 = map(ampli, 125, 0, 1, 0);
  sine3.amp(amplitude3);
  float frequency3 = freq3;
  sine3.freq(frequency3);
  float panning3 = map(mouseY, -0.2, 0.2, -1, 1);
  sine3.pan(panning3);
    }
