Recitation 7: Neopixel Music Visualization
Freddie
Task 1:
Since all the FastLED, Sound, Serial Record library in both Arduino and Processing were being installed in advance, I quickly assembled the circuit and done.
Task 2:
Step 1:
As is mentioned above, the SerialRecord Library was installed in advance.
Step 2:
I downloaded the code from the Github website where professor Rudi published the Arduino code for testing the NeoPixel. Then I uploaded the code to the Arduino, opened the Serial Monitor and typed in”0,255,0,0″ and pressed enter to test the first NeoPixel, it showed a red light. Then I respectively typed in”1,0,255,0″ and”2,0,0,255″ to test the second and third NeoPixel.Here is the video:
Step 3:
I downloaded the code from the same website in Step 2 and use Processing to open it. When I ran the code, there came some problem: My laptop is one that has a M2 chip in it. And I previously downloaded the Apple Silicon version of Processing instead of the M1/M2 version. So I find the website of Processing and download the M1/M2 version and re-ran the code again. In the meantime, I turned the Arduino code on and closed the serial monitor. This time, it worked. I pressed on the touching board and swept left and right, the screen showed random color of sixty rectangles in one linear. And at the same time, the NeoPixel would turn on and change color according to the random color showed on the screen. How amazing! This is the first time the Arduino and Processing were combined and completed fascinating tasks.
Task 3:
Step 1:
I opened the sketch by Github. The original sketch had a green background and a purple ball which could expand or shrink according to the volume of the song. The origin song was asked to be replaced so I chose “Feel Good Inc.”, a single by a virtual band called Gorillaz as the music I wanted to add to the sketch. Then I ran the sketch and it worked like this:
Step 2:
I didn’t want the origin animation so I’m thinking of creating something different. I first got my idea from the lecture class 18 when I created some stretching rectangles that indicated the volume of the music.
But this was upside-down because I wanted the rectangles to stretch from the bottom to the top. So instead of using “rect();”, I used the “quad();”. Also, instead of using the variable “diameter”, I replaced it with the variable “height – diameter”. That allowed the rectangles to go up but not to go down. I also made gradual change on the color filled in each rectangle, which was from green to blue. These effects looked like this:
Next, I wanted to add the NeoPixel that also responded to the music. Basically, I wanted to change the brightness of the NeoPixel according to the volume of the song. In the RGB color, there are three digits controlling red, green and blue respectively. The range of the numbers is from 0 to 255. So it is obvious that if the value of the number becomes bigger, the color will become brighter, which indicates that if I wanted to change brightness in the NeoPixel, all I had to do is to set the variable in on of the three colors and made it change according to the volume.
Professor Rudi helped me a lot on how to combine the screen code with the combined code with Arduino. Instead of merely carrying the code responsible for the Arduino NeoPixel and hold the Arduino code still, Professor Rudi changed the code in the Arduino and make the NeoPixel respond to the Processing code faster and smoother. The effects look like this:
Step 3:
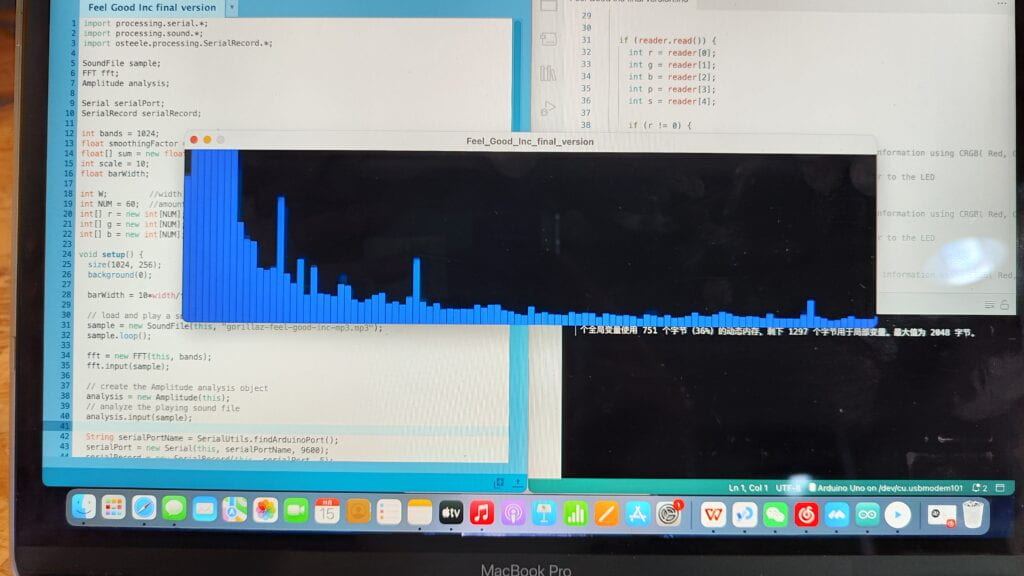
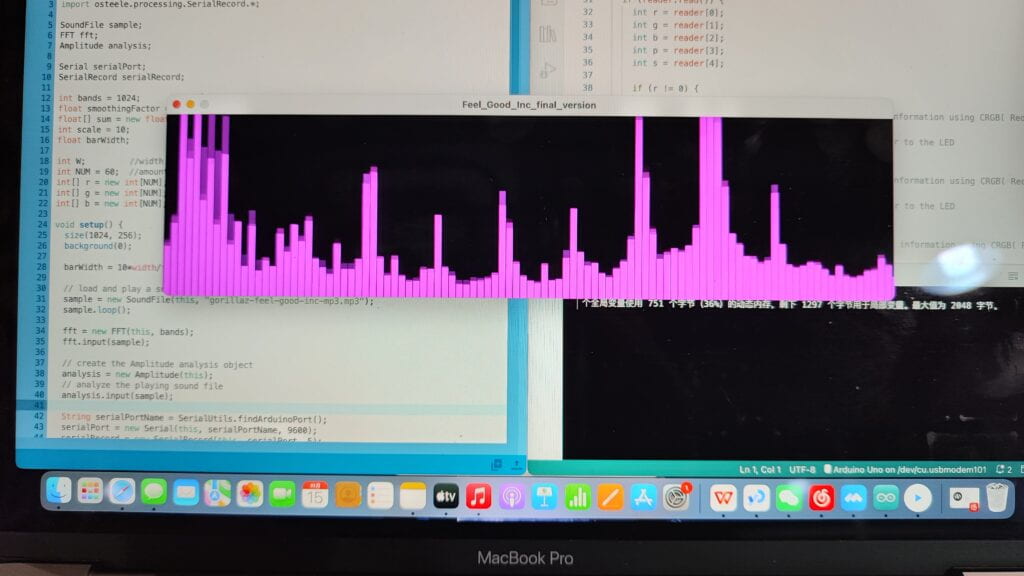
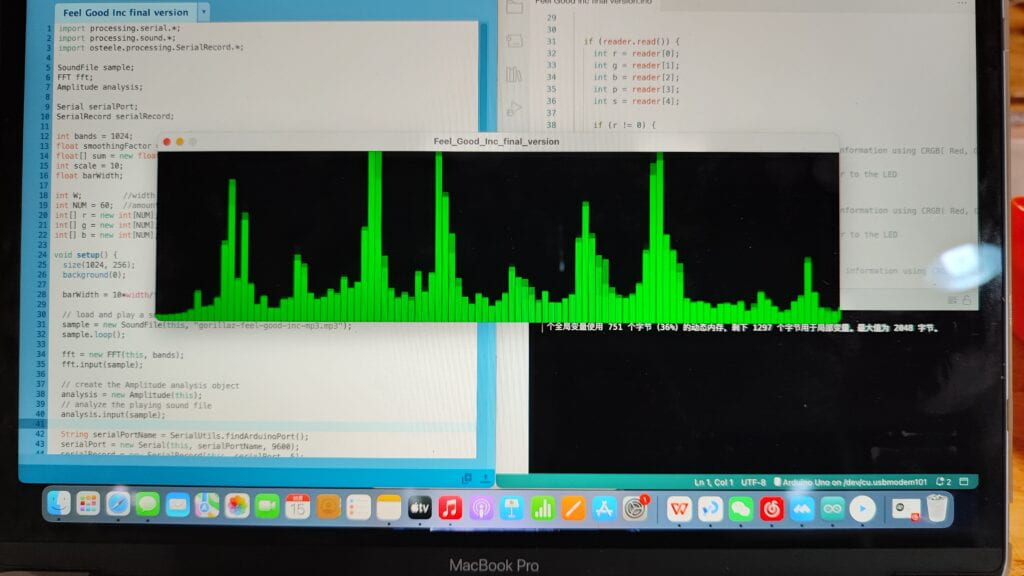
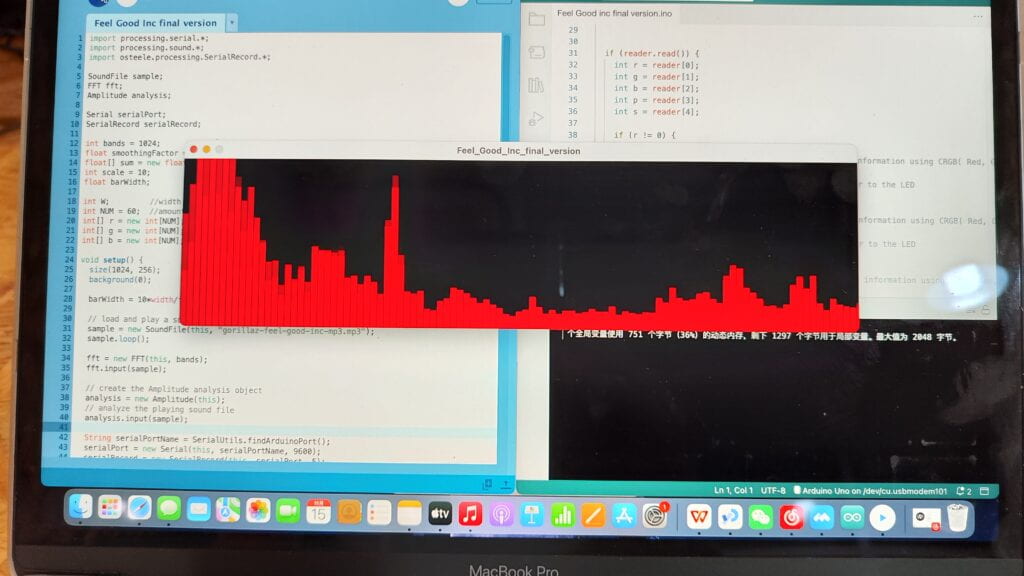
I used millis() in Processing to change color of the moving rectangles based on the different part of the song. I used pure blue for intro, purple for verse, pure green for chorus 1, pure red for rap part, sky-blue for Bridge and chorus 2 and pure blue for ending. I precisely calculated the exact second of the beginning of each part and use if {} , else if {} and else {} statement to connect each part together. The effects look like these:
Task 4:
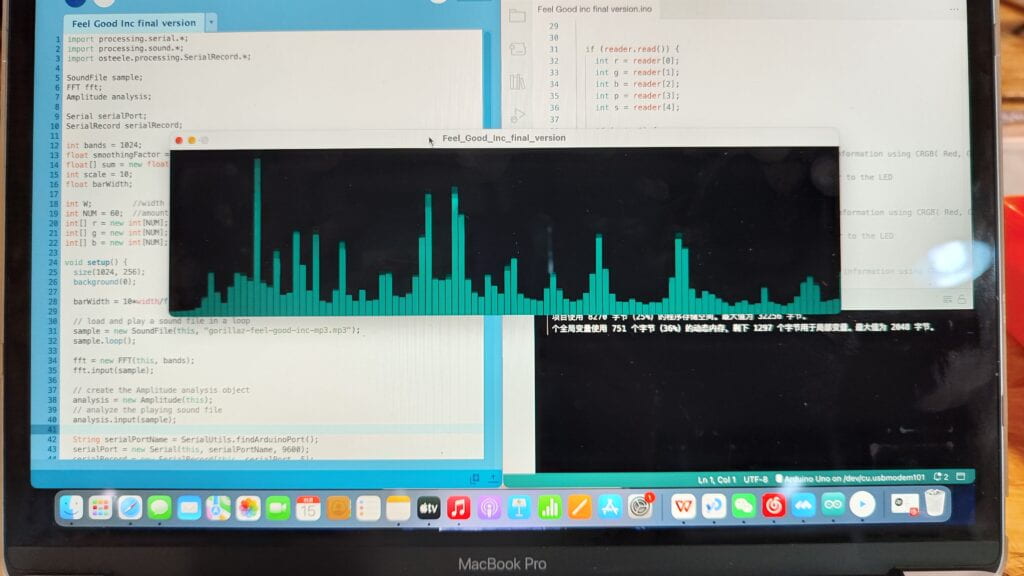
Professor Rudi taught me how to combine the serial.record with the different sound keys of the music together. And in order to make these rectangles look more smooth and comfortable, I define barWidth that can divide the width into more small pieces of widths and make the moving rectangle look better. I also add more color to the NeoPixel which change according to the millis () and if/else statement. To complete this, I added more reader in the Arduino codes and uses I and ” != ” statement to change the color individually without other color coming out all the time. The final effect look like this:
Here is the code for Arduino:
Here is the code for Processing:
import processing.serial.*;
import processing.sound.*;
import osteele.processing.SerialRecord.*;

SoundFile sample;
FFT fft;
Amplitude analysis;

Serial serialPort;
SerialRecord serialRecord;

int bands = 1024;
float smoothingFactor = 0.1;
float[] sum = new float[bands];
int scale = 10;
float barWidth;

int W;         //width of the tiles
int NUM = 60;  //amount of pixels
int[] r = new int[NUM]; //red of each tile
int[] g = new int[NUM]; //red of each tile
int[] b = new int[NUM]; //red of each tile

void setup() {
  size(1024, 256);
  background(0);

  barWidth = 10*width/float(bands);

  // load and play a sound file in a loop
  sample = new SoundFile(this, "gorillaz-feel-good-inc-mp3.mp3");
  sample.loop();

  fft = new FFT(this, bands);
  fft.input(sample);

  // create the Amplitude analysis object
  analysis = new Amplitude(this);
  // analyze the playing sound file
  analysis.input(sample);

  String serialPortName = SerialUtils.findArduinoPort();
  serialPort = new Serial(this, serialPortName, 9600);
  serialRecord = new SerialRecord(this, serialPort, 5);
  serialRecord.logToCanvas(false);
}

void draw() {
  println(analysis.analyze());
  background(0);
  long t = millis();
  fft.analyze();
  float volume = analysis.analyze();
  float diameter = map(volume, 0, 1, 0, width);

  if (t < 41250) {
    for (int i = 0; i < bands; i++) {
      // Smooth the FFT spectrum data by smoothing factor
      sum[i] += (fft.spectrum[i] - sum[i]) * smoothingFactor;

      // Draw the rectangles, adjust their height using the scale factor
      fill(0, 0, diameter/3);
      rect(i*barWidth, height, barWidth, -sum[i]*height*scale);
    }
      int blue = floor(map(volume, 0, 1, 0, 255));
      serialRecord.values[0] = 0;
      serialRecord.values[1] = 0;
      serialRecord.values[2] = blue;
      serialRecord.values[3] = 0;
      serialRecord.values[4] = 0;
      serialRecord.send();
  } else if ((t >= 41250) && t < 72000) {
    for (int i = 0; i < bands; i++) {
      // Smooth the FFT spectrum data by smoothing factor
      sum[i] += (fft.spectrum[i] - sum[i]) * smoothingFactor;
      // Draw the rectangles, adjust their height using the scale factor
      fill(diameter/3, 0, diameter/3);
      rect(i*barWidth, height, barWidth, -sum[i]*height*scale);
    }
    int purple = floor(map(volume, 0, 1, 0, 255));
    serialRecord.values[0] = 0;
    serialRecord.values[1] = 0;
    serialRecord.values[2] = 0;
    serialRecord.values[3] = purple;
    serialRecord.values[4] = 0;
    serialRecord.send();
  } else if ((t >= 72000) && t < 103500) {
    for (int i = 0; i < bands; i++) {
      // Smooth the FFT spectrum data by smoothing factor
      sum[i] += (fft.spectrum[i] - sum[i]) * smoothingFactor;
      // Draw the rectangles, adjust their height using the scale factor
      fill(0, diameter/3, 0);
      rect(i*barWidth, height, barWidth, -sum[i]*height*scale);
    }
    int green = floor(map(volume, 0, 1, 0, 255));
    serialRecord.values[0] = 0;
    serialRecord.values[1] = green;
    serialRecord.values[2] = 0;
    serialRecord.values[3] = 0;
    serialRecord.values[4] = 0;
    serialRecord.send();
  } else if ((t >= 103500) && t < 145000) {
    for (int i = 0; i < bands; i++) {
      // Smooth the FFT spectrum data by smoothing factor
      sum[i] += (fft.spectrum[i] - sum[i]) * smoothingFactor;
      // Draw the rectangles, adjust their height using the scale factor
      fill(diameter/3, 0, 0);
      rect(i*barWidth, height, barWidth, -sum[i]*height*scale);
    }
    int red = floor(map(volume, 0, 1, 0, 255));
    serialRecord.values[0] = red;
    serialRecord.values[1] = 0;
    serialRecord.values[2] = 0;
    serialRecord.values[3] = 0;
    serialRecord.values[4] = 0;
    serialRecord.send();
  } else if ((t >= 145000) && t < 197000) {
    for (int i = 0; i < bands; i++) {
      // Smooth the FFT spectrum data by smoothing factor
      sum[i] += (fft.spectrum[i] - sum[i]) * smoothingFactor;
      // Draw the rectangles, adjust their height using the scale factor
      fill(0, diameter/3, diameter/3);
      rect(i*barWidth, height, barWidth, -sum[i]*height*scale);
    }
    int skyblue = floor(map(volume, 0, 1, 0, 255));
    serialRecord.values[0] = 0;
    serialRecord.values[1] = 0;
    serialRecord.values[2] = 0;
    serialRecord.values[3] = 0;
    serialRecord.values[4] = skyblue;
    serialRecord.send();
  } else {
    for (int i = 0; i < bands; i++) {
      // Smooth the FFT spectrum data by smoothing factor
      sum[i] += (fft.spectrum[i] - sum[i]) * smoothingFactor;
      // Draw the rectangles, adjust their height using the scale factor
      fill(0, 0, diameter/3);
      rect(i*barWidth, height, barWidth, -sum[i]*height*scale);
    }
      int blue = floor(map(volume, 0, 1, 0, 255));
      serialRecord.values[0] = 0;
      serialRecord.values[1] = 0;
      serialRecord.values[2] = blue;
      serialRecord.values[3] = 0;
      serialRecord.values[4] = 0;
      serialRecord.send();
  }
}
