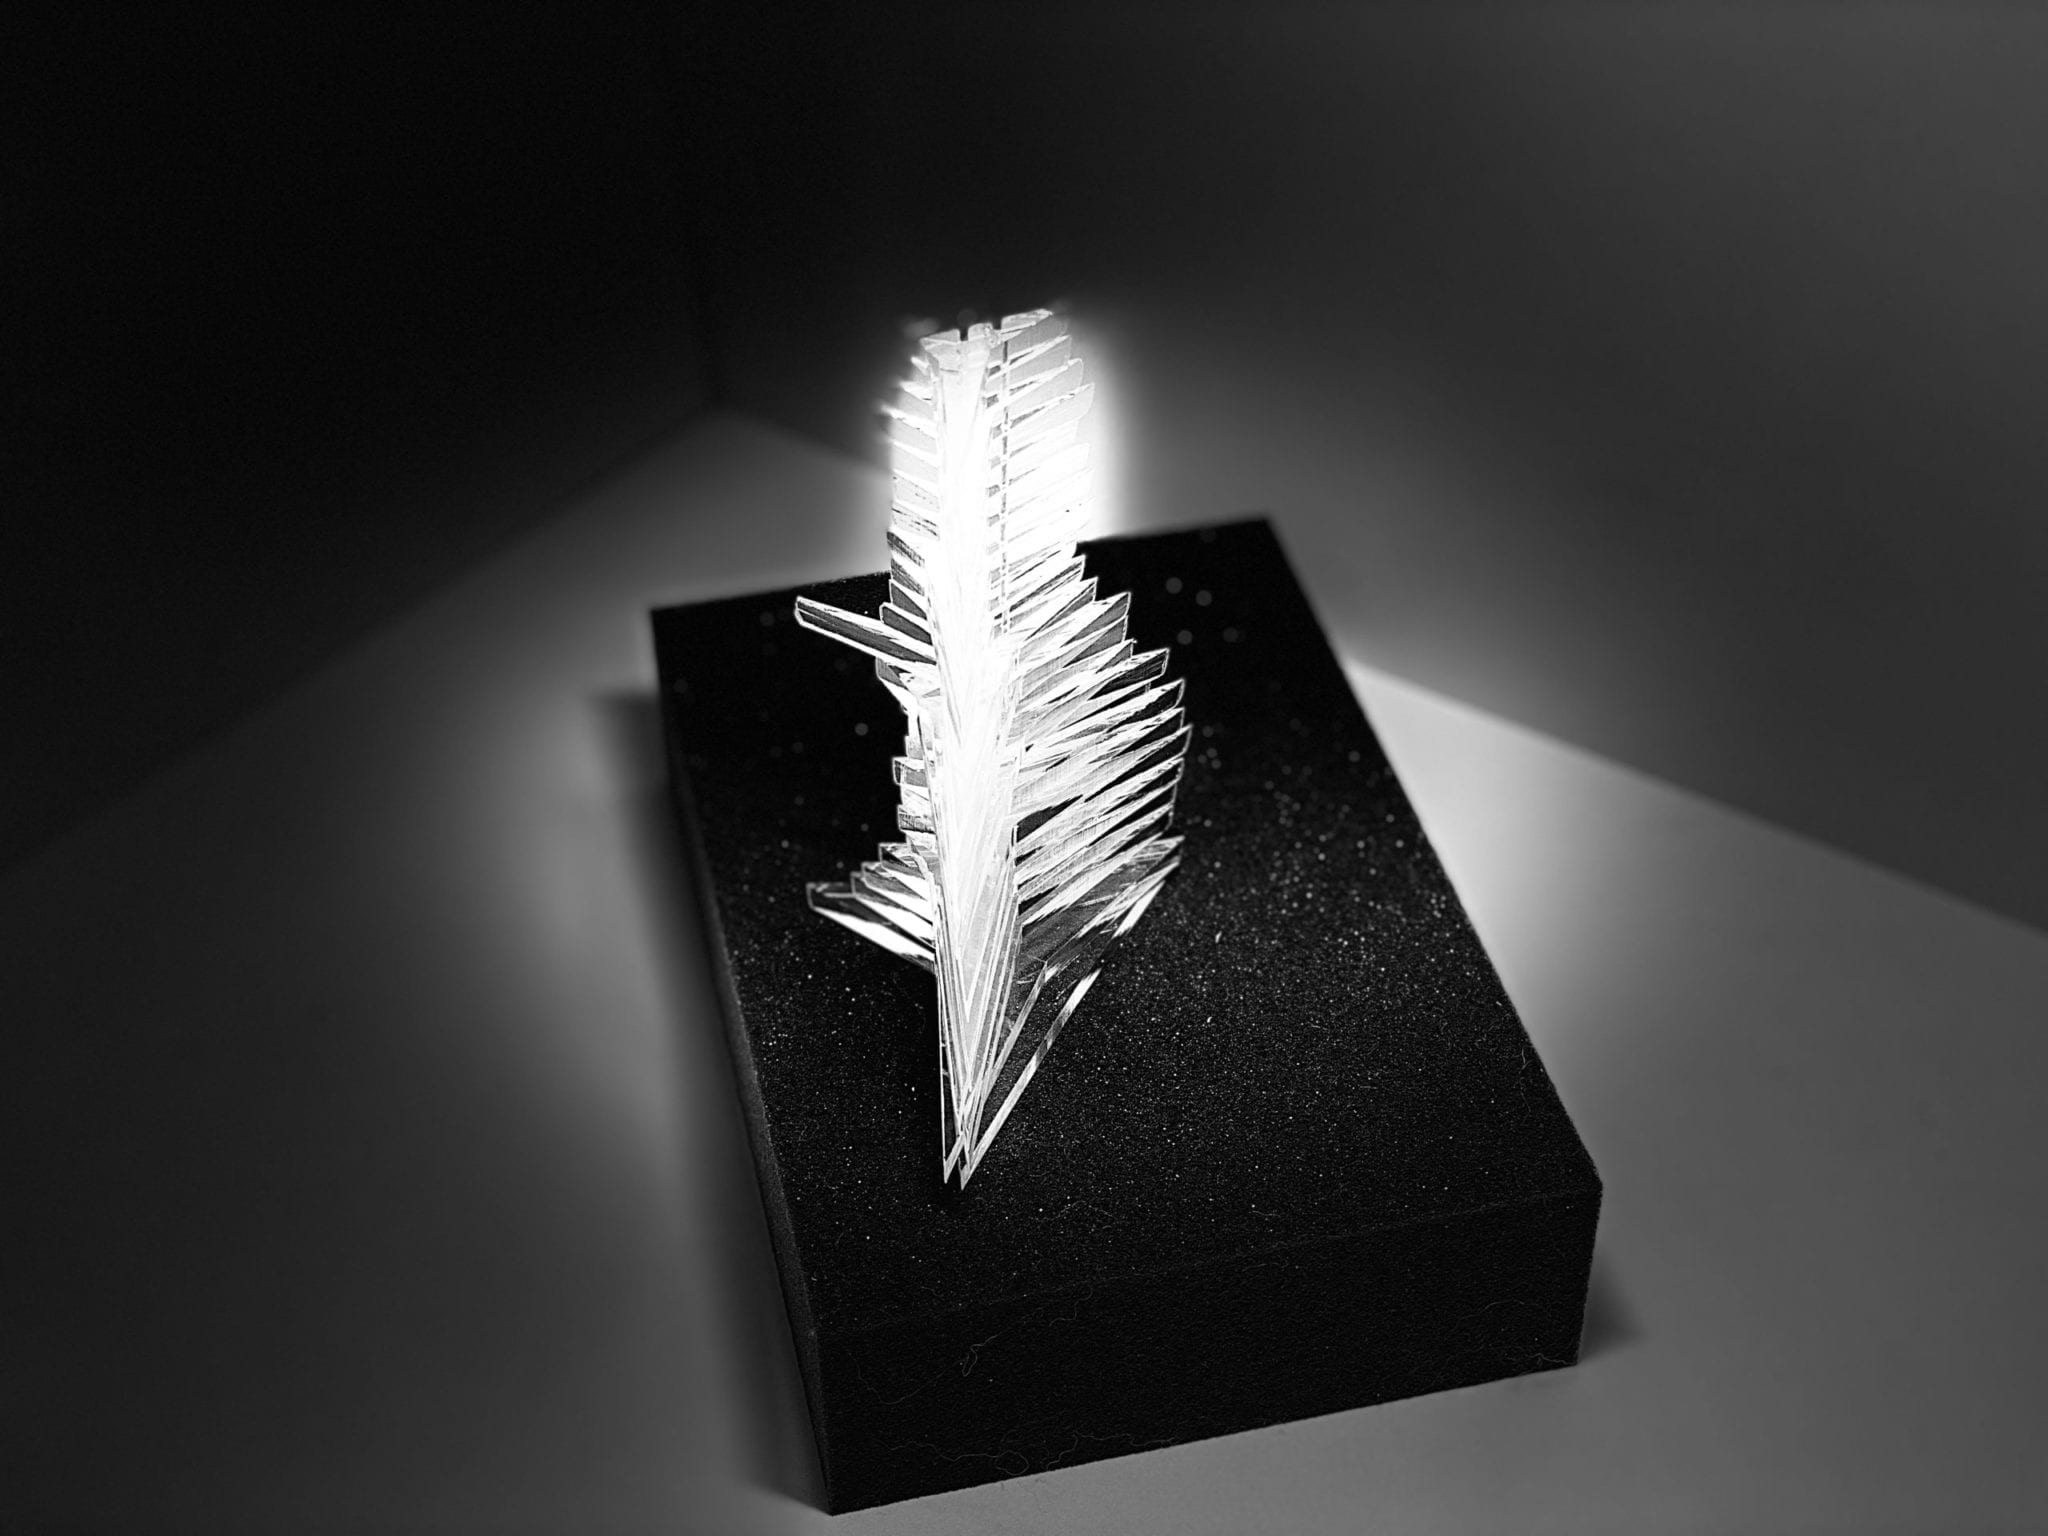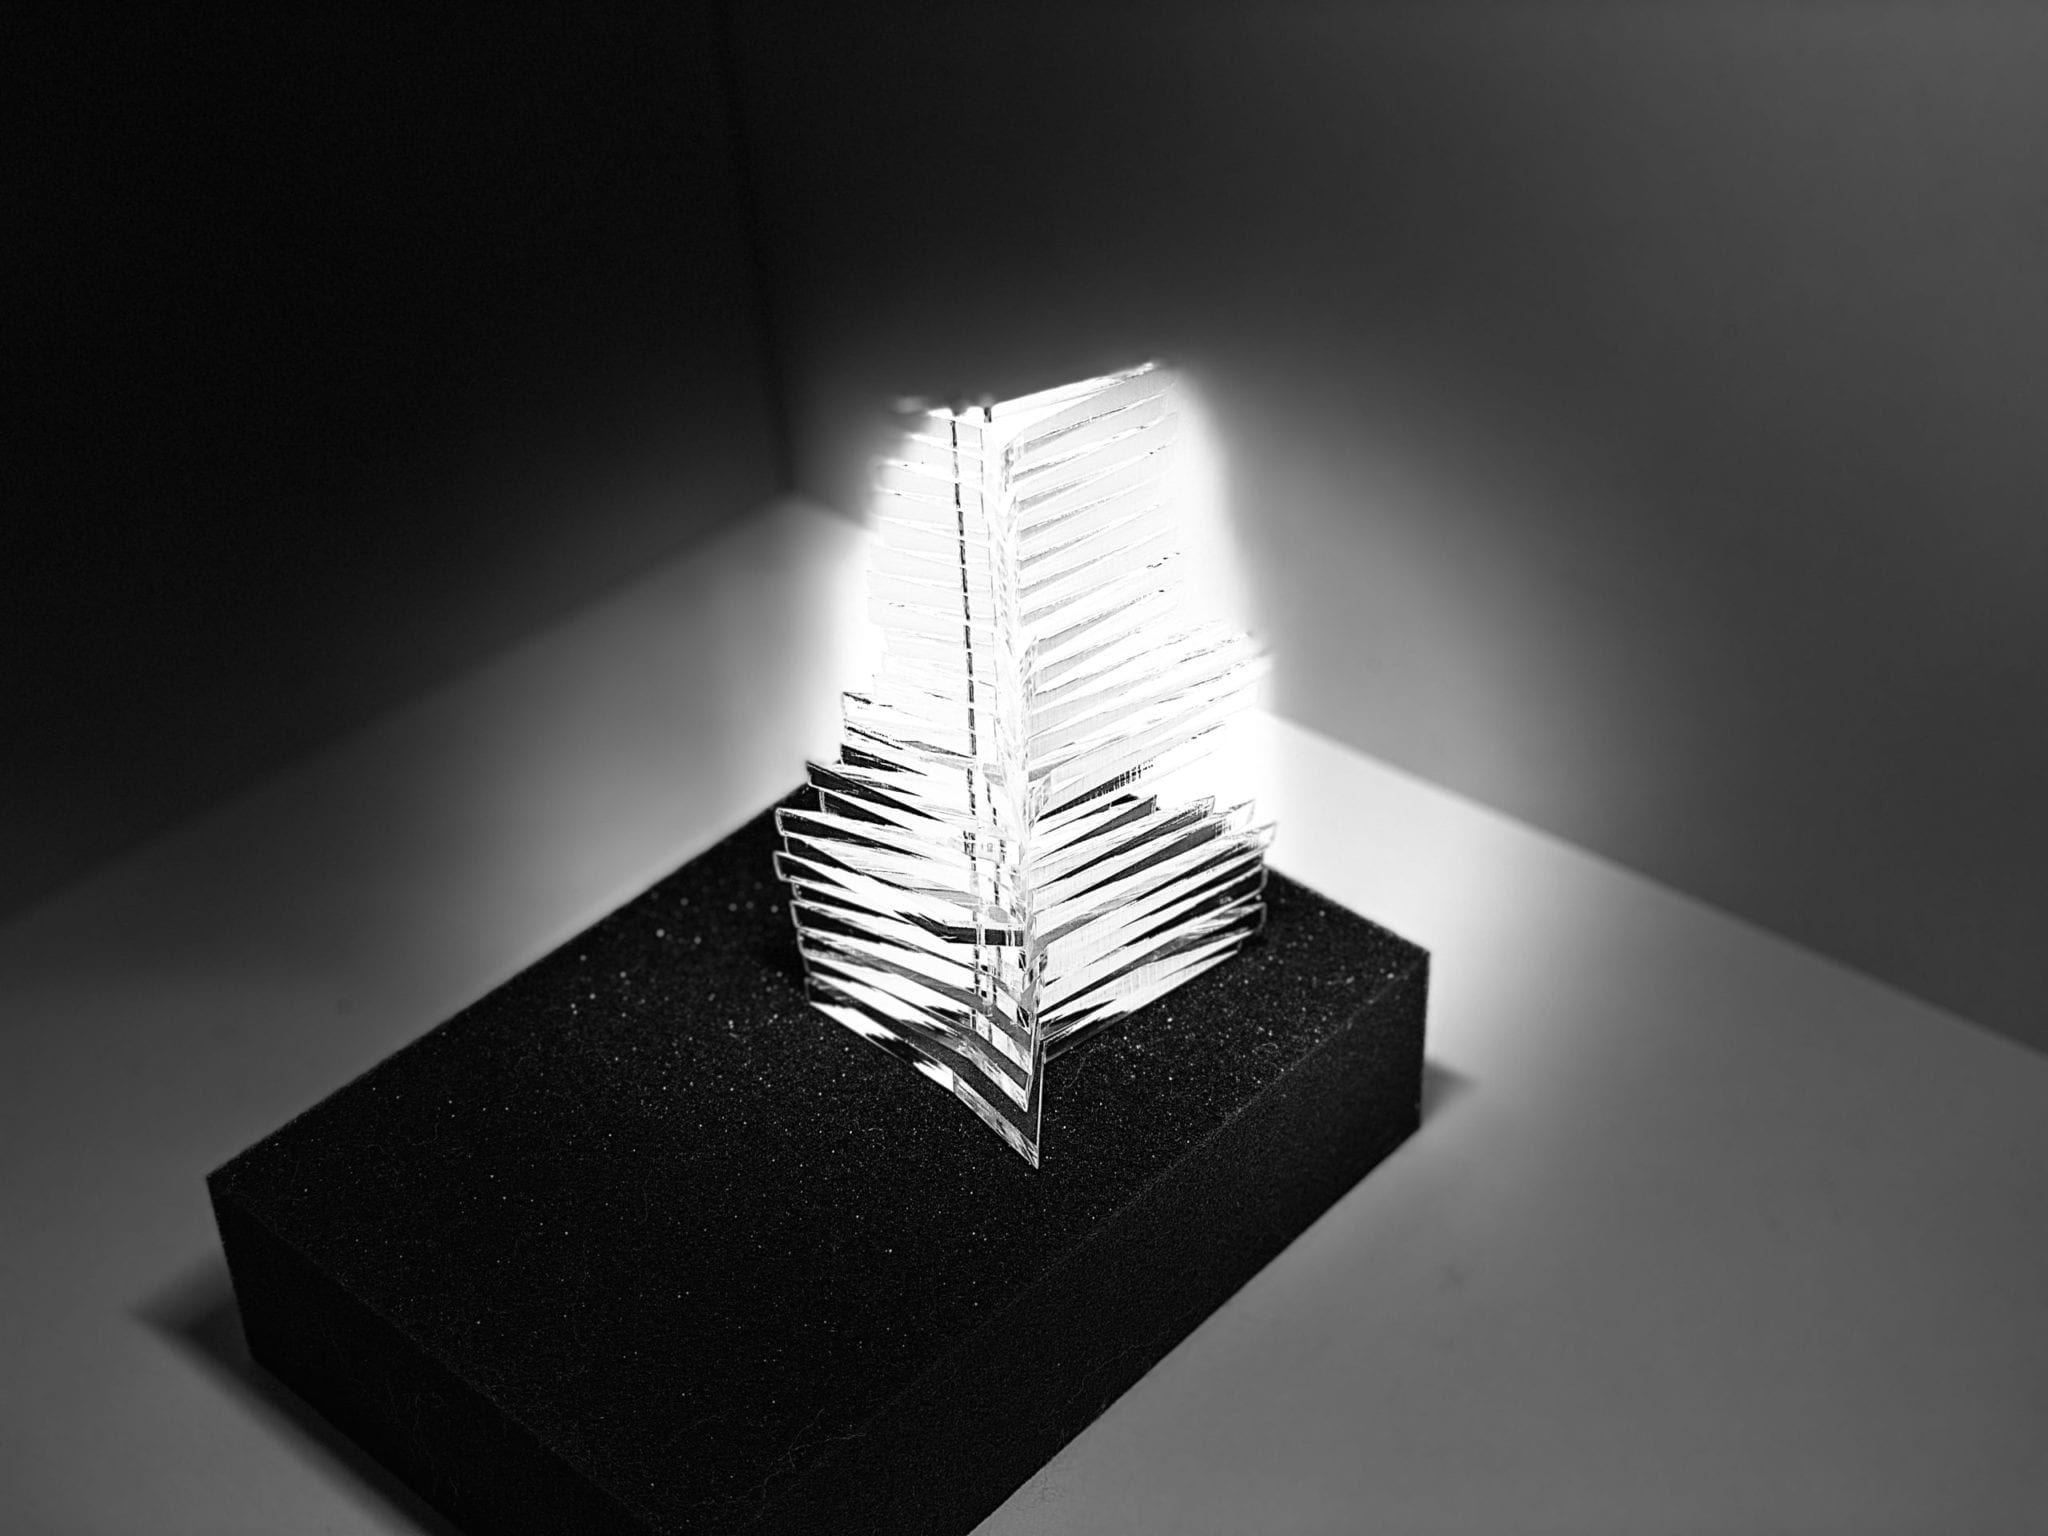
For this assignment, I turned selected US Census Bureau retail sales data from 2019 to 2020 into a readable sculpture. In order to understand the sustaining commercialism and consumers’ behaviors during the pandemic, I create a sculpture that is accessible to read out the information and allows easy interpretation. The sculpture meant to show that the rising commercialism did not stop even during a catastrophic disaster. I chose six unconventional and fairly negligible merchandise for the viewers to reflect according to the incidents in 2019 and 2020.
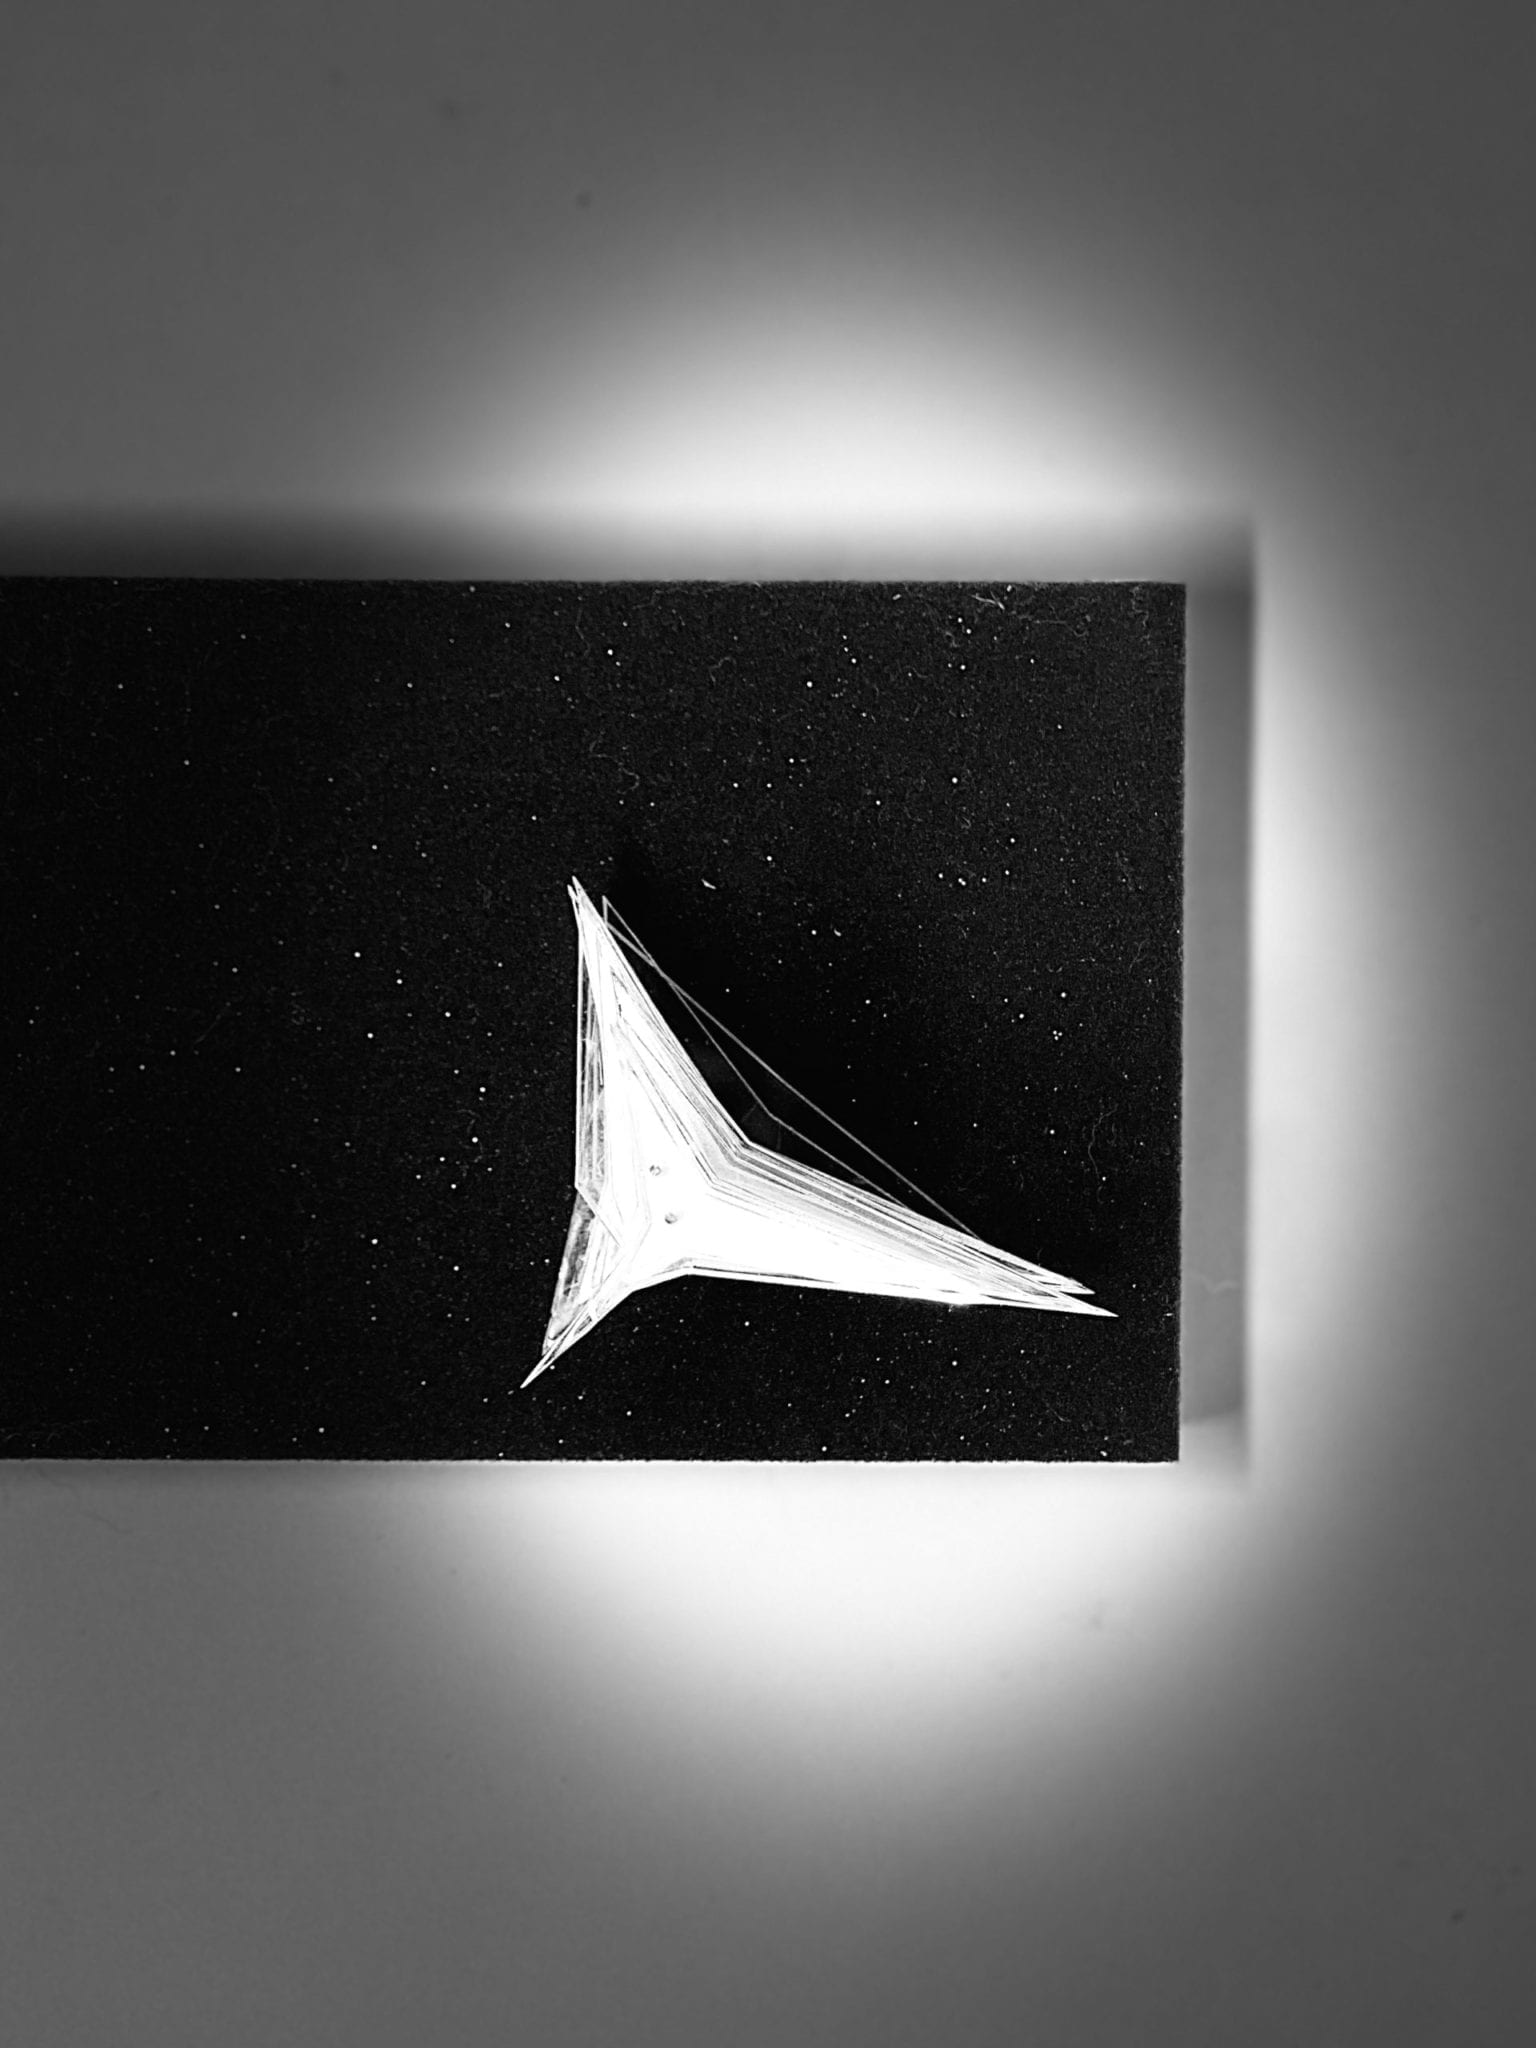
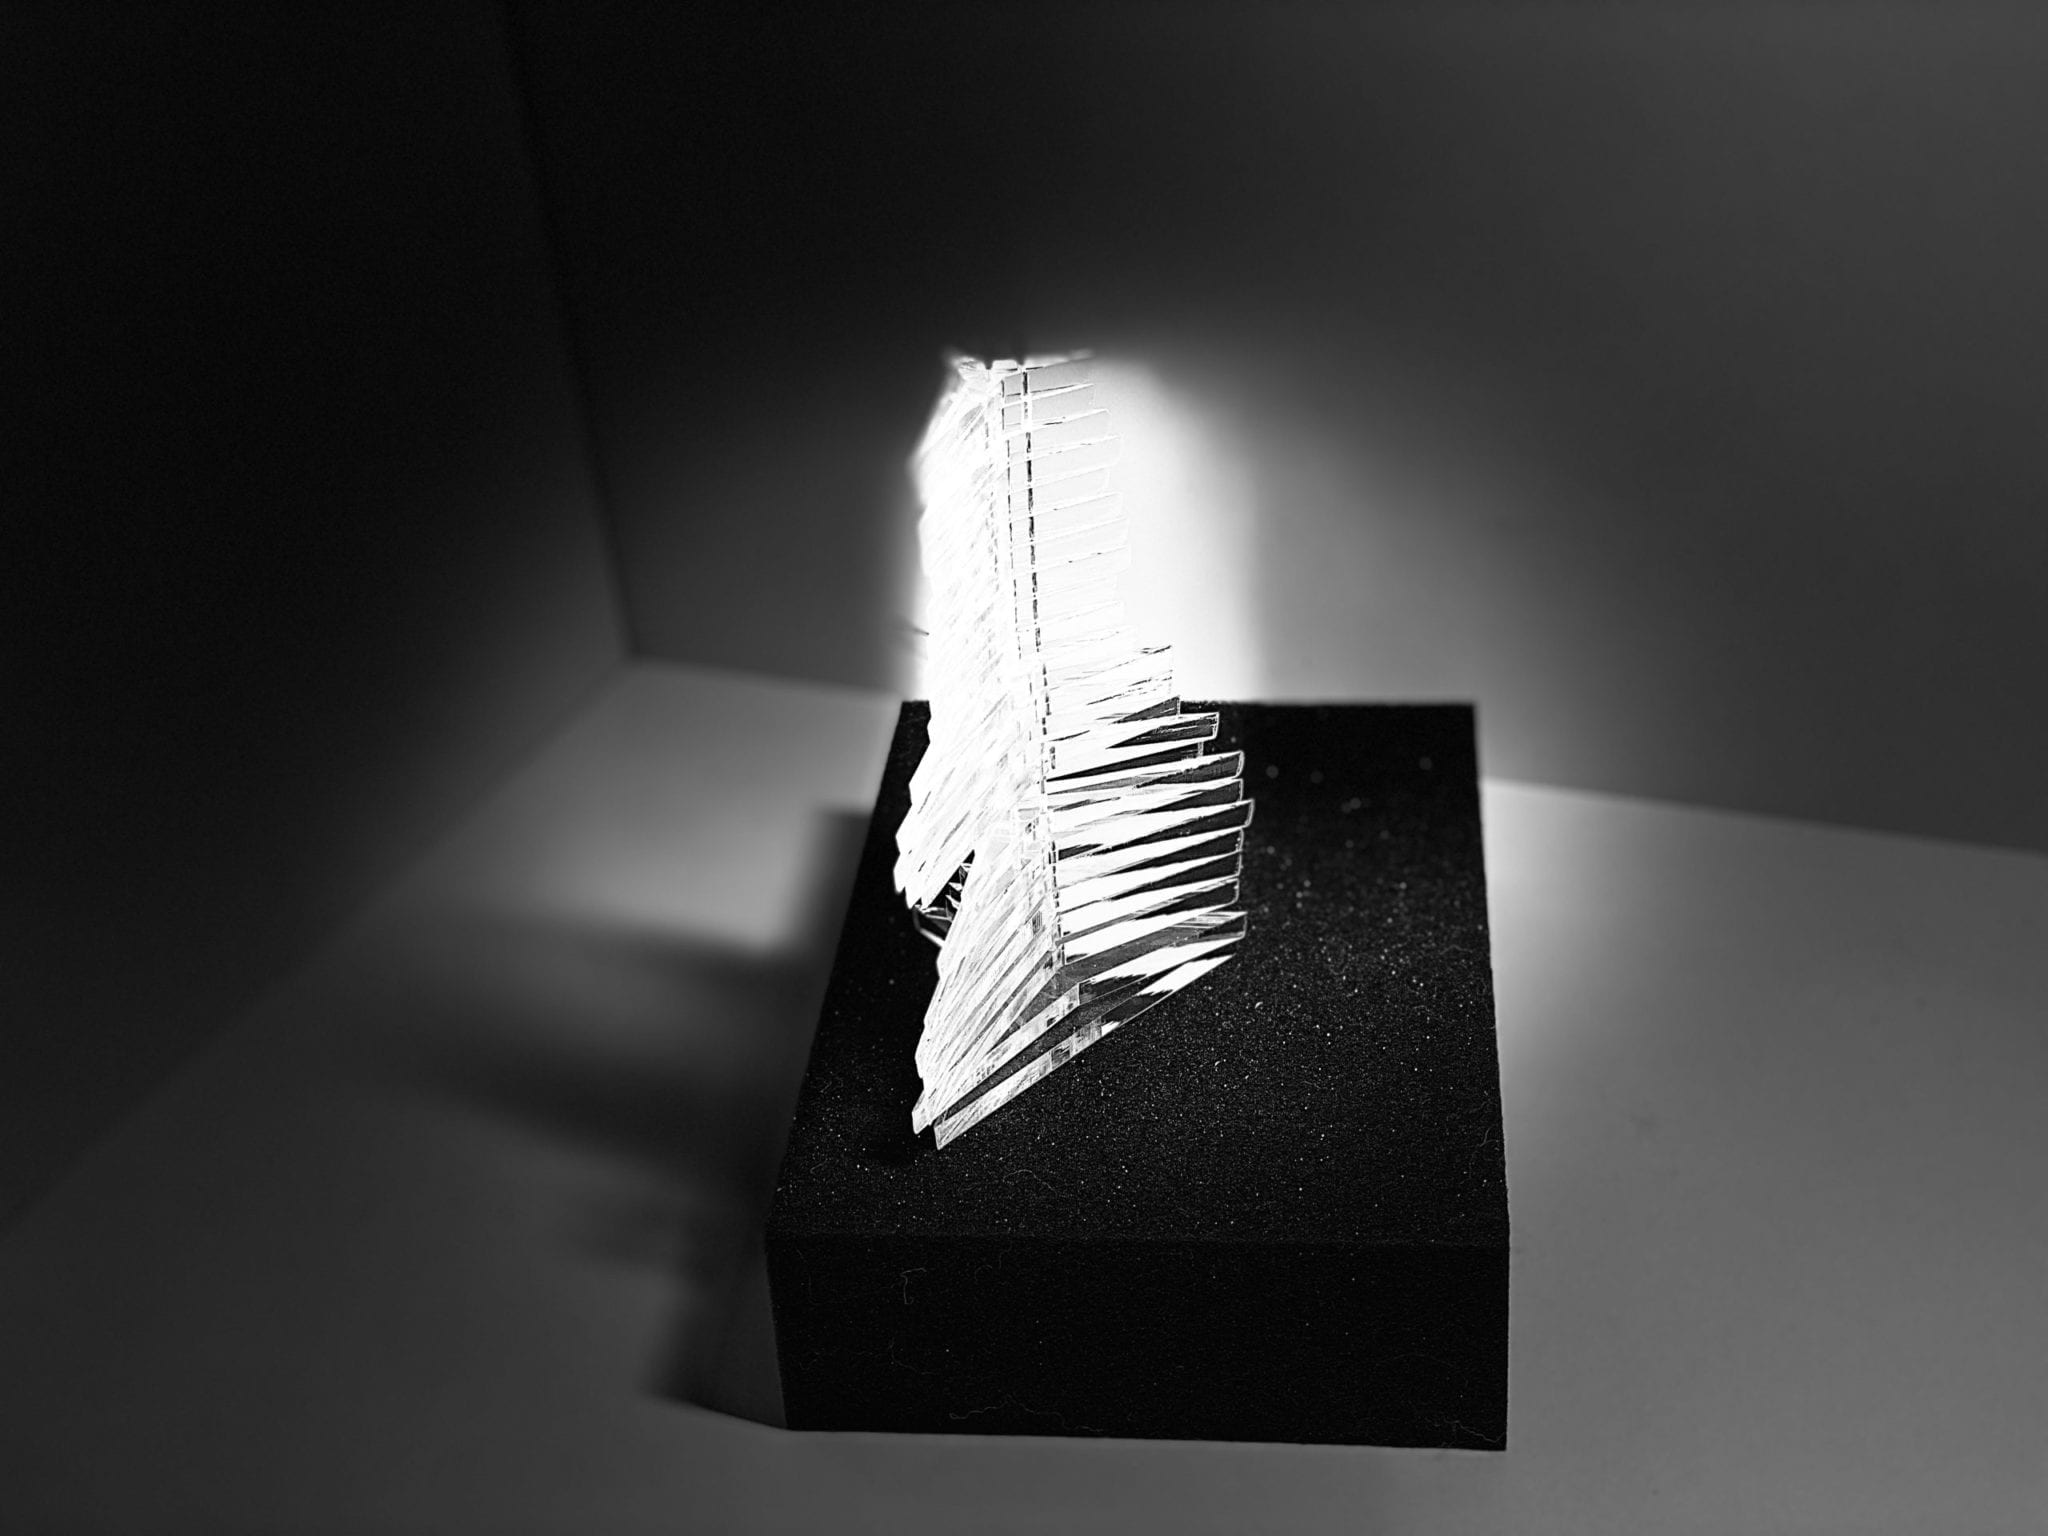
Raw data is manually processed in radar graphs that turn the collected data into vector-based shapes. Each angle of the hexagon represents retail sales in millions for a specific product. The more pointed the corner is, the higher is the related value. These shapes were then be fabricated with a laser cutter and stuck on top of each other to get the dimension of time.
Utilized Data:
Monthly retail sales of bookstores in the United States from 2019 to 2020(in million U.S. dollars)
Images