Project III. CODE + Time Visualization
RealCODE + Time Visualization
Description and Concept
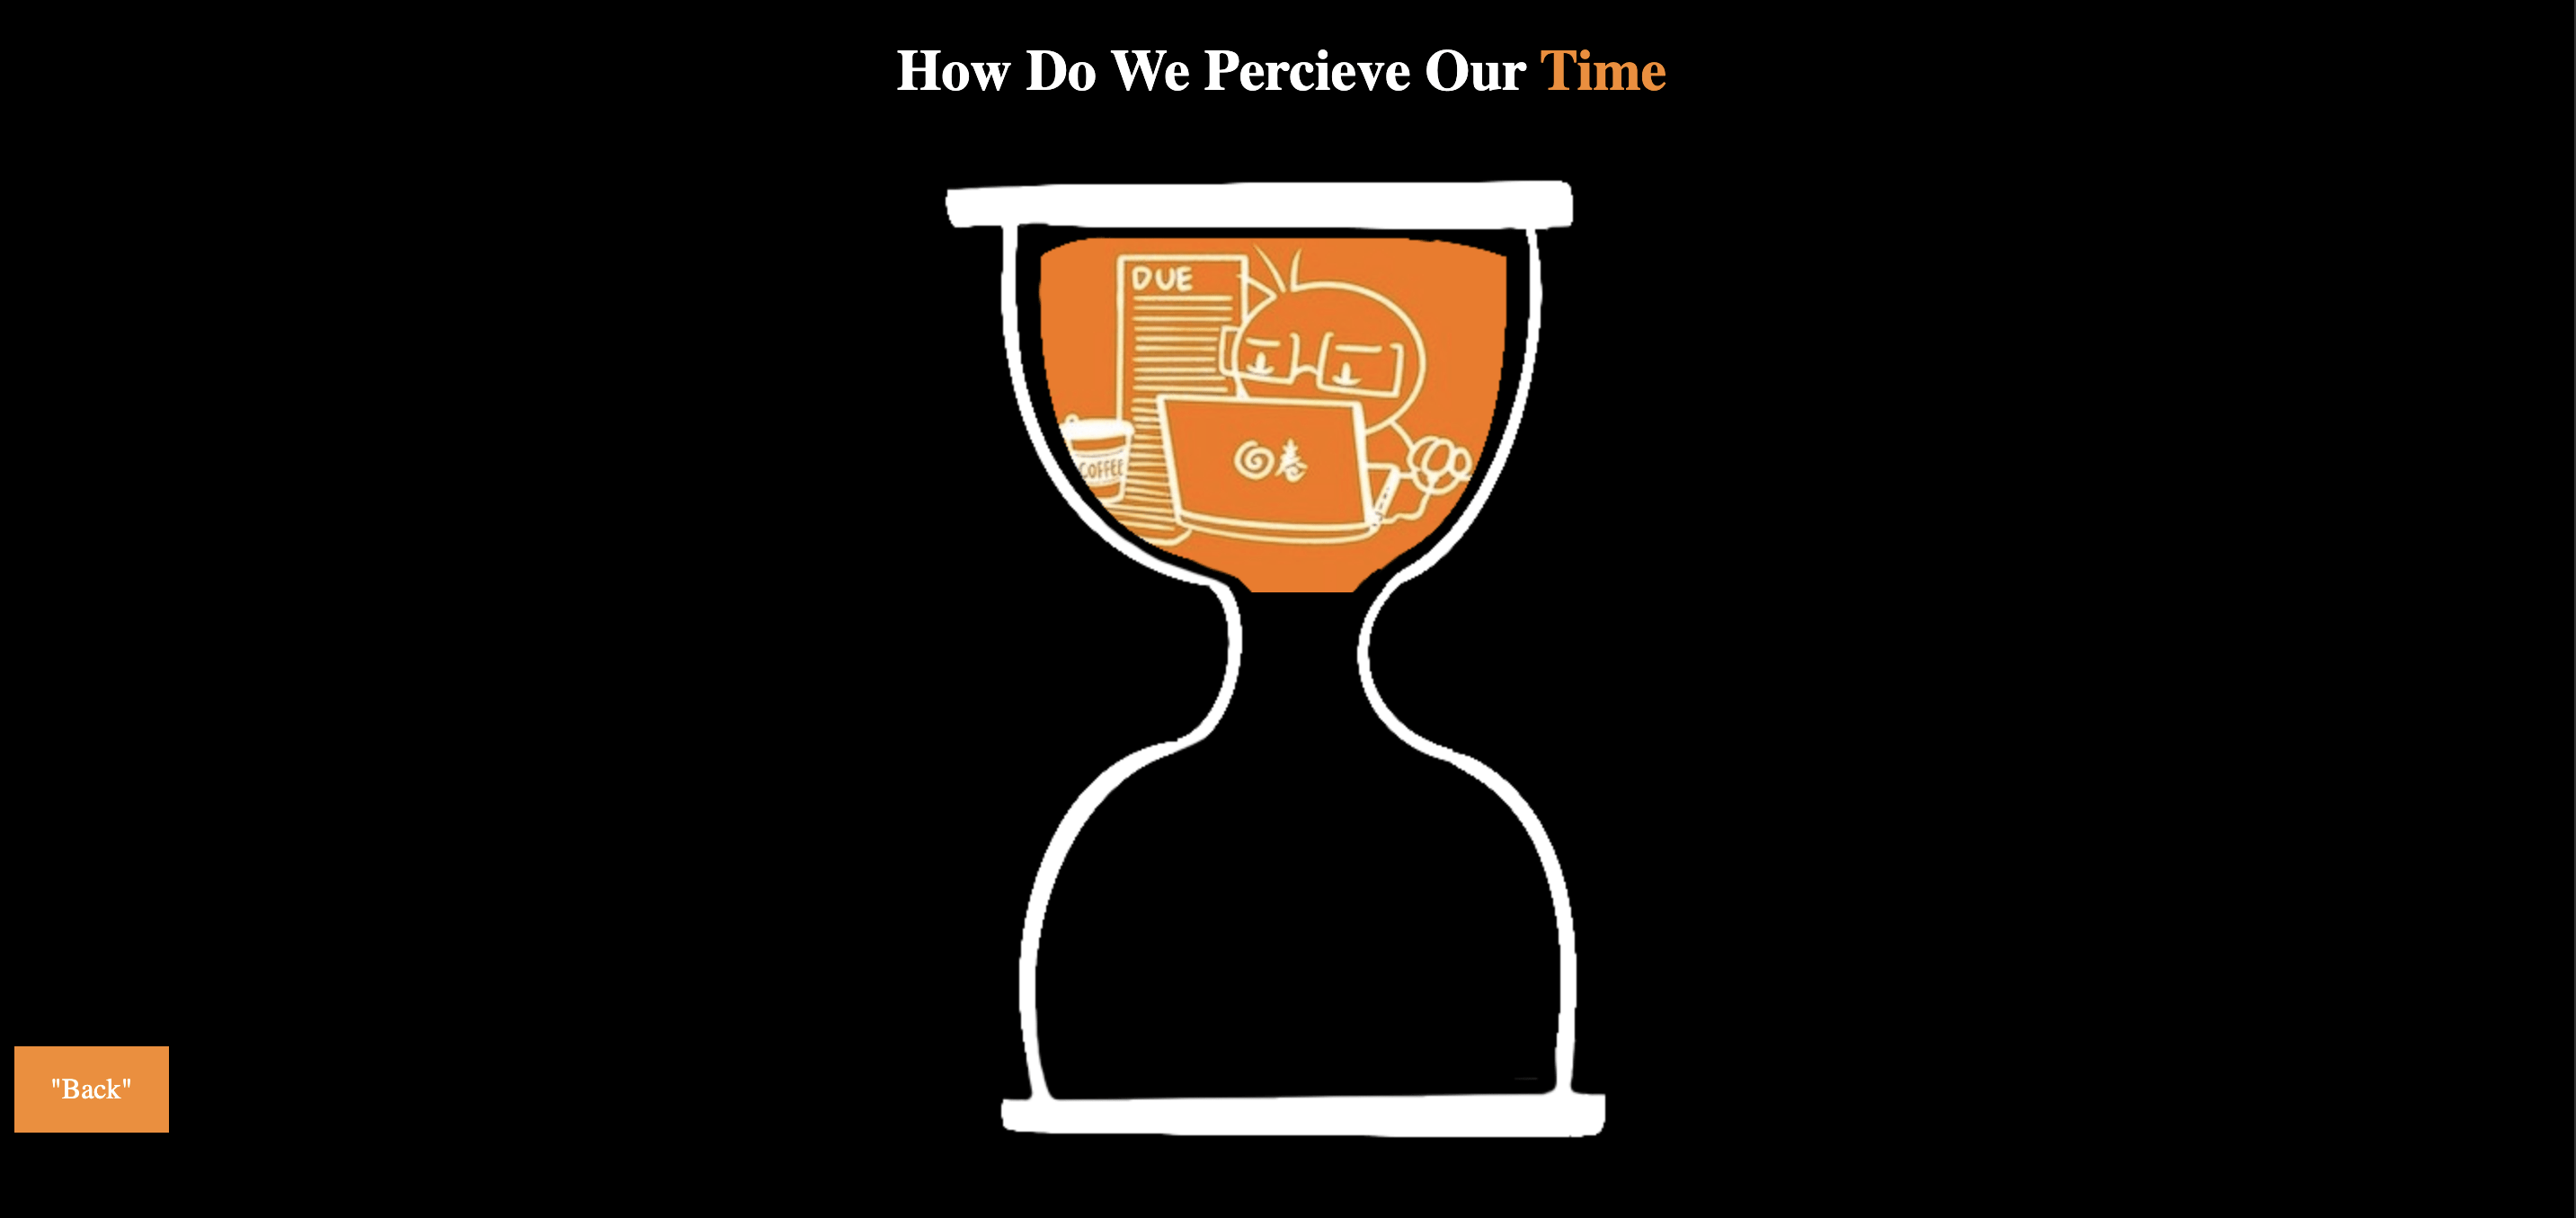
The project is inspired by my time tracking experience. As I tracked my time, I found that only using the 24-hour measurement for time visualization is not effective, because the duration of time I feel when doing different things differs greatly from the recorded amount of time on the calendar.
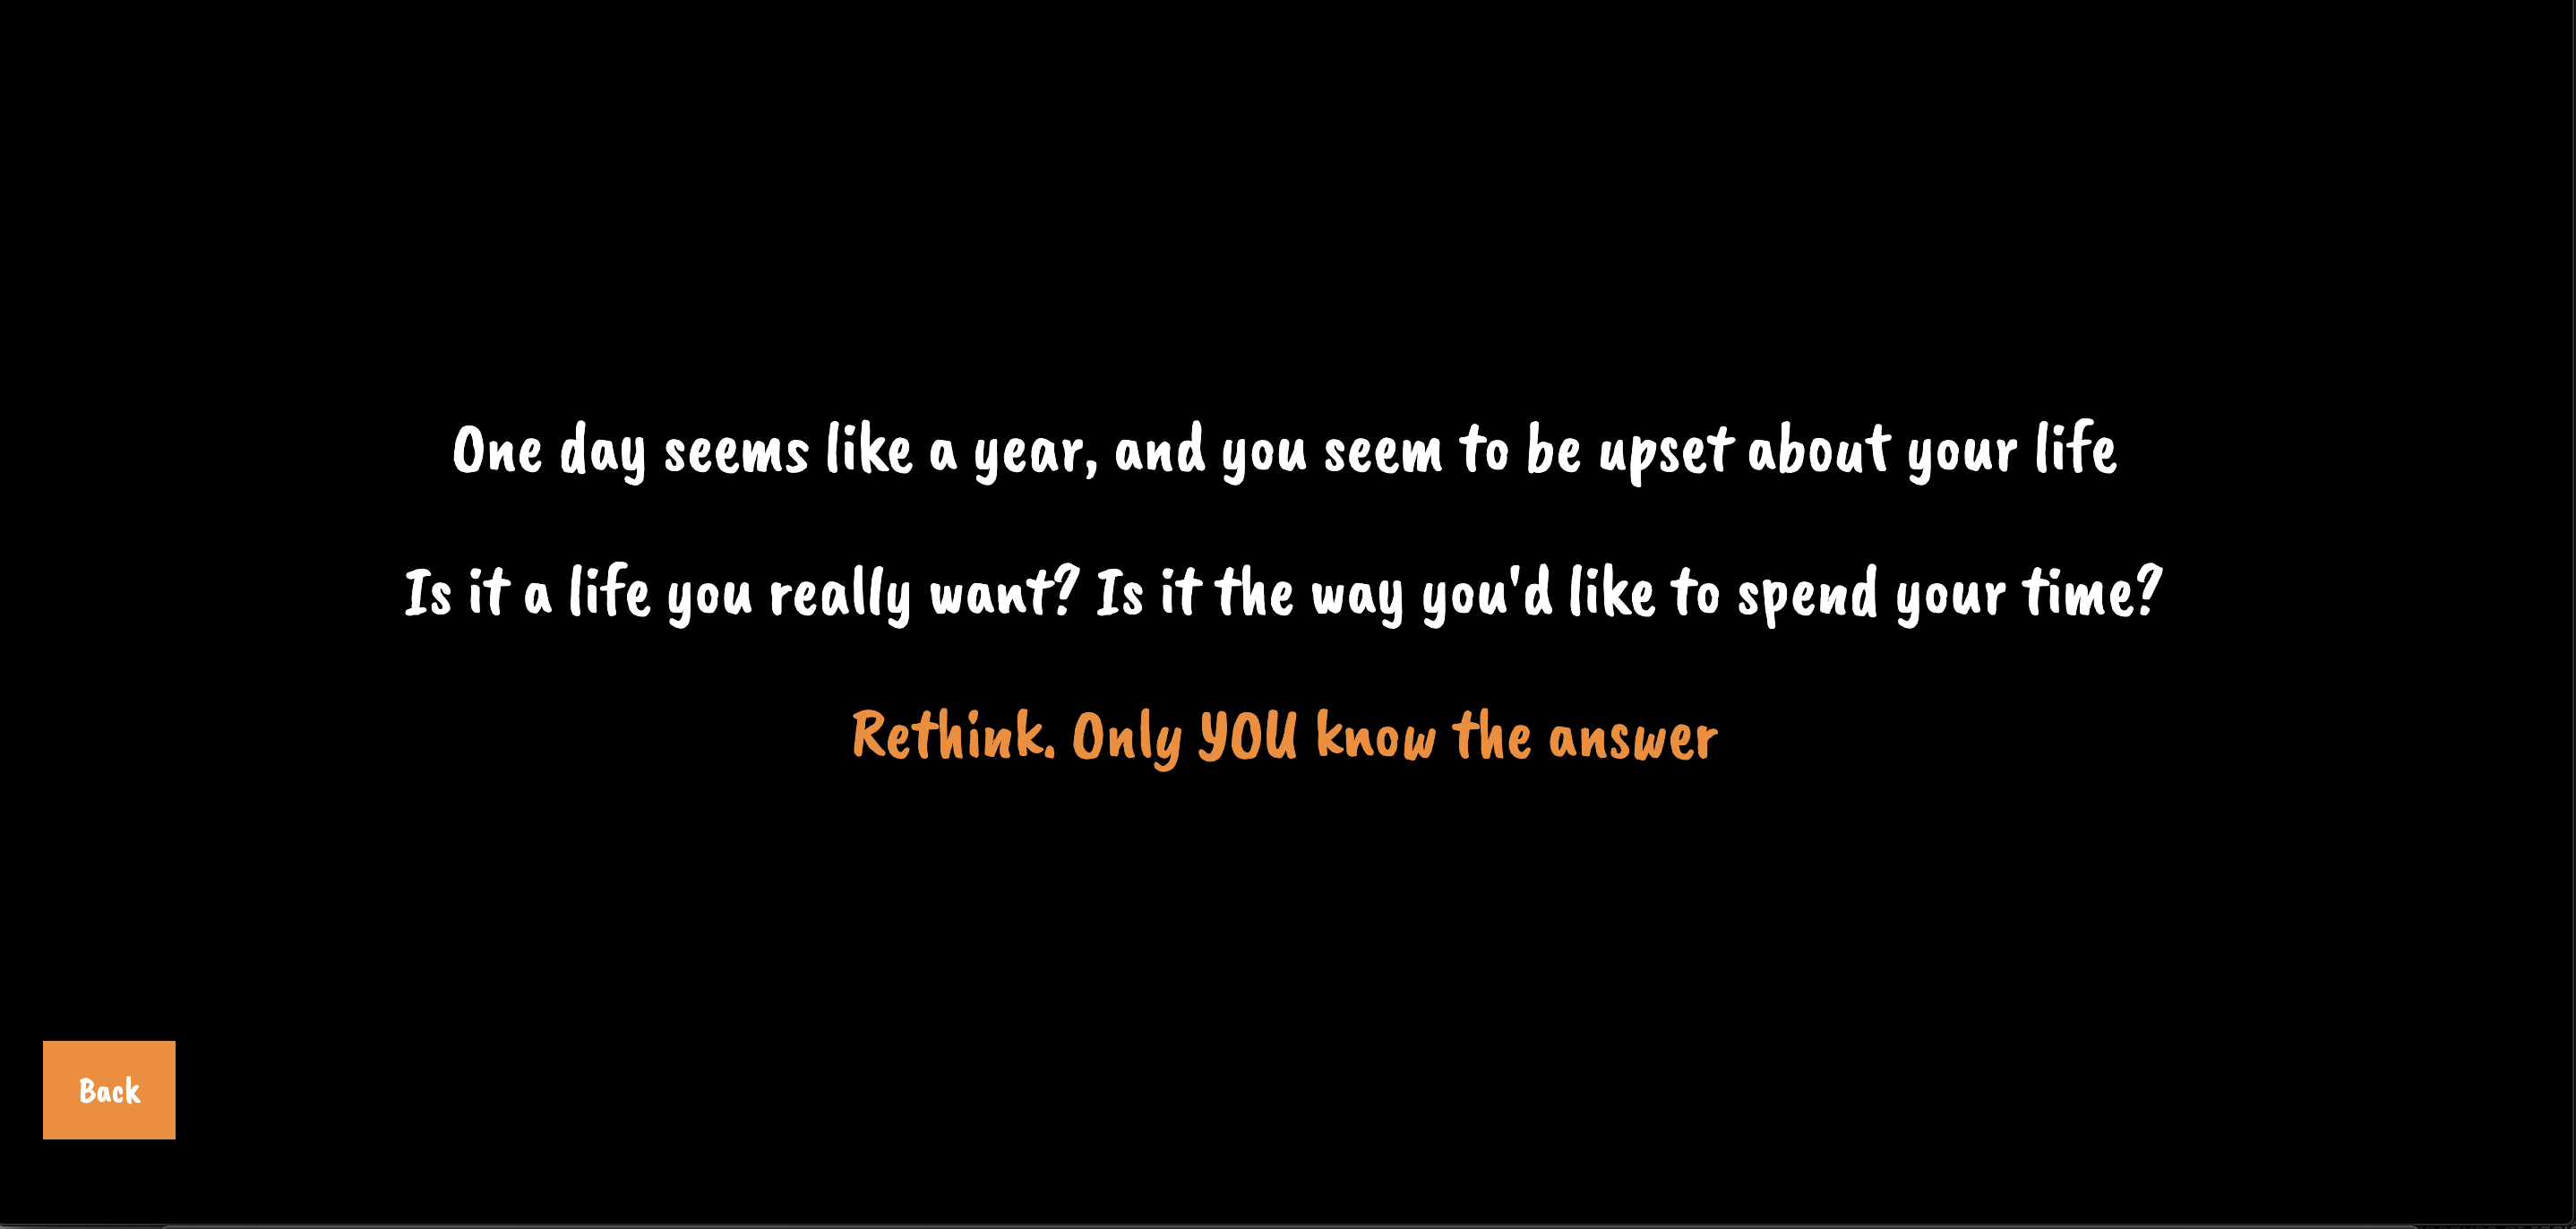
In this project, I visualize users’ perception of time instead of the objective amount of time and encourage people who are busy carrying on daily routines and schedules to take a moment and rethink what they truly want and value.
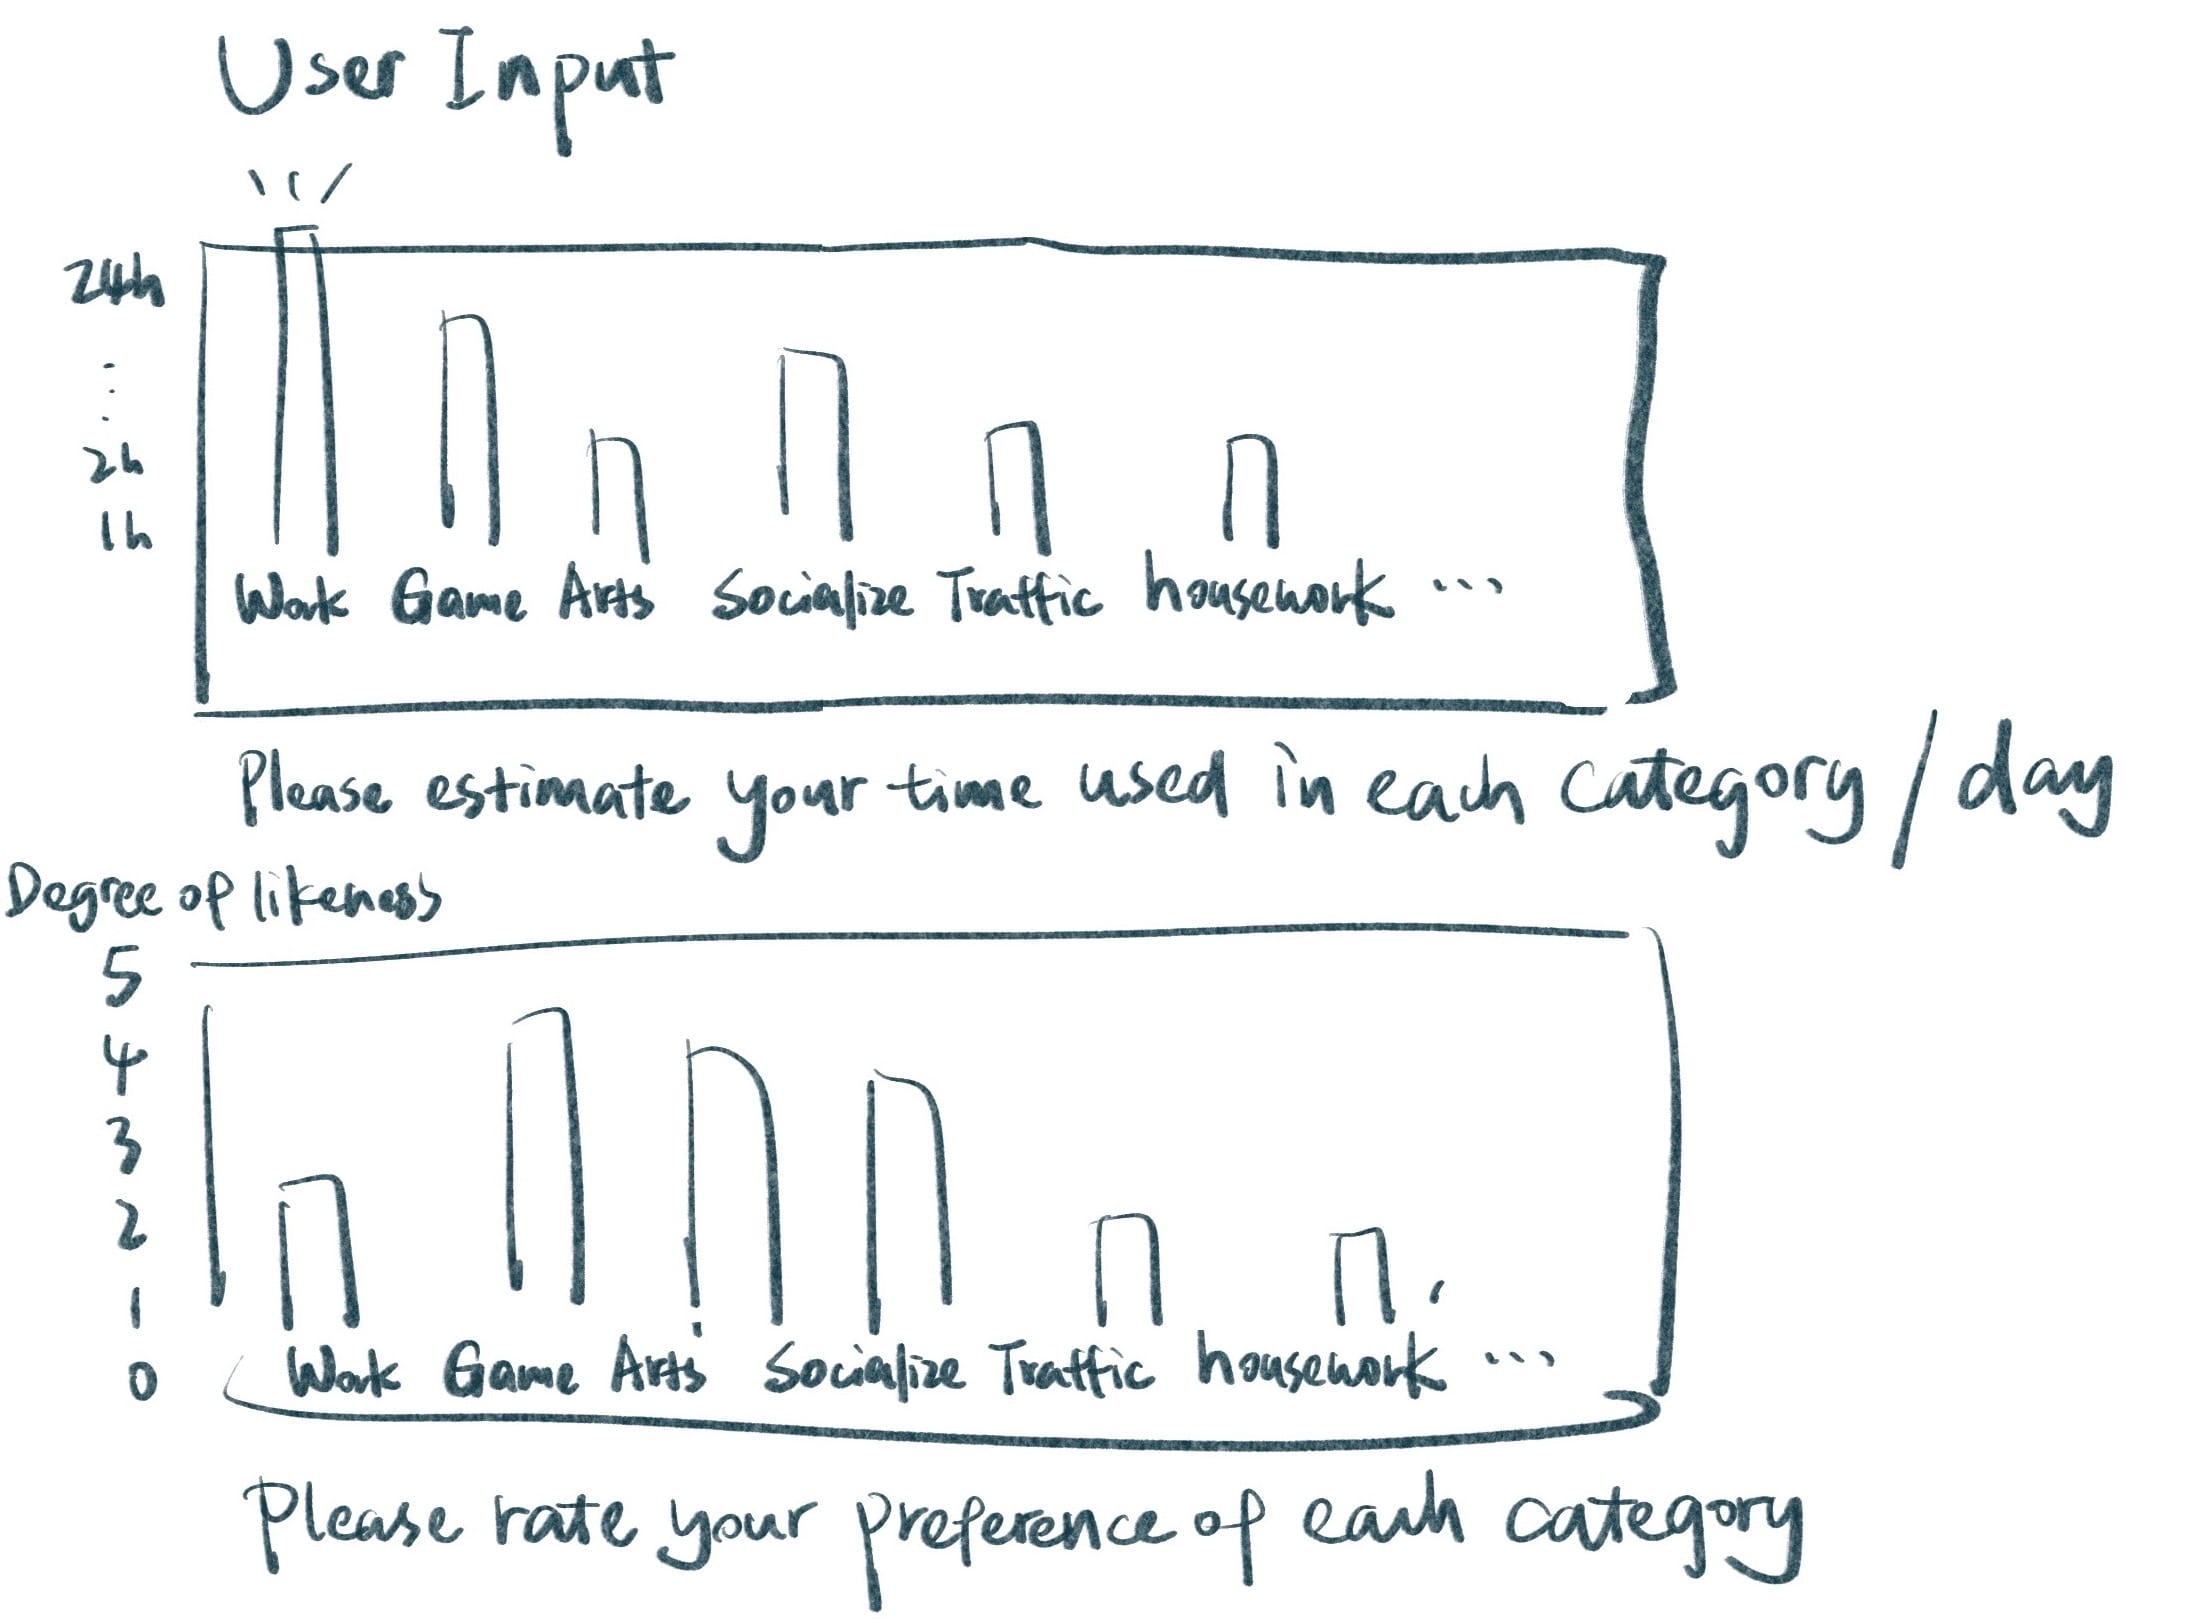
The project contains four parts: 1) Intro animation (without user interaction), 2) user inputs (2 kinds of data: the time spent on and the likeness of different activities), 3) User-input-generated animation (showcase the perception of the speed of the time according to likeness), and 4) revisualization of time based on perception (combine and compare the 2 kinds of data and conclude a final message).
The main techniques used in this project are: 1) utilizing the real-time database to record and retrieve user inputs; 2) pixel manipulation; 3) time sequencing.
The main focuses are: interactive experience (data inputs & mouse clicking) & transmediality (time-visuals).
Demo
Conceptual development
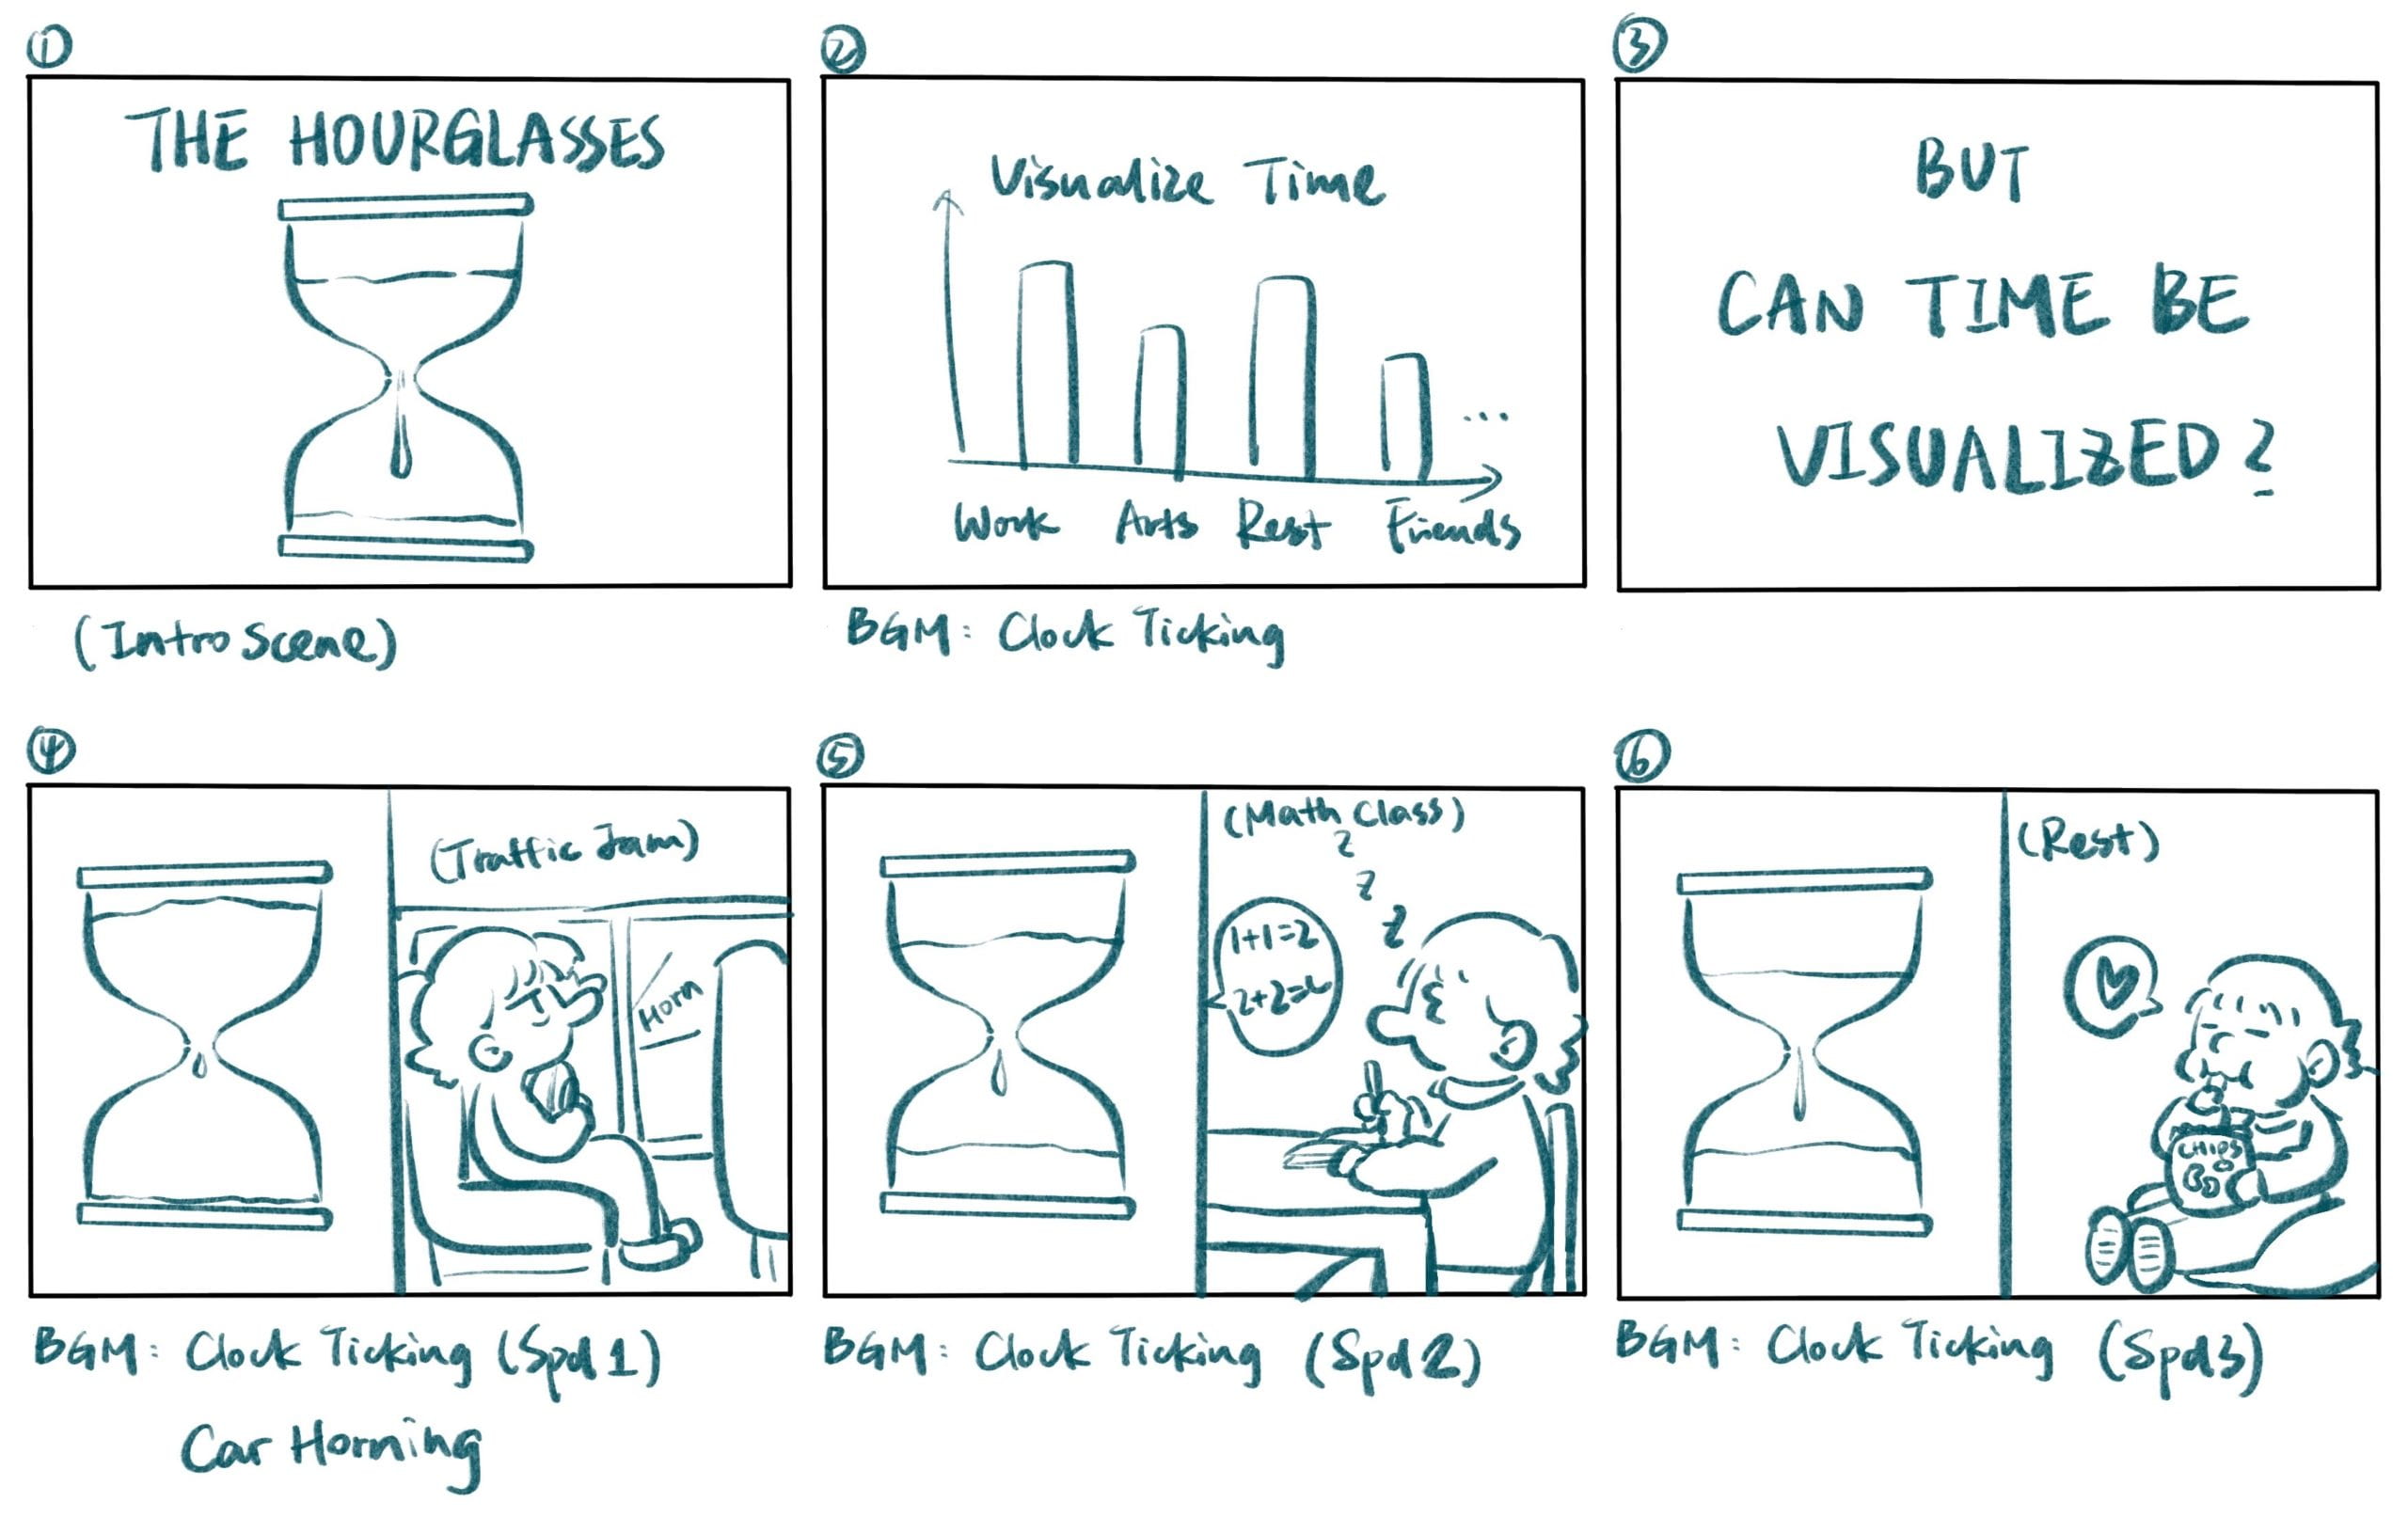
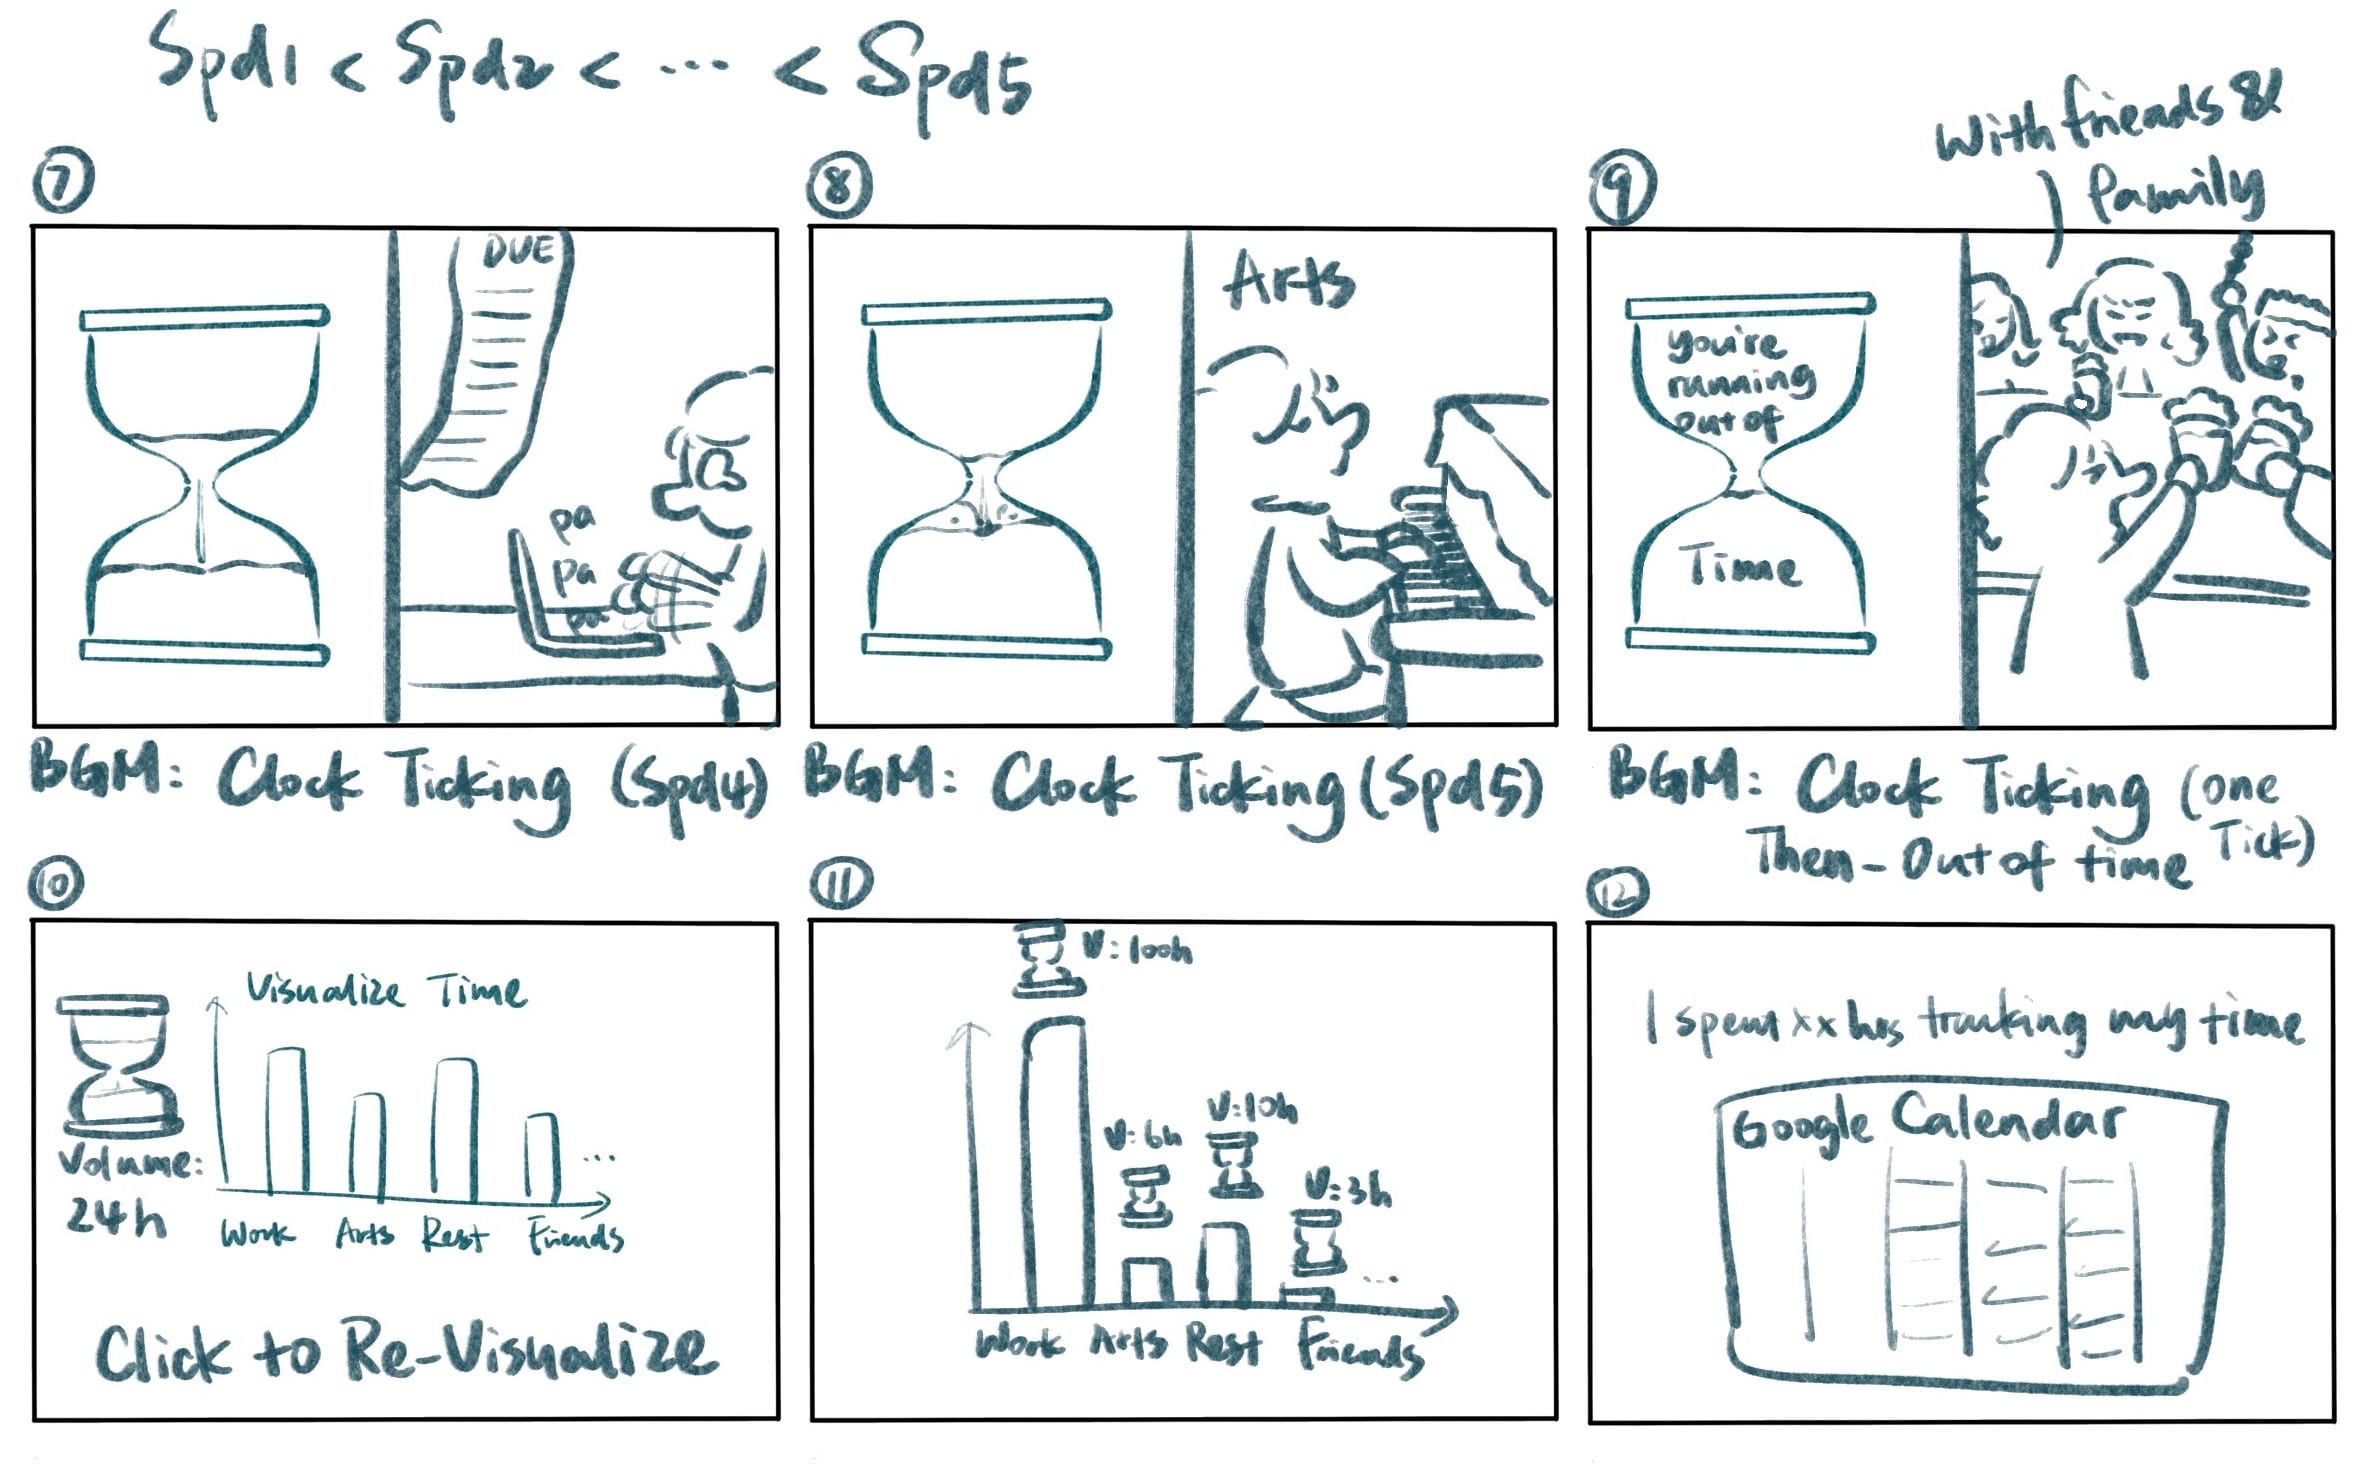
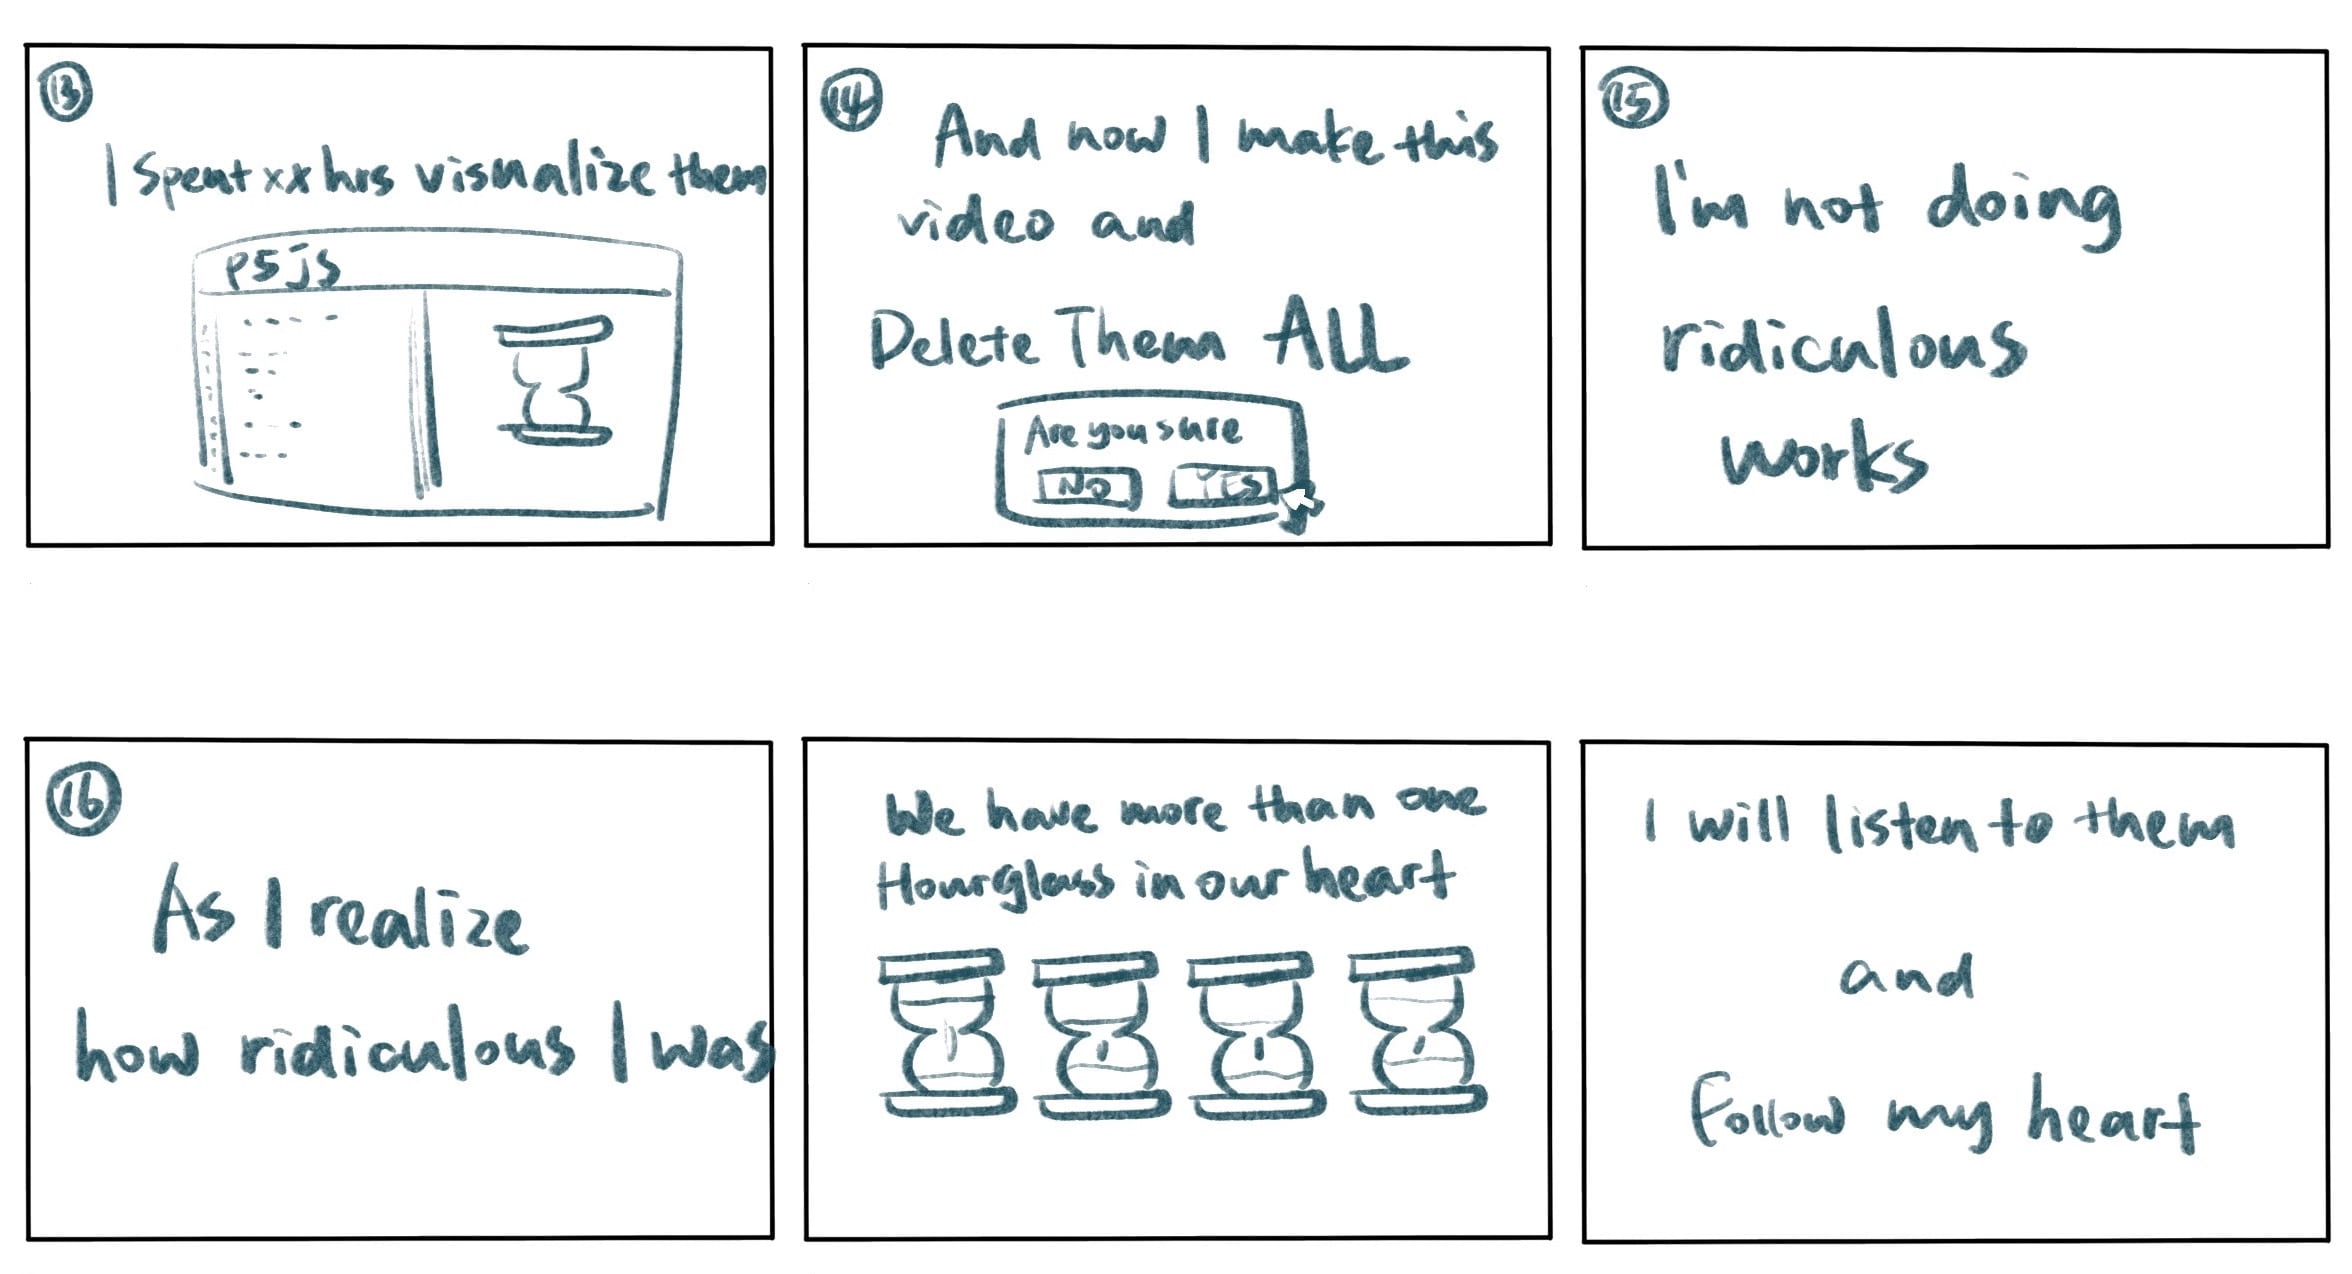
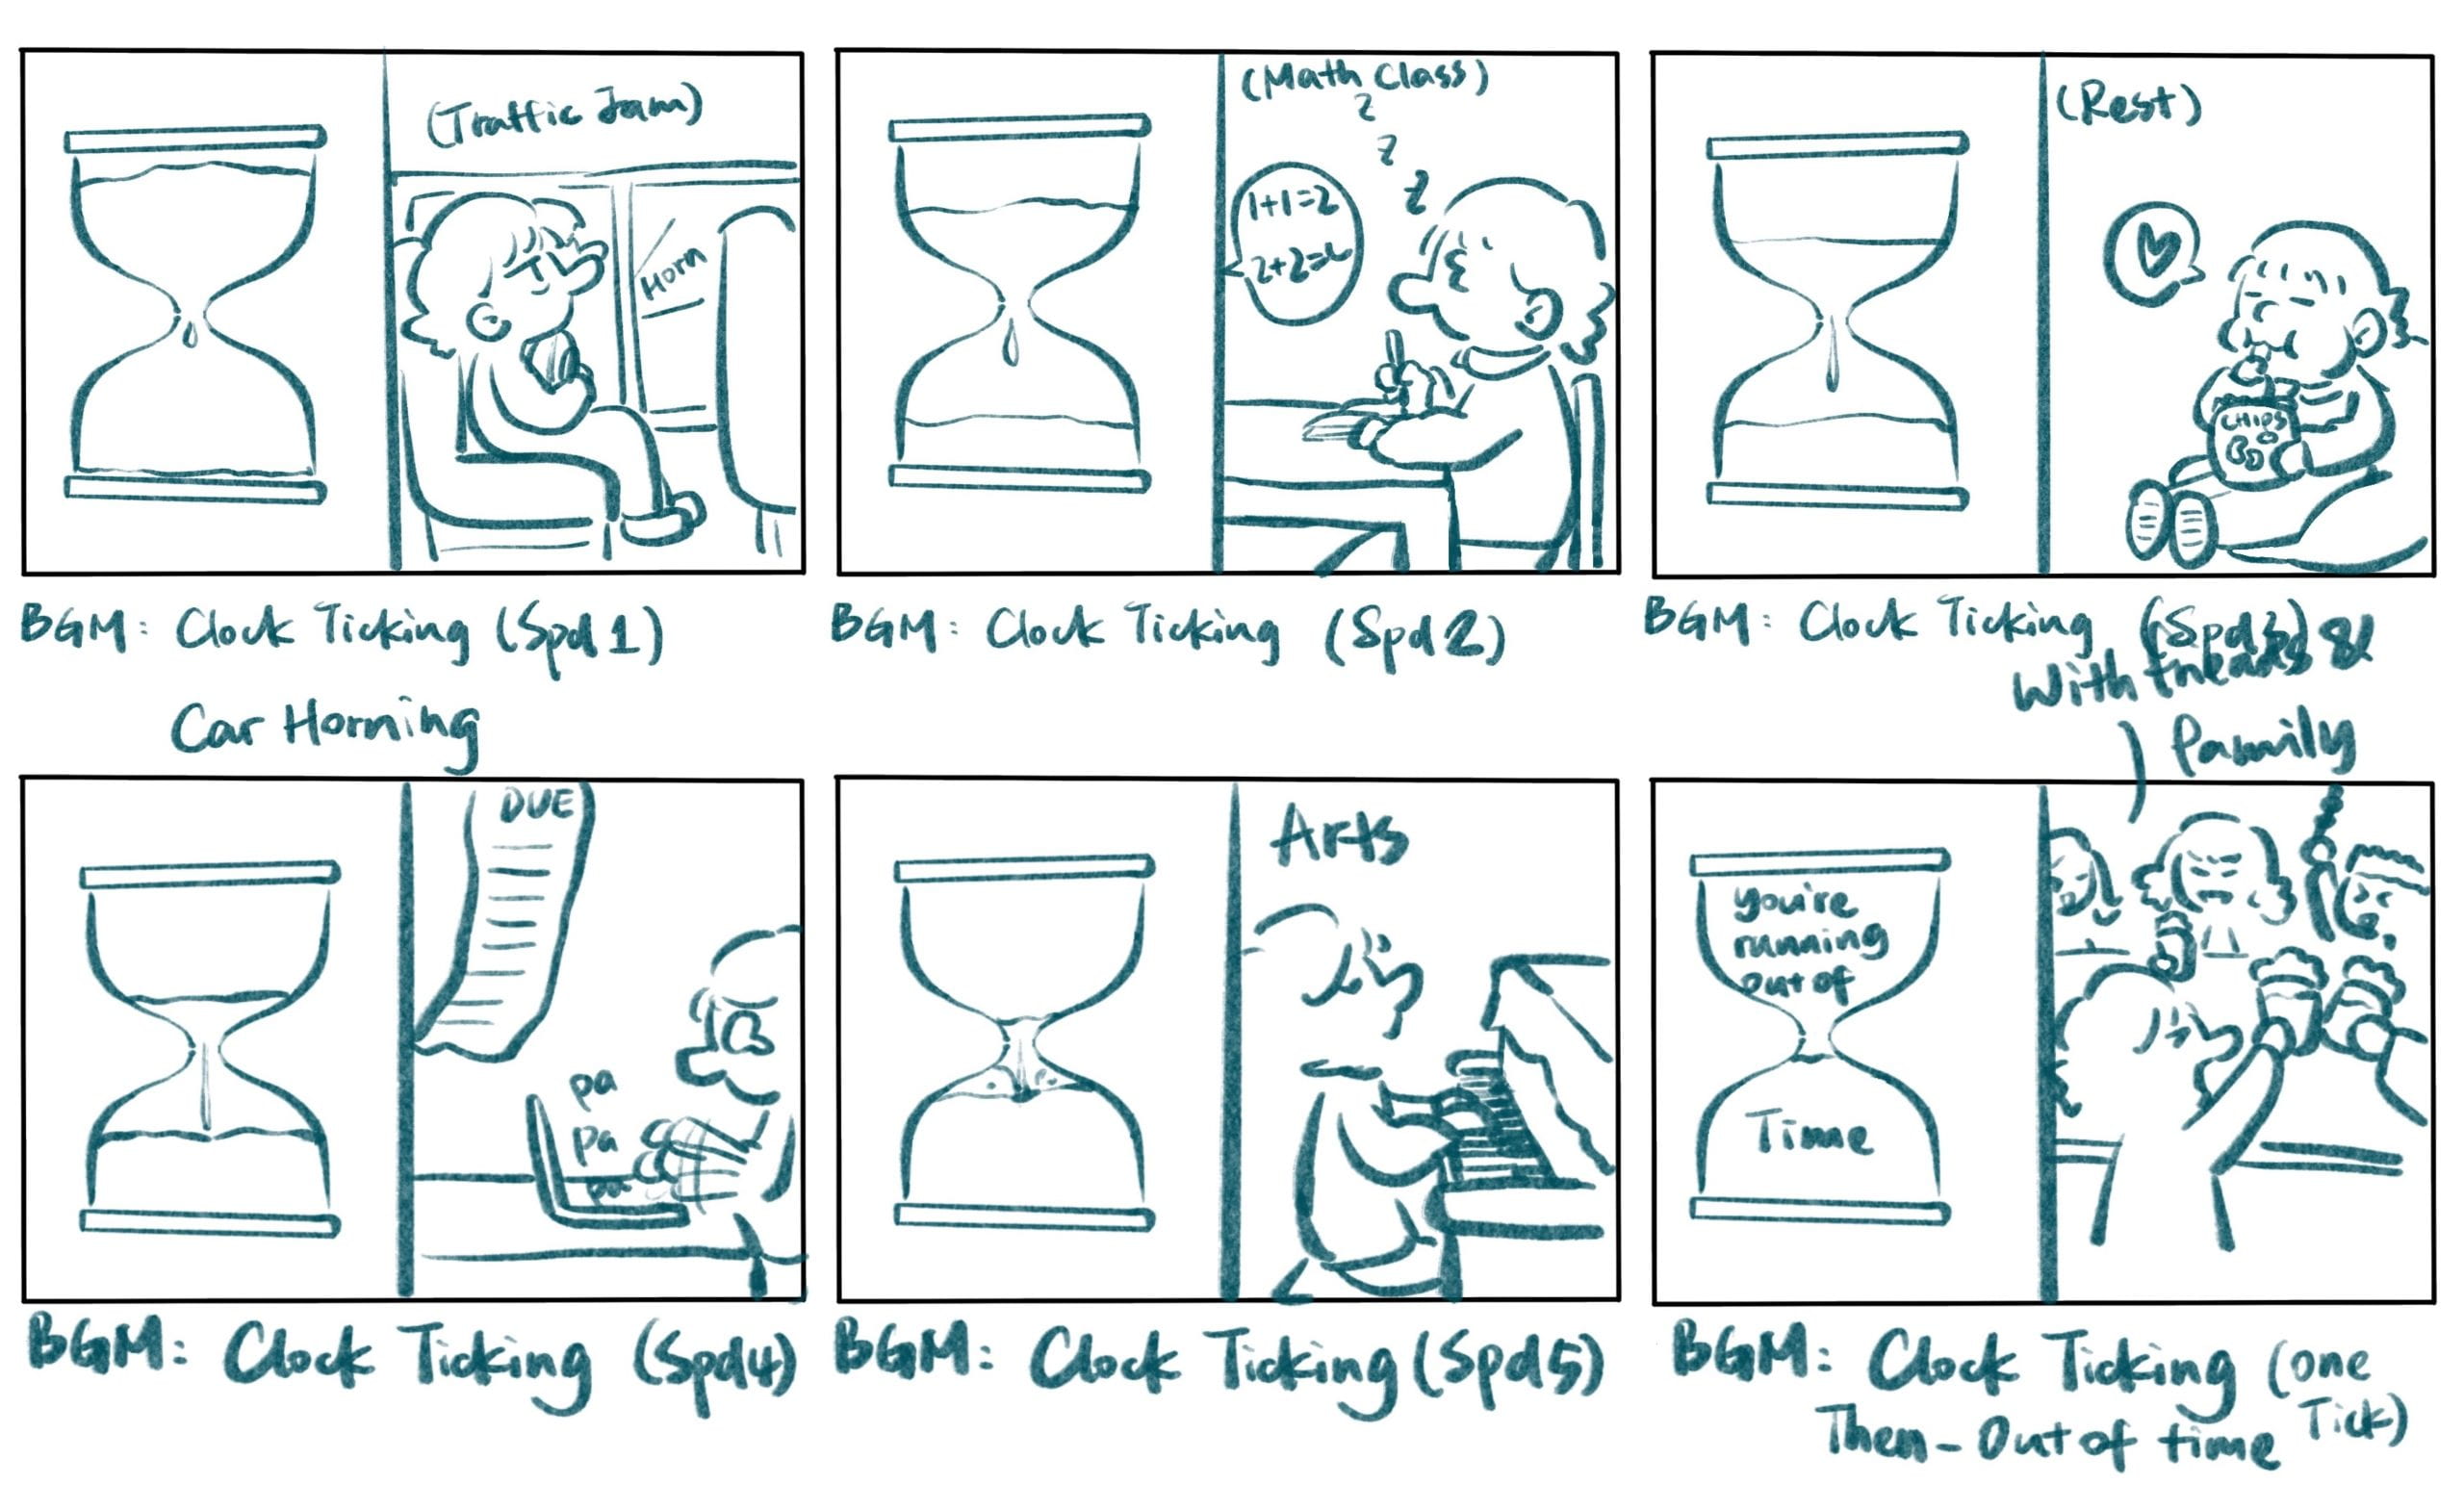
At first, I wanted to visualize my own time based on my time tracking. I also intended to juxtapose the hourglass with the comics and animate them respectively. I also want to combine the project with narrative elements at the end to convey my messages. My initial storyboards look like this:
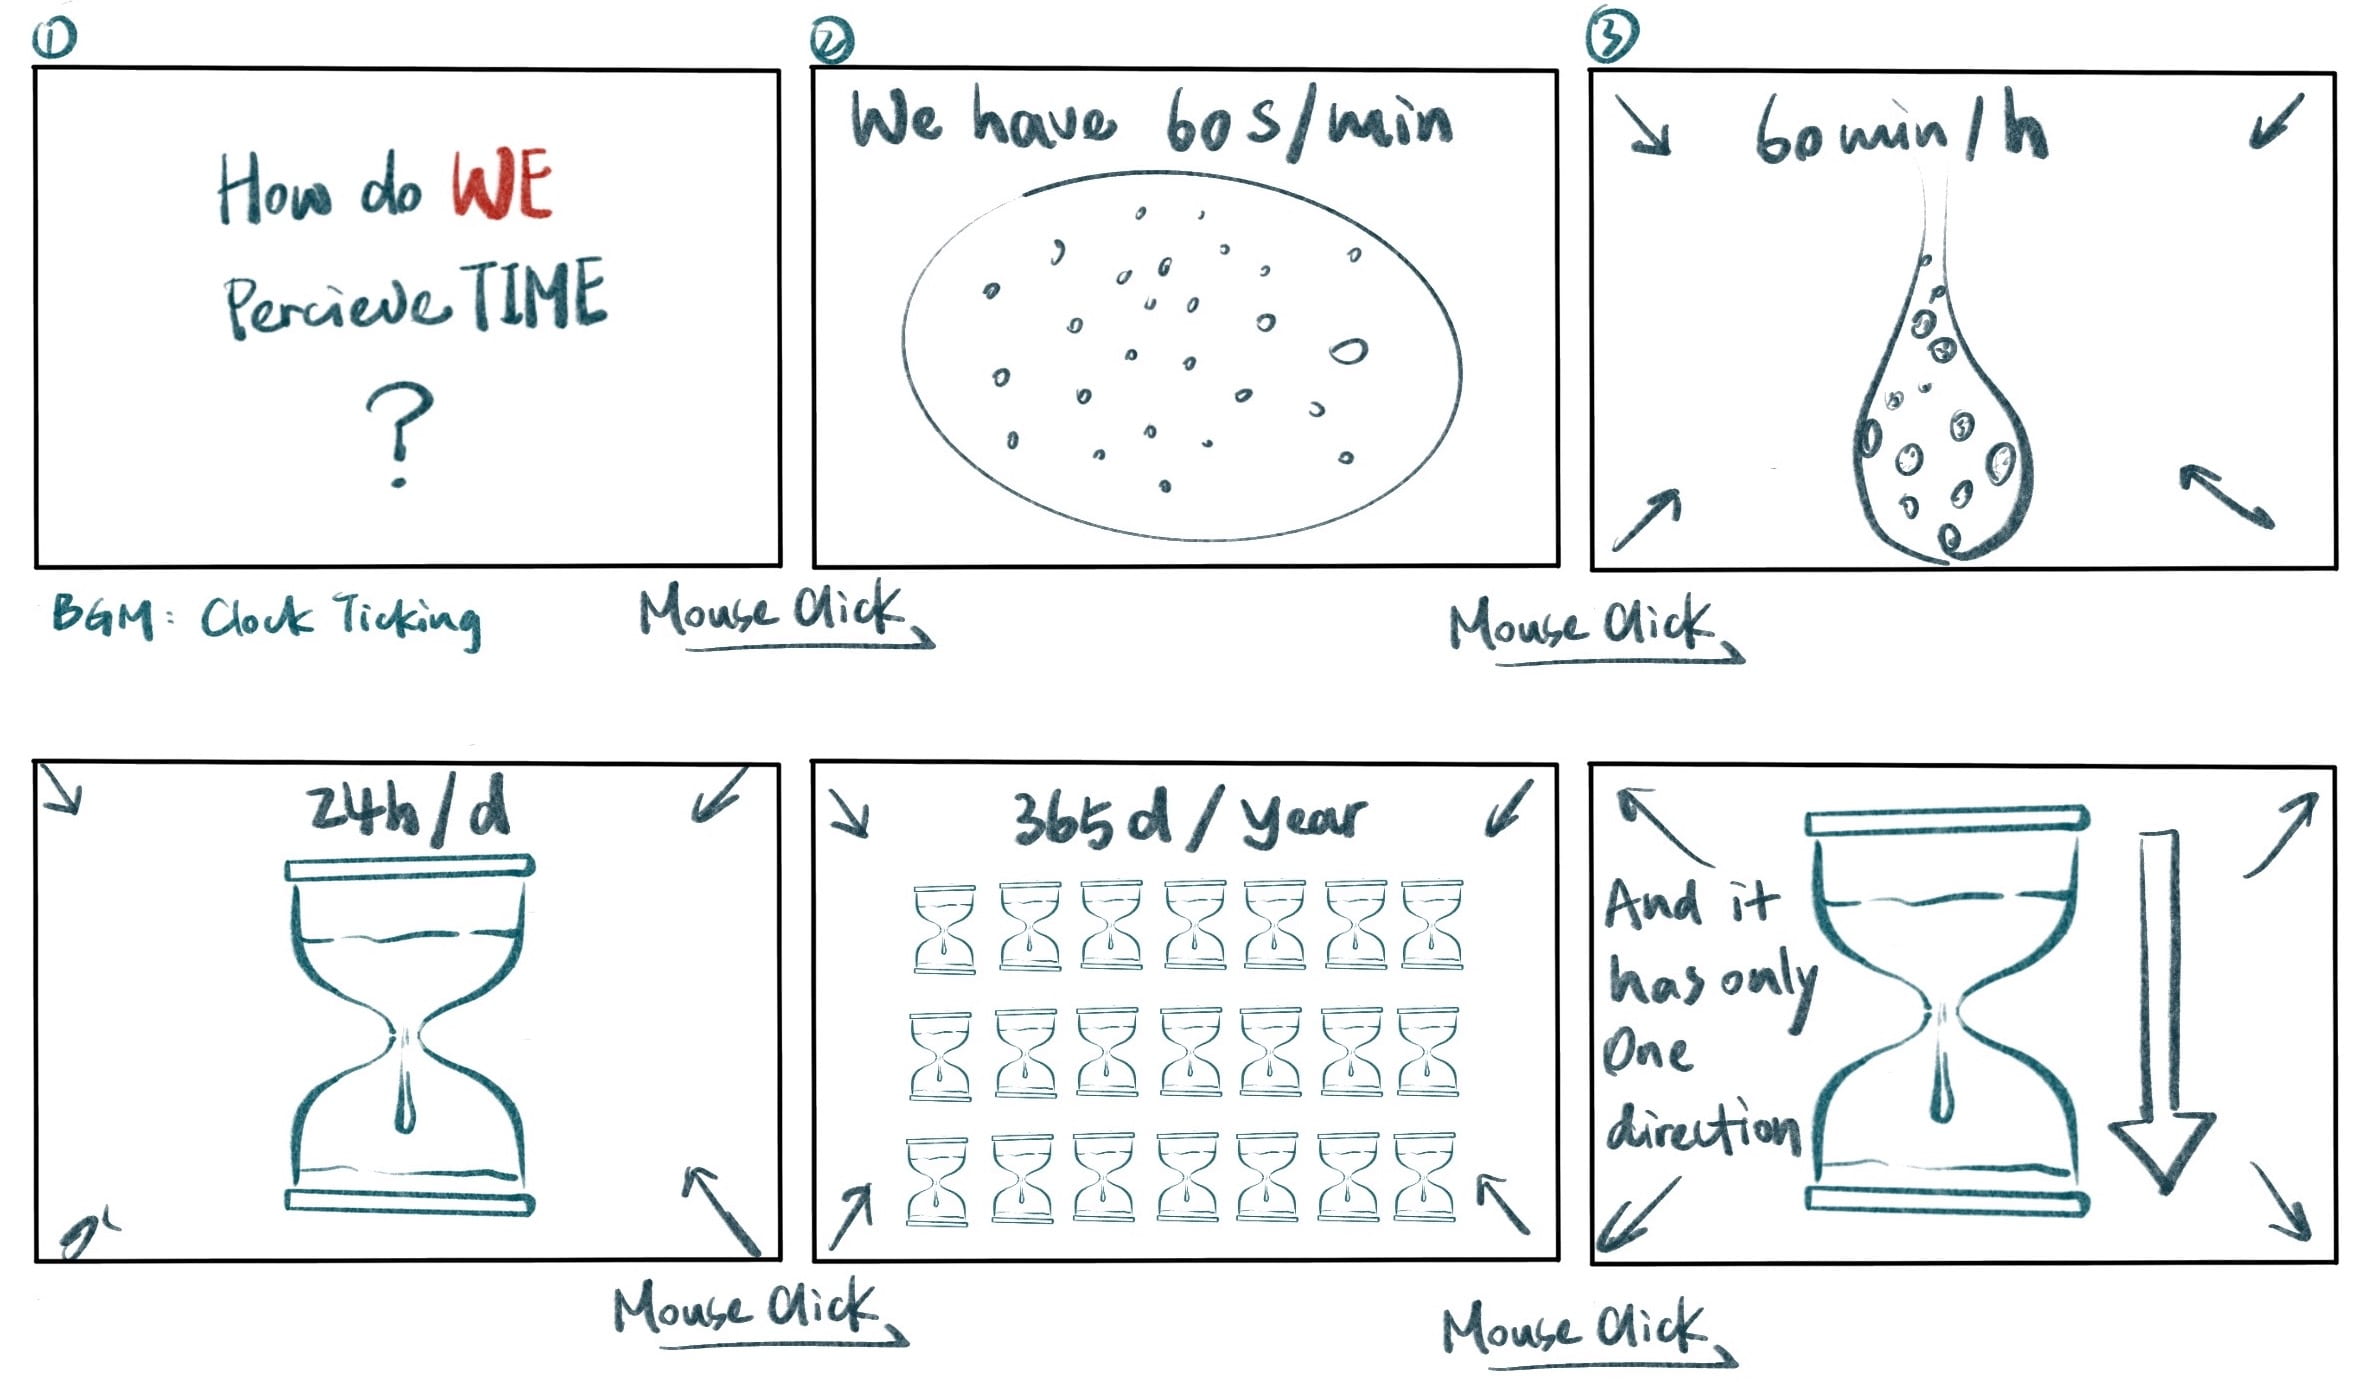
Professor Moon suggested I let users input their time so that they can be more engaged in the project. So I developed my second generation of storyboards:
I also developed a stretch goal: visualize the different perceptions between species (details can be viewed in 11.R inspiration webpage).
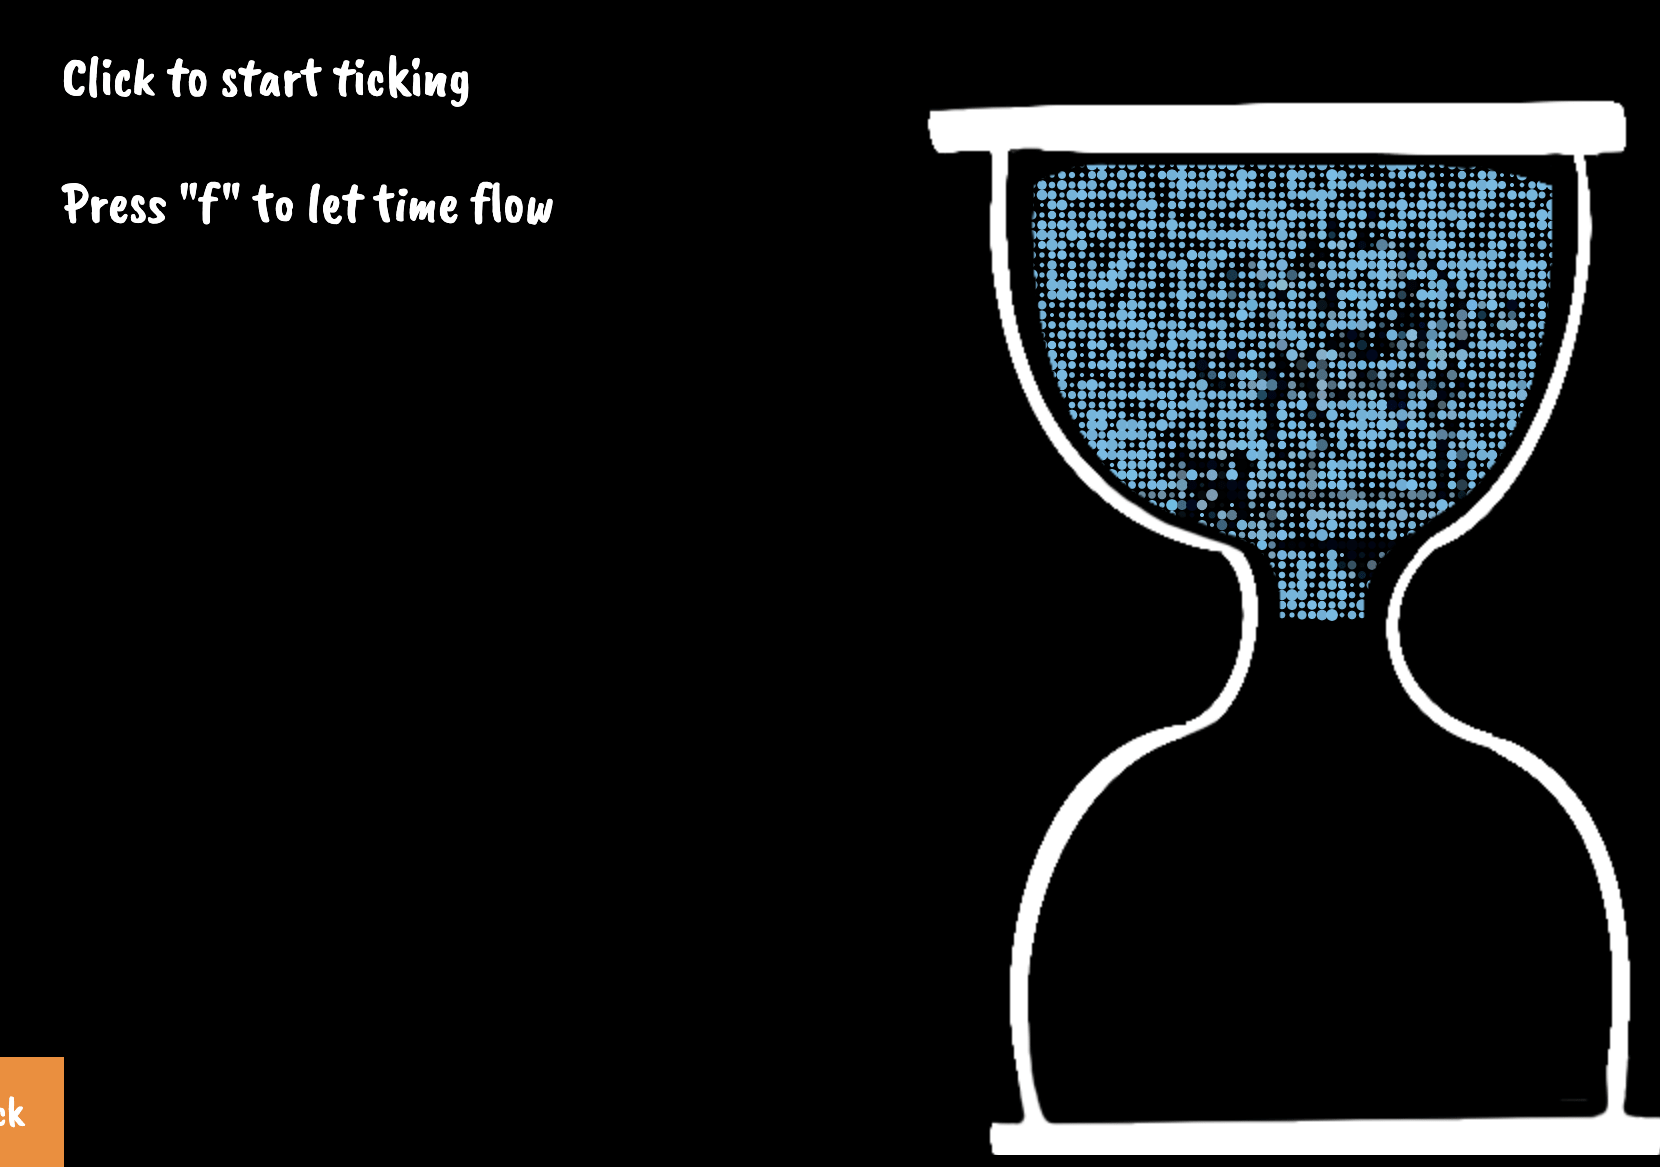
However, when building the project, I found that scaling the images greatly reduced the image quality and slowed down the speed. So I abandoned the intro scene that had a lot of zoom-ins and zoom-outs. Meanwhile, Moon also suggests I put the comics behind the hourglass and only animate the sands because animating both would slow down the processing speed and comics can hardly be animated as I wished. Inspired by my Week 9 recitation, I decided to pixelate the comics and make them into sands that fall down at different speeds.
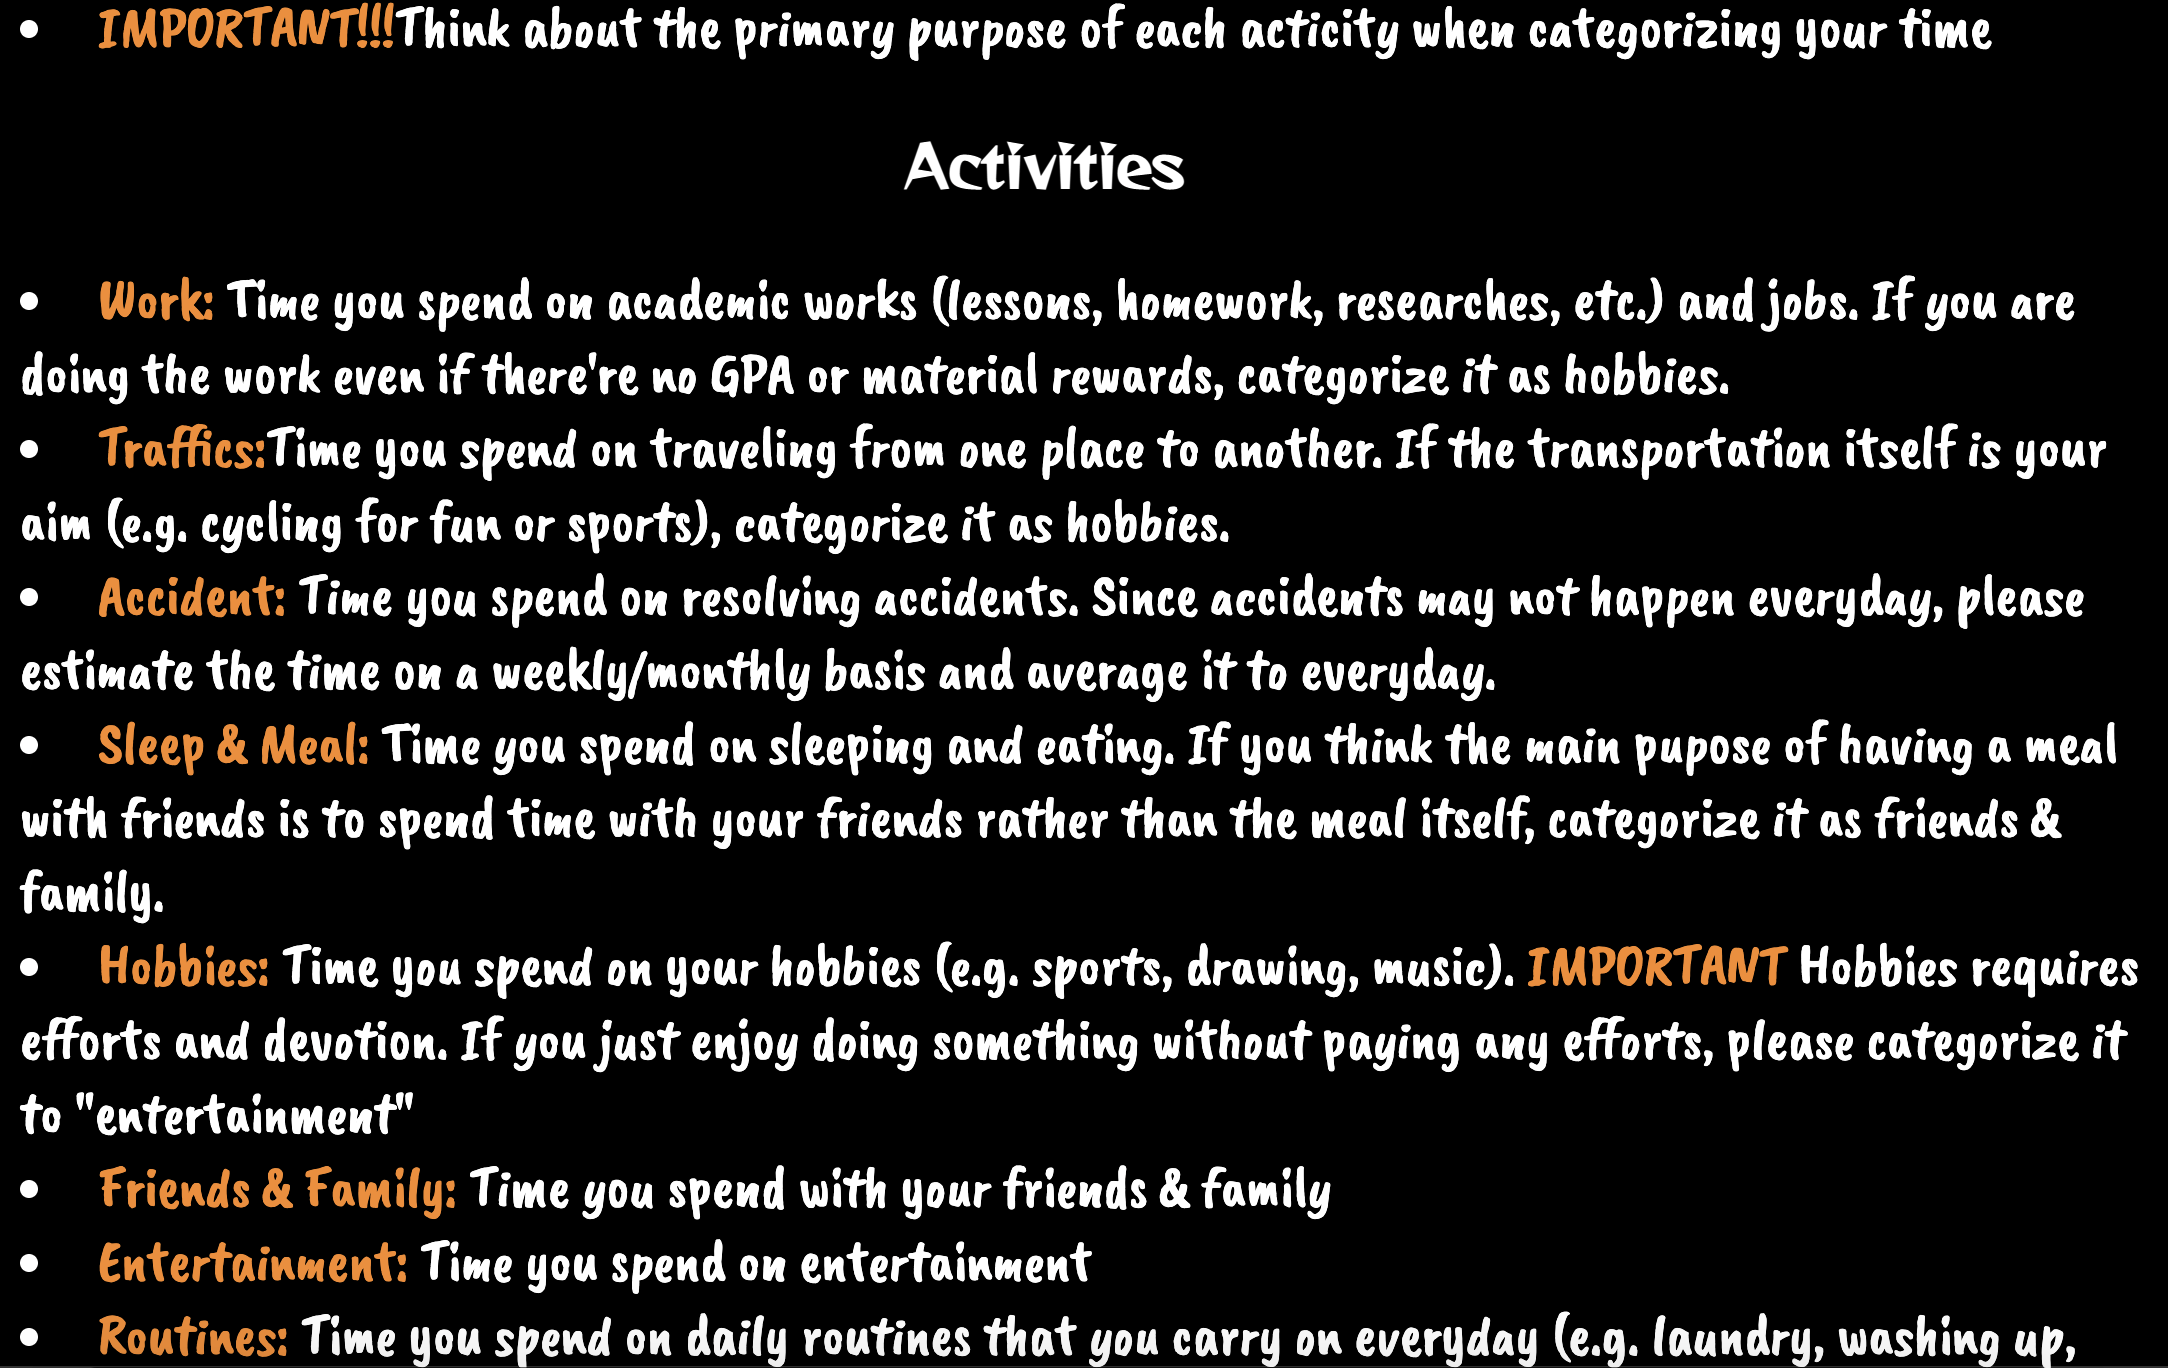
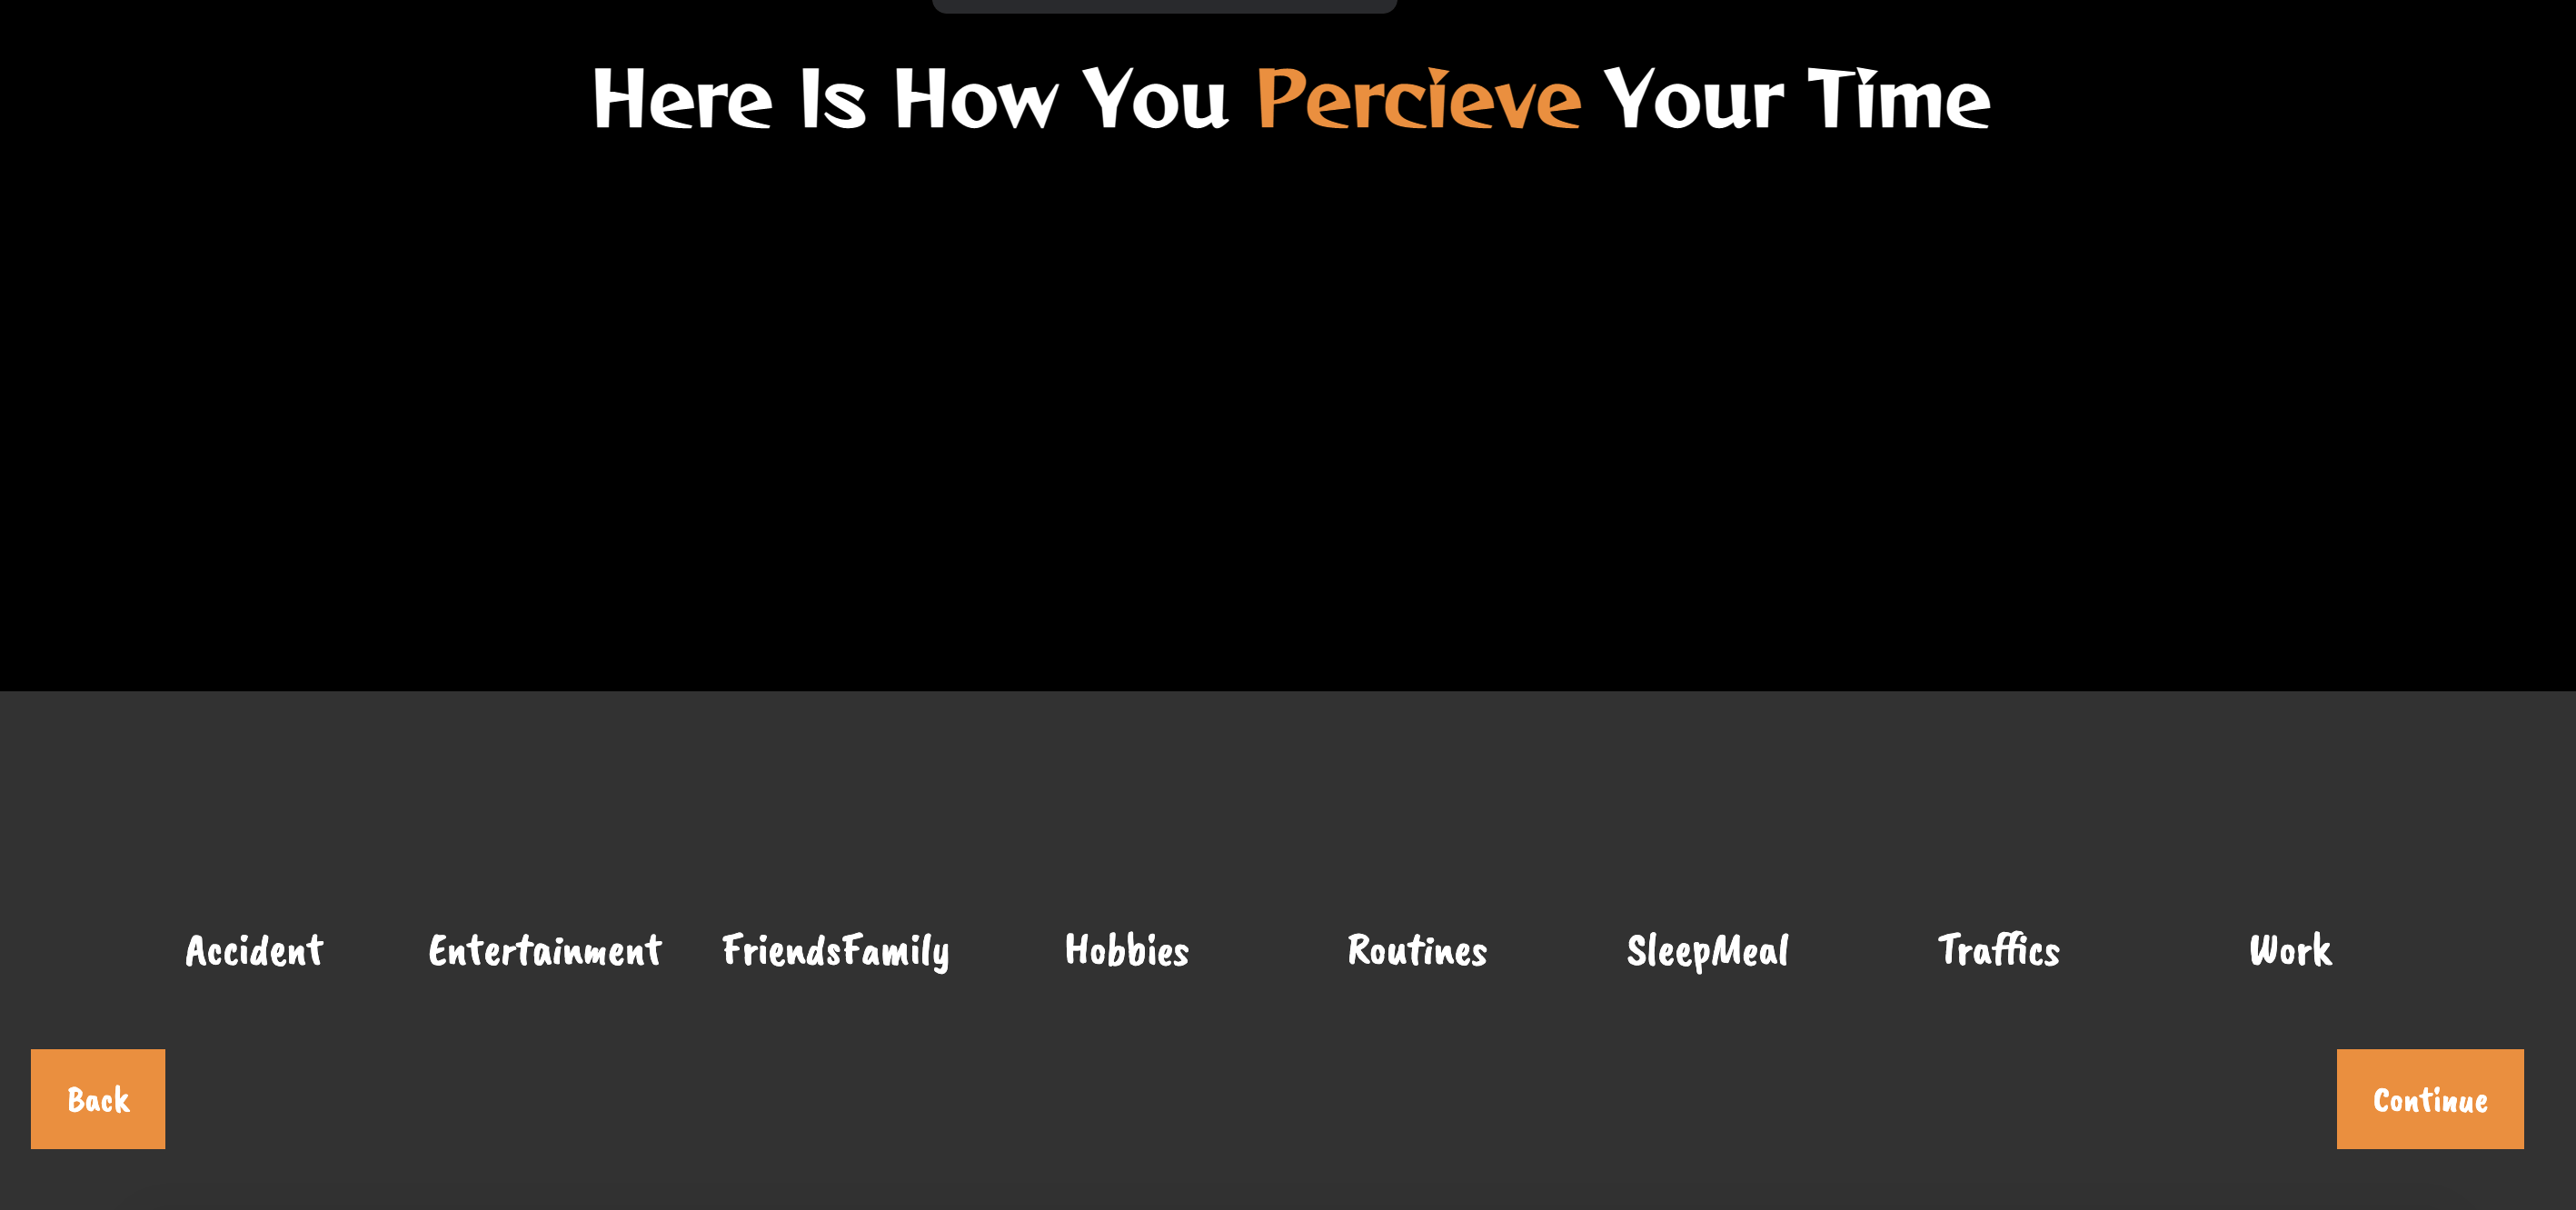
I struggled with categorizing the daily activities at the beginning. I felt that my categorization could be biased and limited since my daily events can be different from others. I also worried that if I have too many categories, the workload would be huge, both for me and for the users. Eventually, I categorized the activities into 8 categories and used an instruction page to show users how to categorize their personal activities into these categories.
Also, I change the stretch goal: I want to let users further categorize the 8 categories into four: 1) Instant-happy time, 2) Productive time, 3) Meaningful time, and 4) Unavoidable time. Accordingly, I will then encourage users to rethink in each category 1) how the time may prevent one from achieving long-term happiness, 2) how the time can be used more efficiently, 3) do we spend enough time on this category and how can we make time for it, and 4) how to change the attitude and make the time that you perceived as wasted meaningful.
List of techniques and equipment
Software and Platform: Procreate, Adobe Audition 2020, Firebase, Glitch
Main Techniques: Pixel manipulation, real-time database (Firebase), time sequencing.
Fabrication
1. Freezing the sand volume
In Week 12 Recitation, I created hourglasses using for loop in the functions. I found that it hard to freeze the sand volume and the method is very inefficient. I reconstruct the hourglasses using OOP.
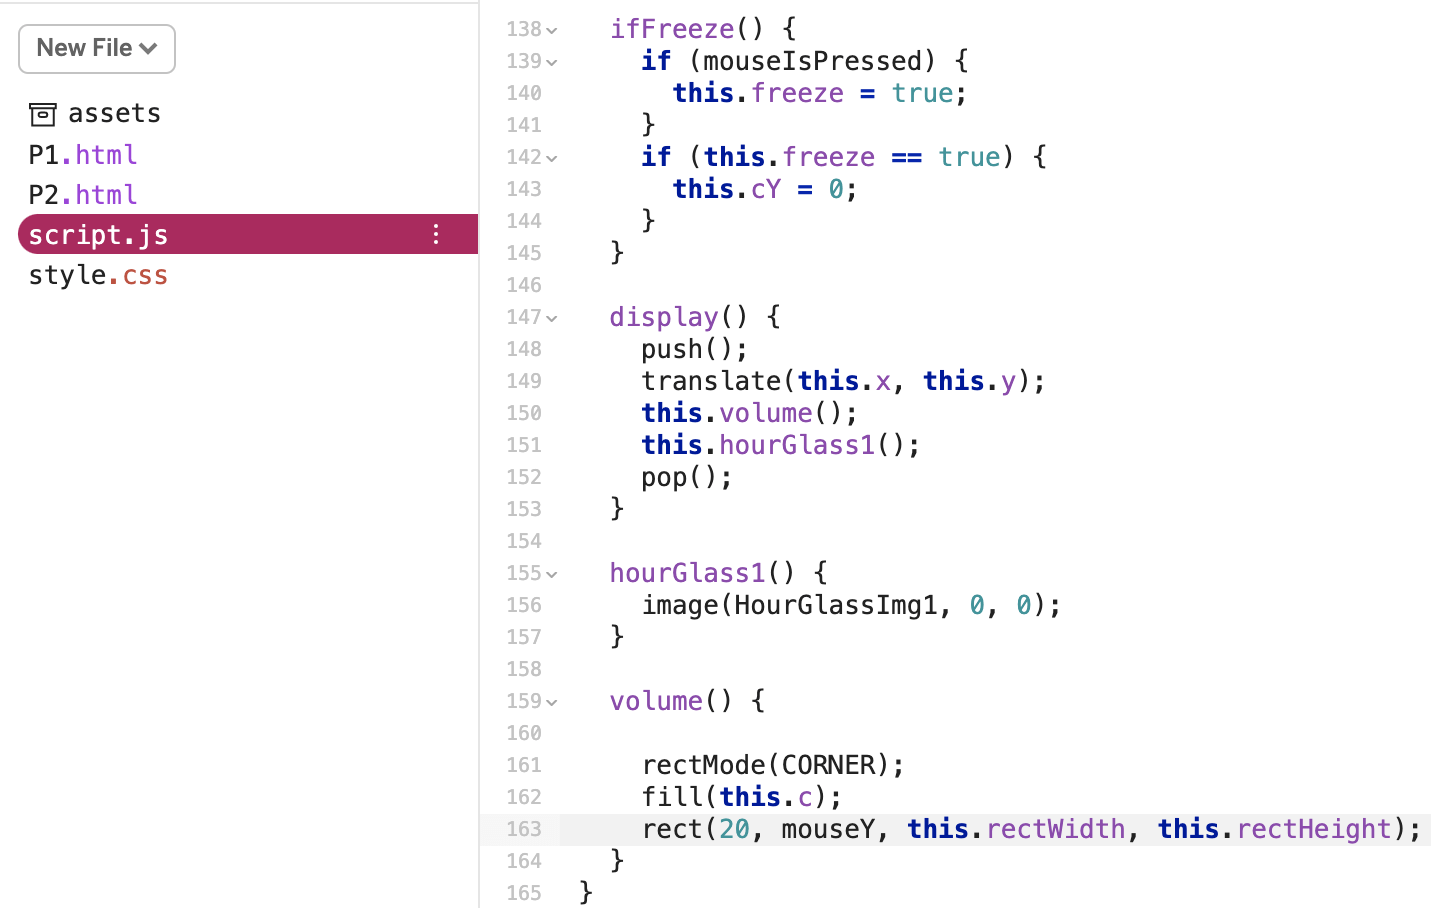
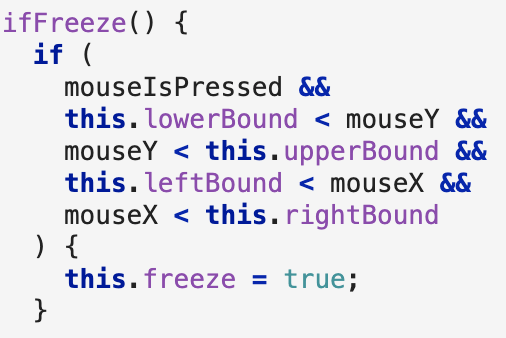
I use an ifFreeze() function to determine when the this.freeze will become true:
Add number:
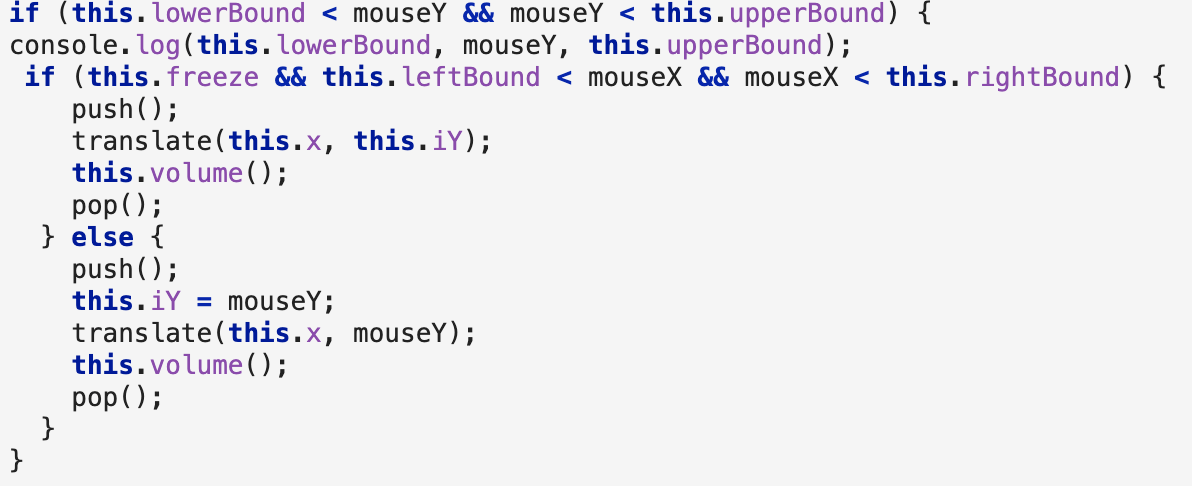
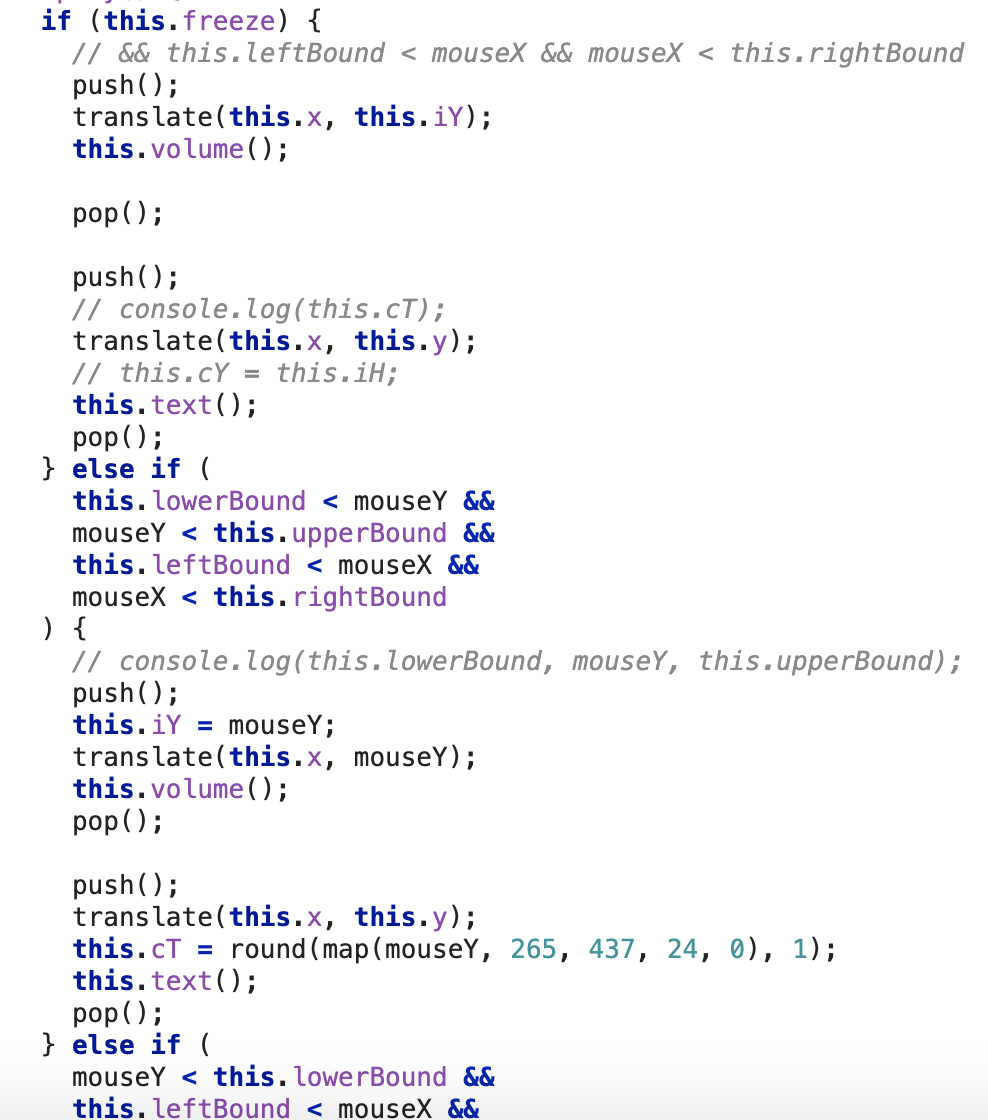
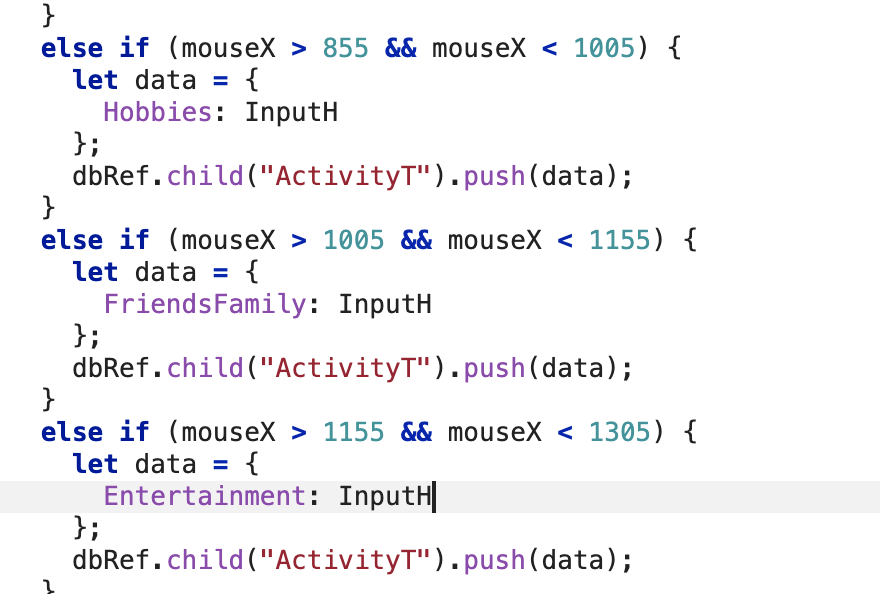
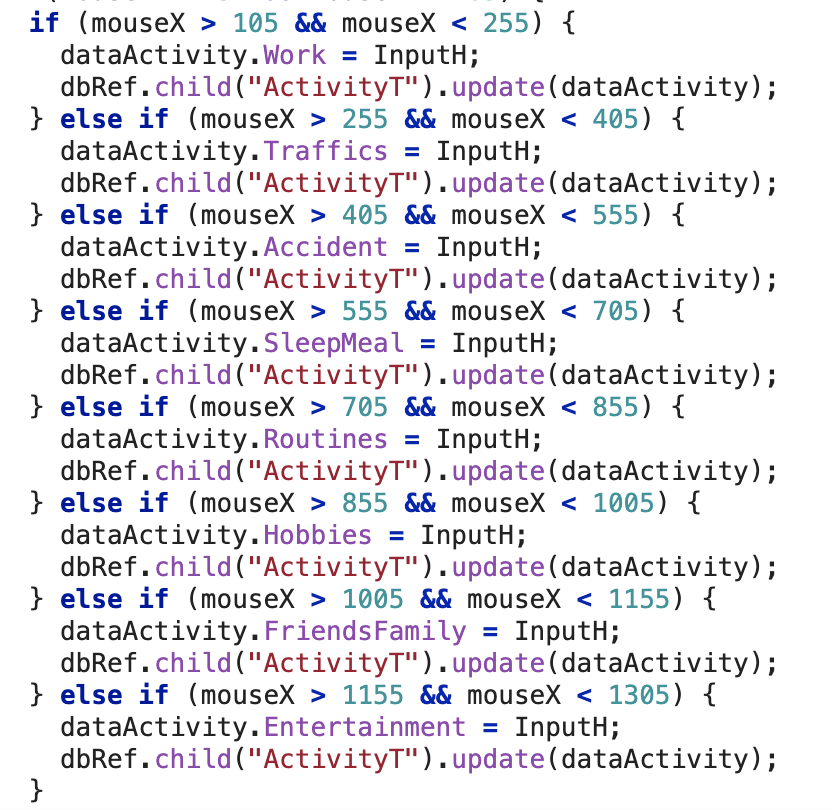
Then I define four boundaries to make the interactions happen only in the interacted hourglass:
2. Hourglass animation
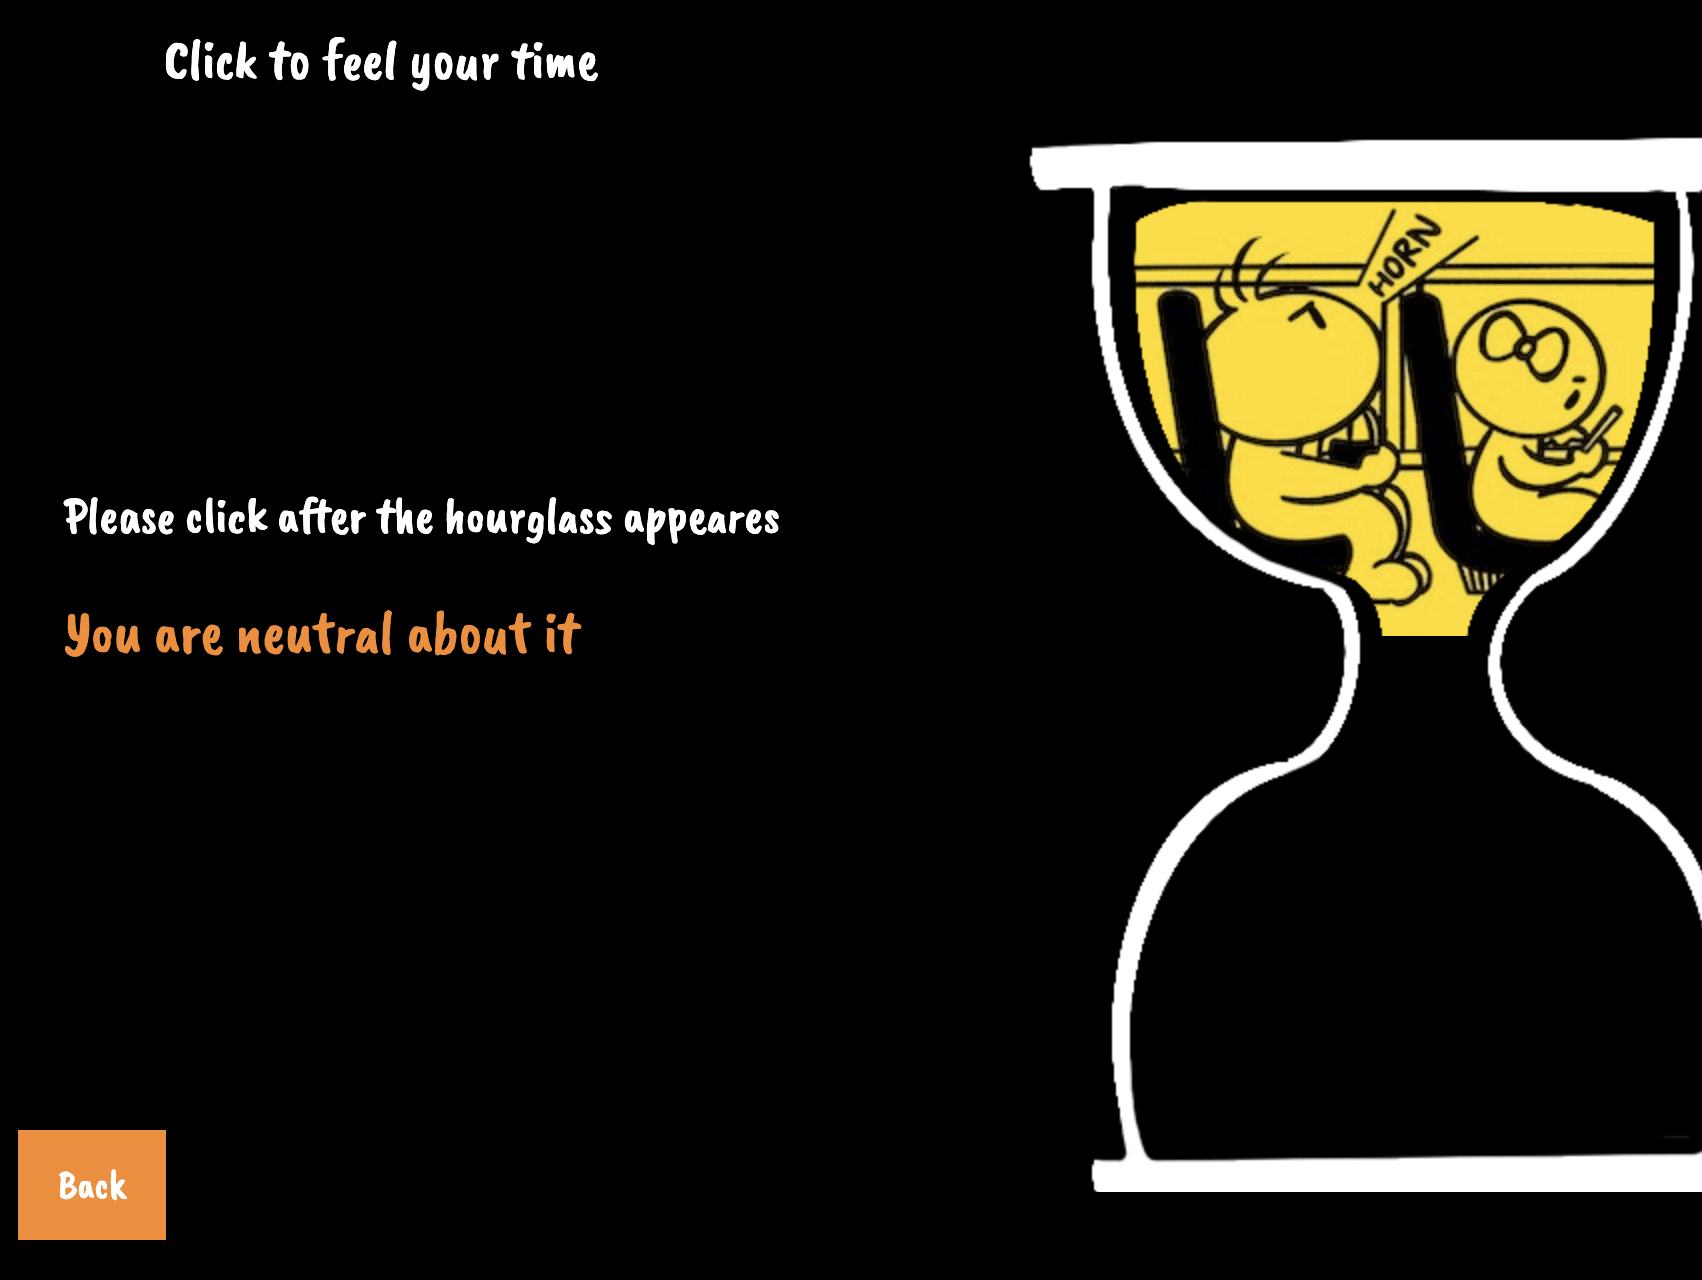
I drew eight comics that represent the activities in procreate.
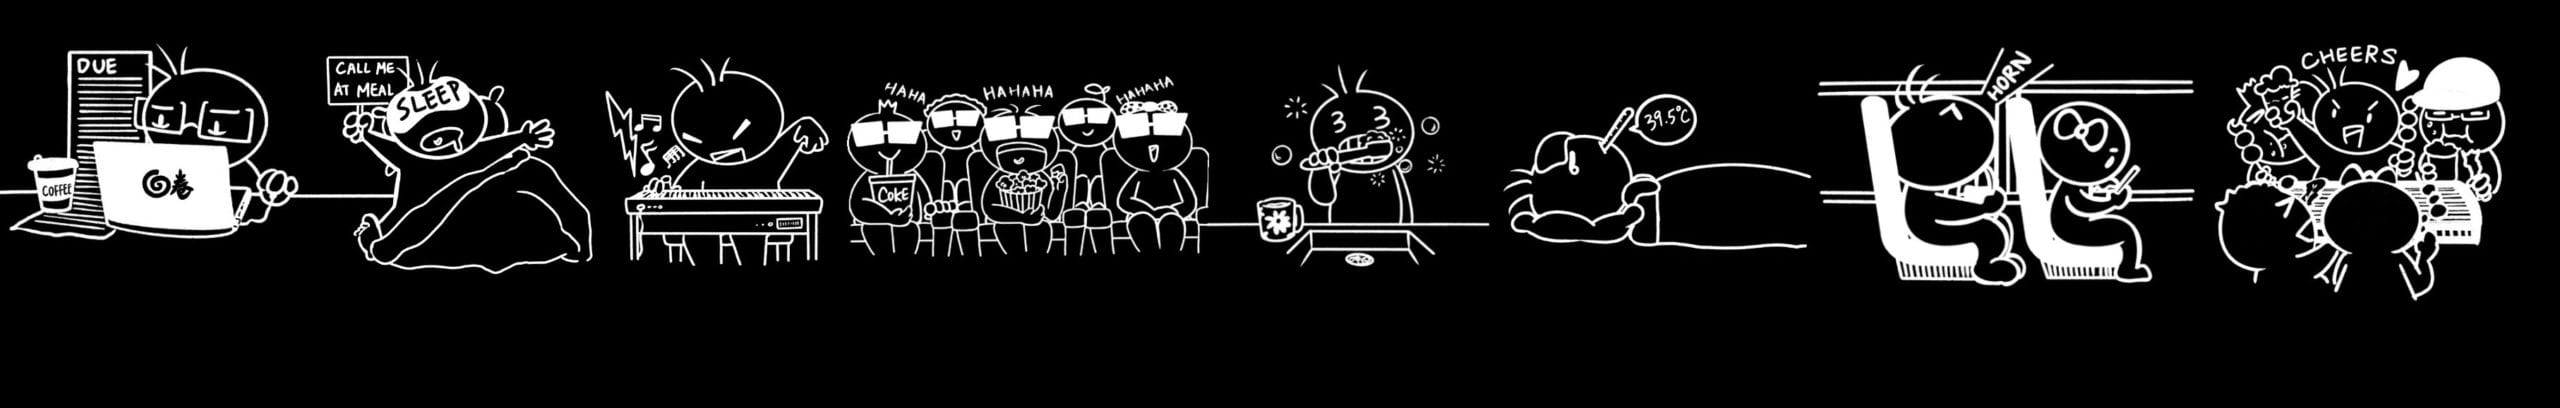
I used the sand color of each activity (assigned in pg2) as the background colors for the corresponding comics.
I changed the sketch’s color to black in procreate since the visual was not clear and satisfying.
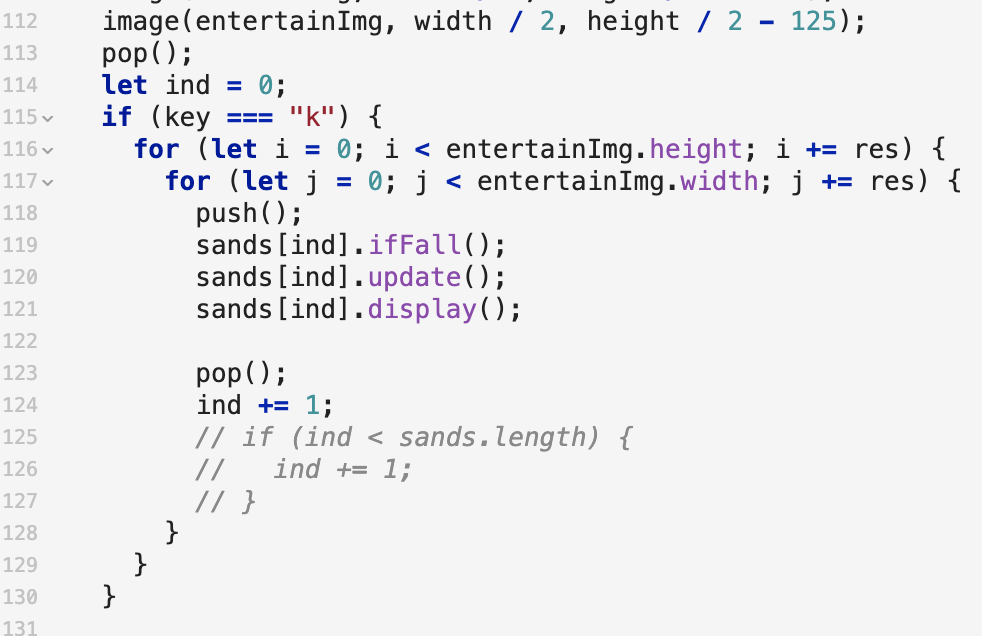
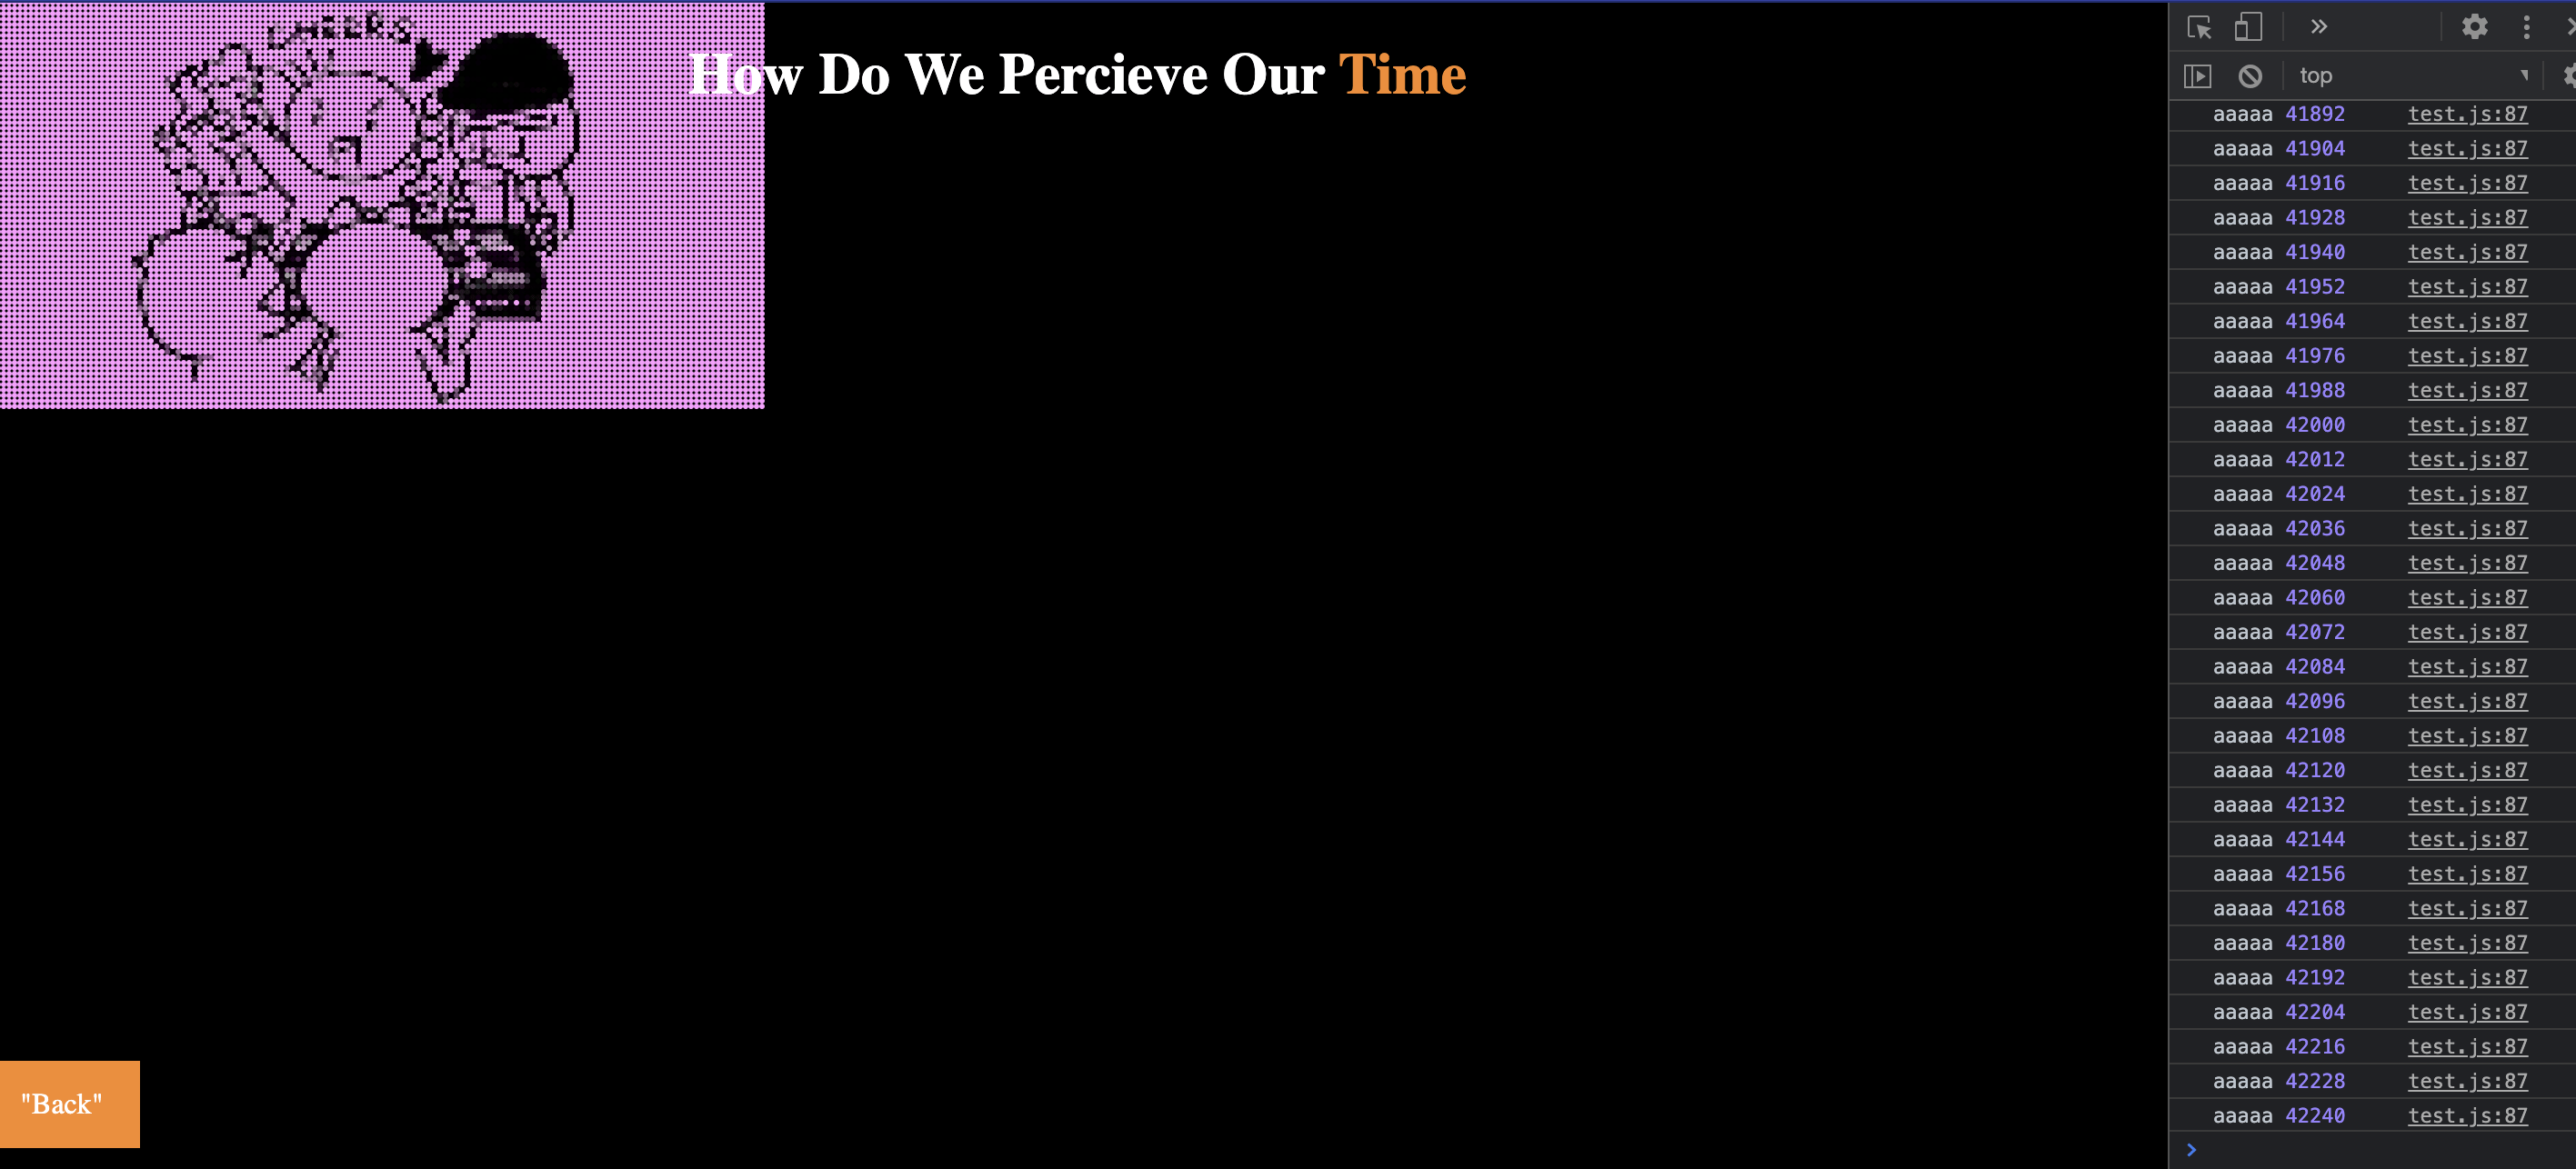
Then I tried to pixelated the image and make the pixels into particles that fall at different speeds. However, an error message appeared saying that the iteration is out of bounce.
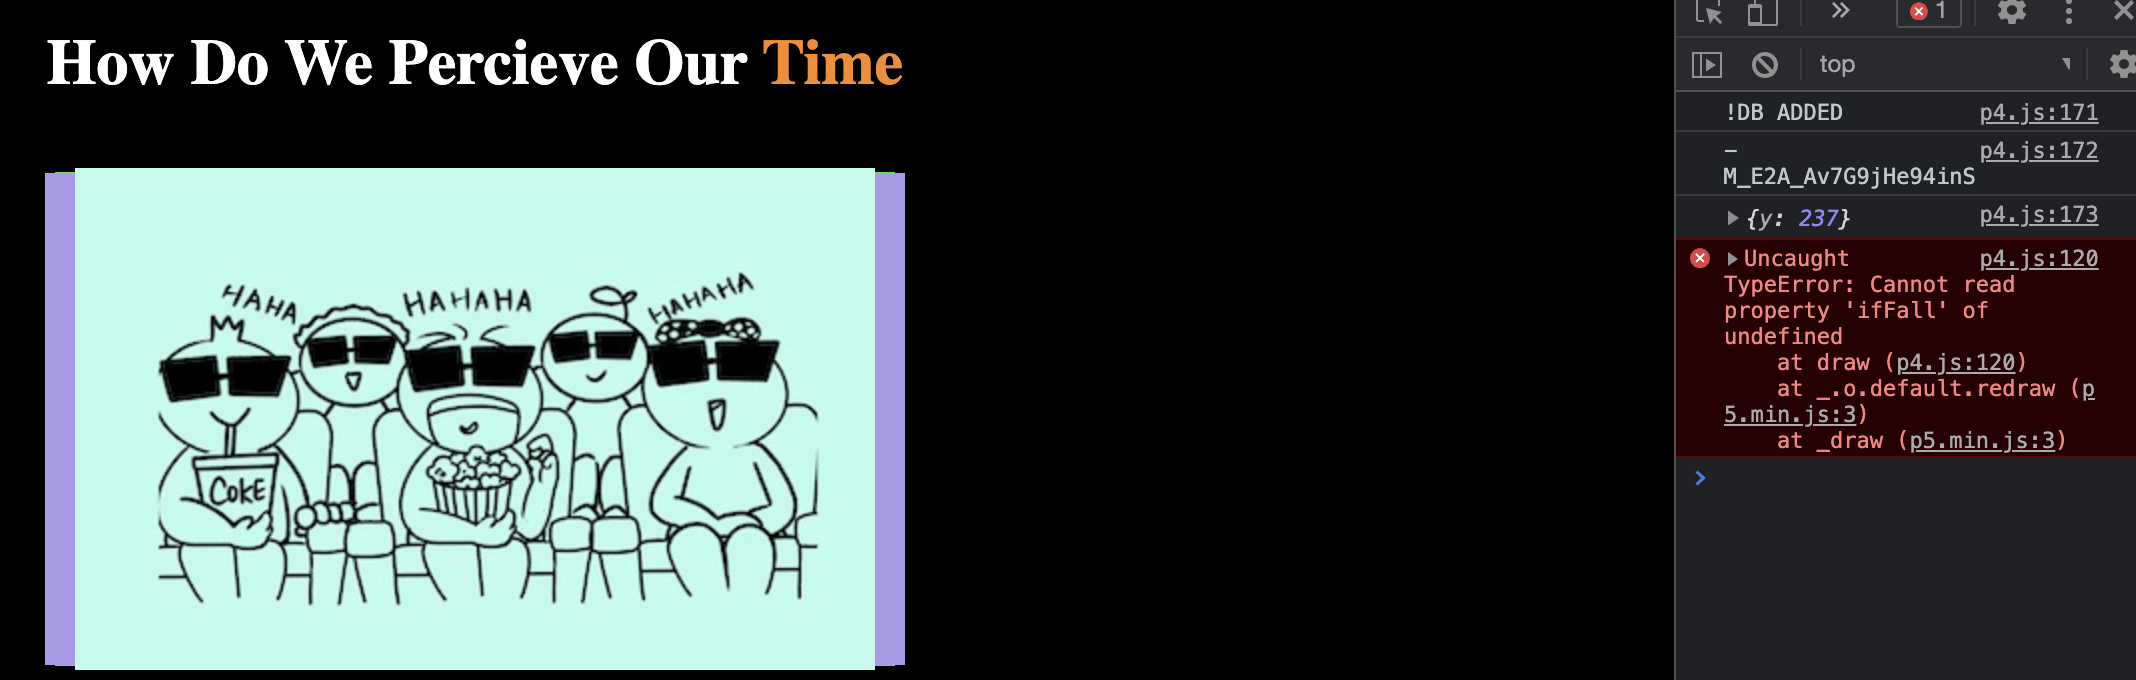
Several attempts to debug:
- Print out the length of the sands array:
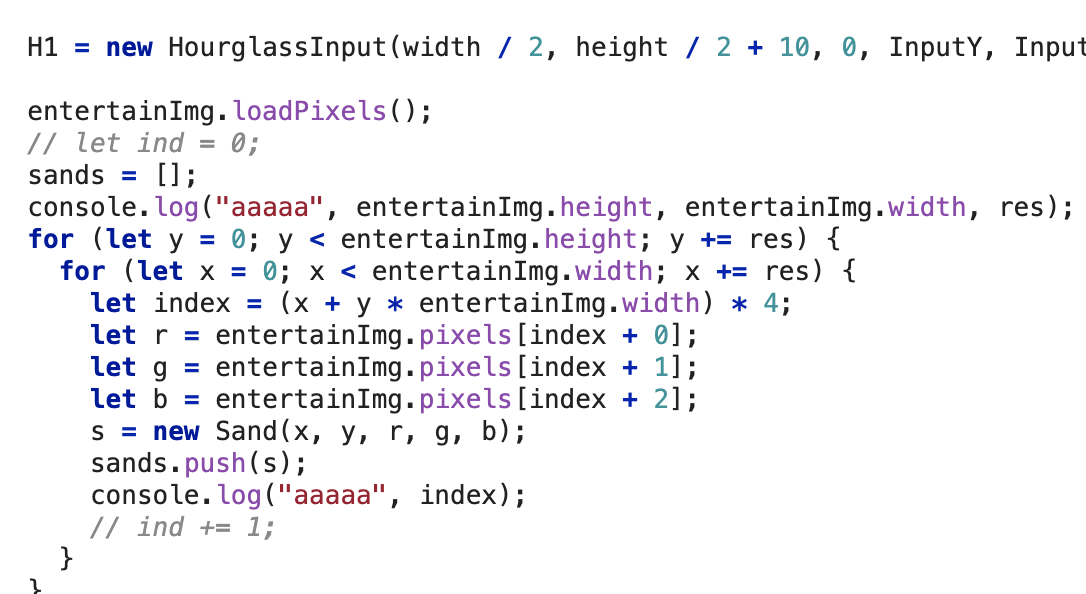
- Console.log the picture’s height and width:
![]()
I spent a long time debugging here and used console.log to print out elements that may cause the problem. And Hammond helped a lot at this point (for where I should put the console.log). I found that the image.length returns 0, which means that the image was not loaded correctly. It turned out that I didn’t load the image in a preload function (I deleted the preload function because it didn’t work for the local text editor for some reasons, and when I copied the code from the local file to the online editor, I forgot to add the preload function back). After fixing the bug:
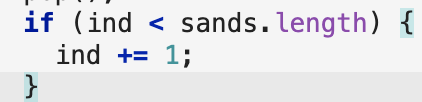
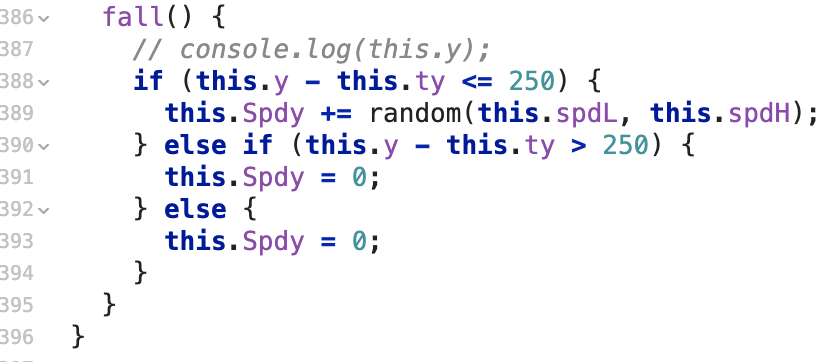
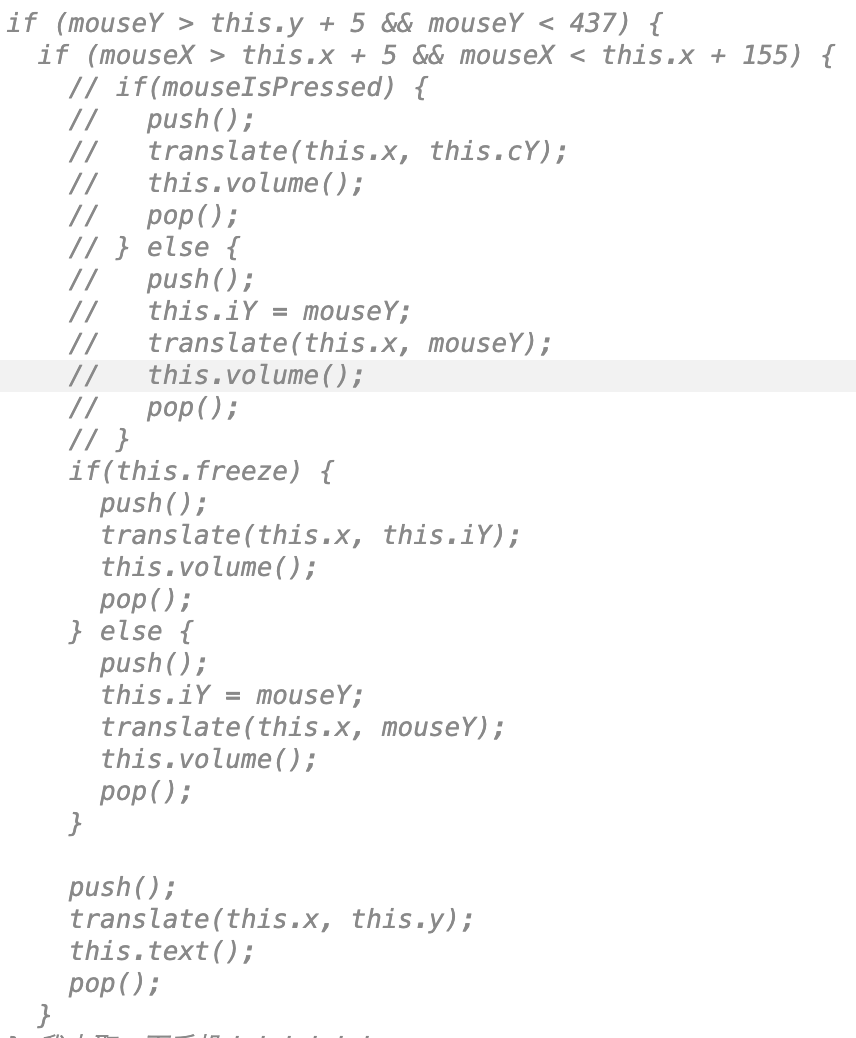
I used an if statement to make the sand stop but failed:
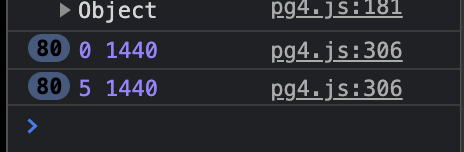
I console.log the “this.y” and found that it only changed 80 times and then the code wouldn’t be executed any more. Later I found that it was because I used “windowWidth” for “windowHeight”. Also, the sands of each hourglass would stop at the same height if I use a constant as boundary (if(this.y<250)), which made the remaining look like a line. So I created “this.ty” to record the starting point of each sand and let them stop at their relative position:
In this way, the remainings still have the same height and volume as before.
3. Record the user input data and reuse them on different web pages
During the meeting with Professor Moon, I asked about how to store user input data and then utilize it on different web pages (If I store them in a list, they can only be utilized on one webpage). Professor Moon recommended the real-time database of Firebase. With his help, I set up the Firebase account for my project and linked the database to my HTML files.
During storing and using data, I met several problems:
1) Cannot write data in an organized way
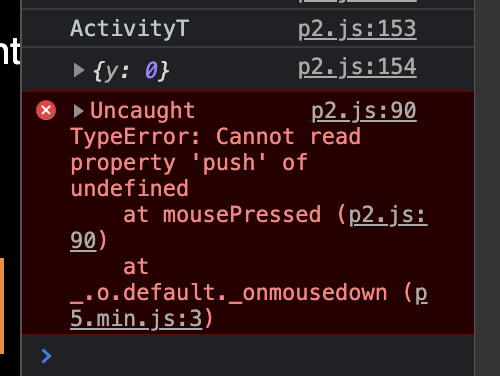
At first, I used the push function to write data into the firebase.
I got error messages like this:
After solving the problem:
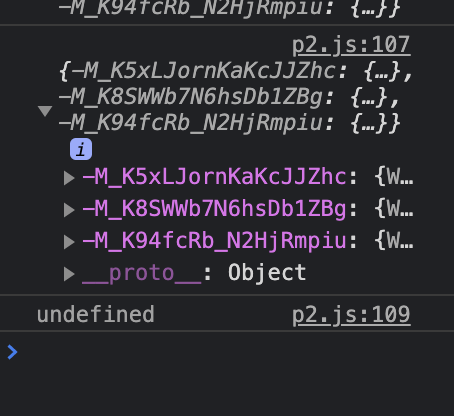
And my data looks like this:
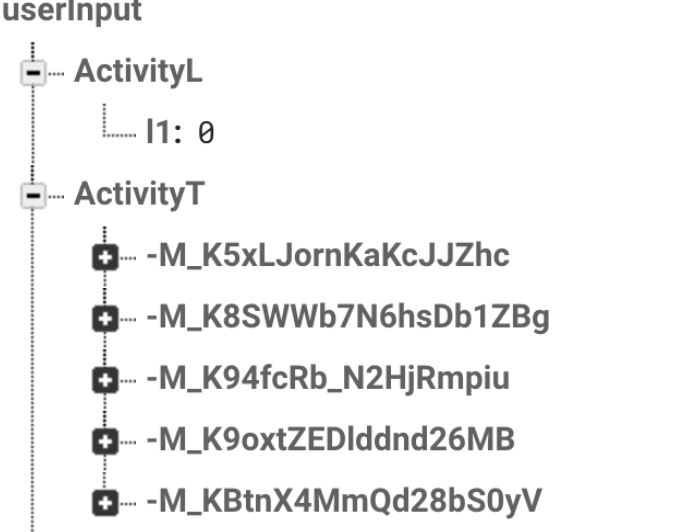
The data were stored with a random ID, which made retrieving the data very complicated.
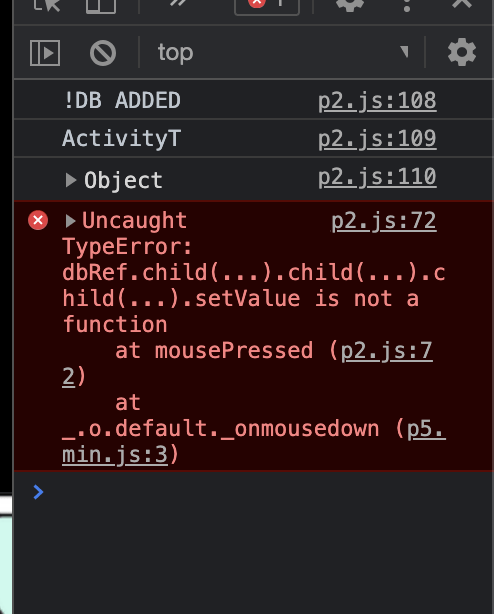
During the meeting, Professor Moon suggested I use the update function to store data with an ID defined by me so that the data will be more organized:
2) Cannot retrieve data from the firebase
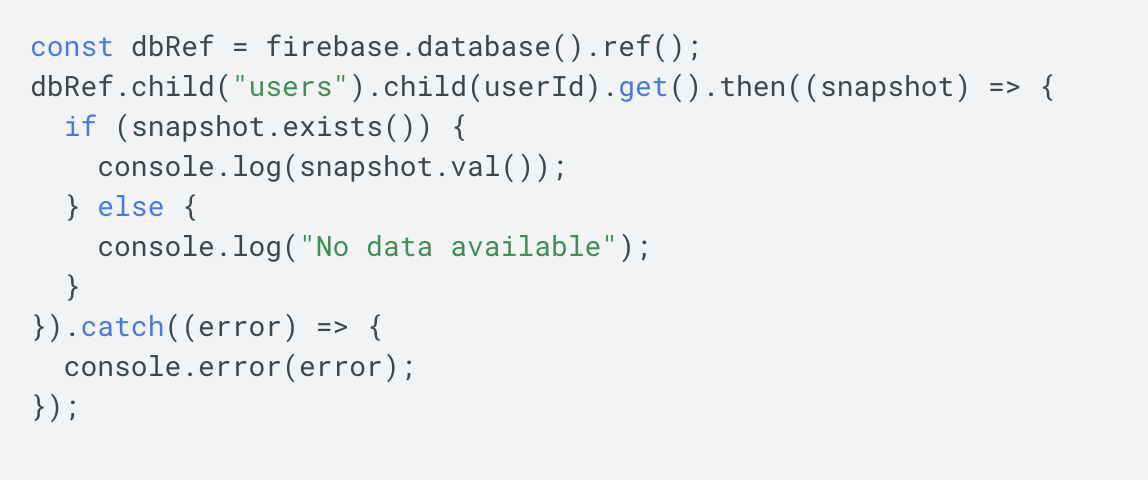
At first, I tried to use this code to retrieve data:
The code was modified from the firebase documentation “read and write data”. I deleted the child(userId) since I didn’t find one.
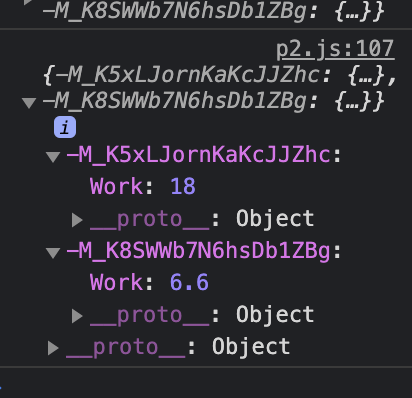
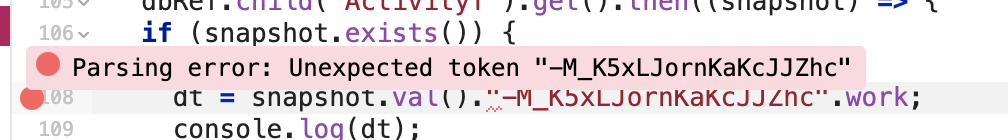
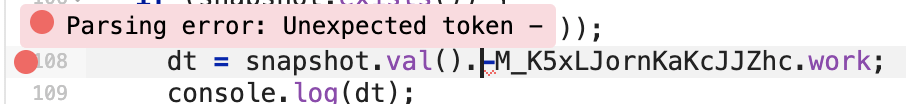
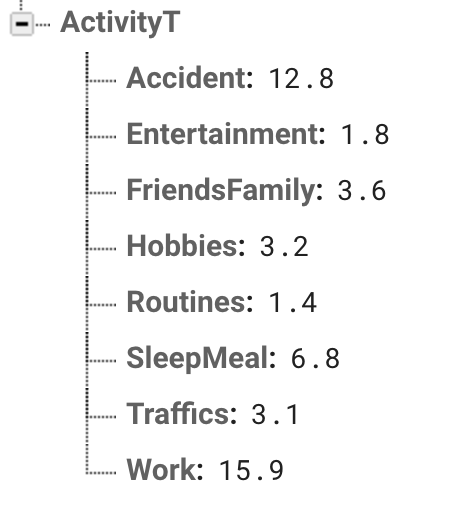
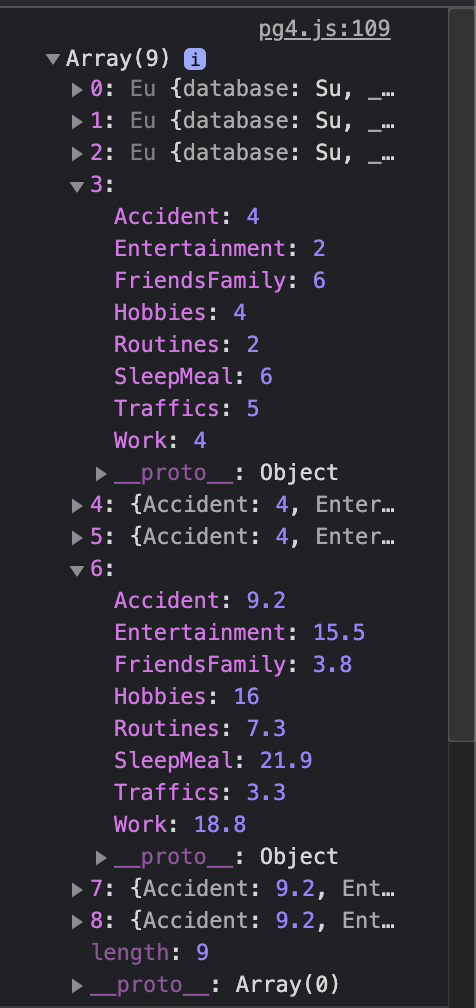
I can see from the console that the snapshot.val() returns the following:
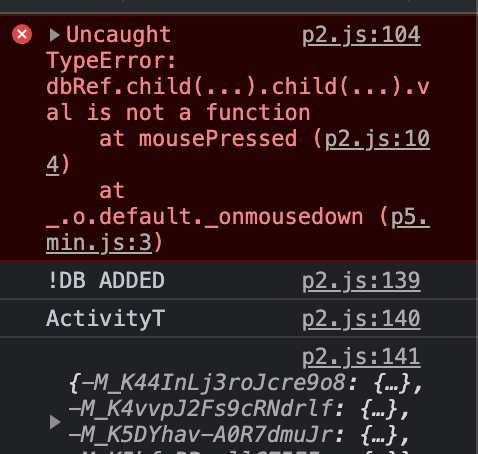
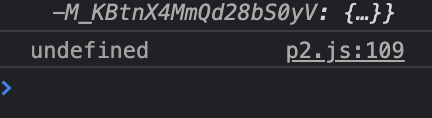
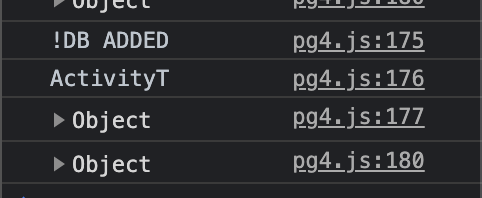
Then, I use dt = snapshot.val().work to get the number. But when I console log the dt, it returns a message saying “undefined”:
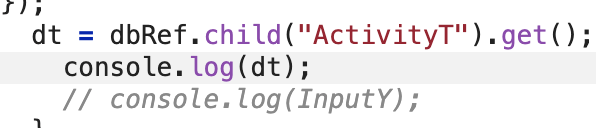
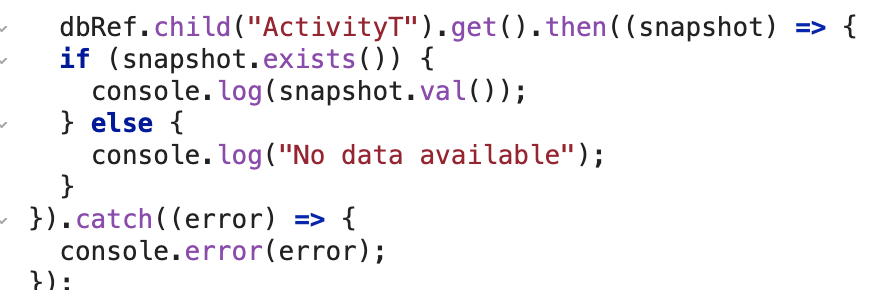
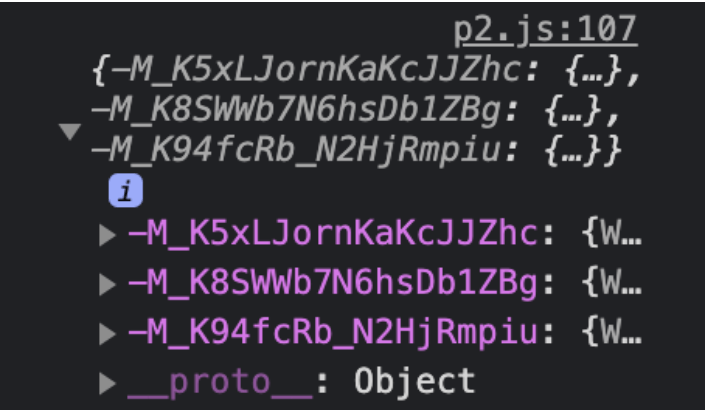
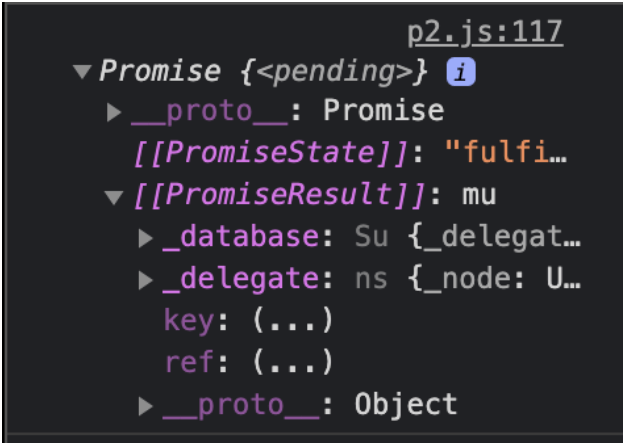
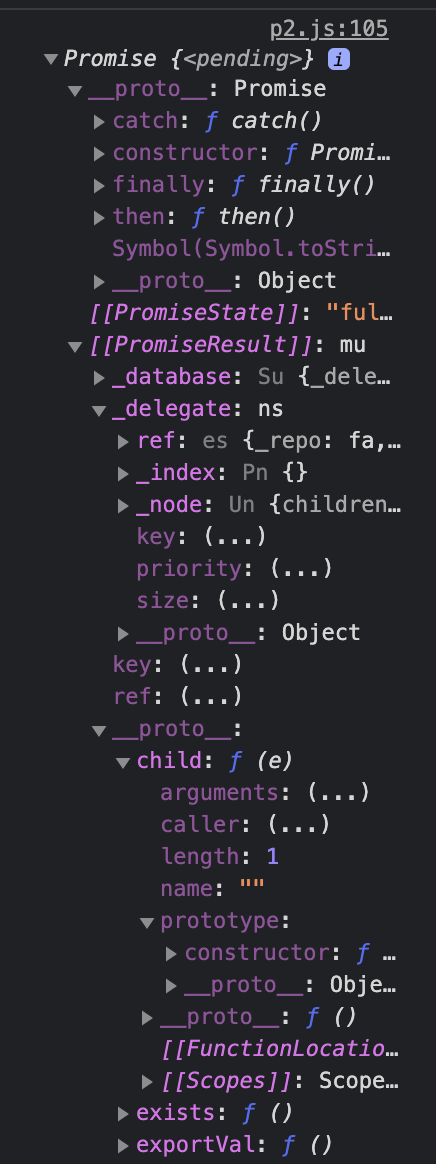
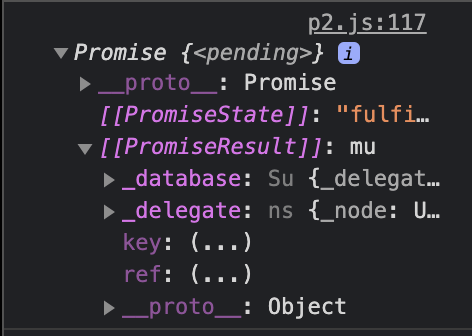
Then, I try to use the get() method: dt = dbRef.child(“ActivityT”).get(); I console.log it and get the following (There’s a lot of nested info in the “Promise”. I don’t know what they are but I cannot find my data inside):
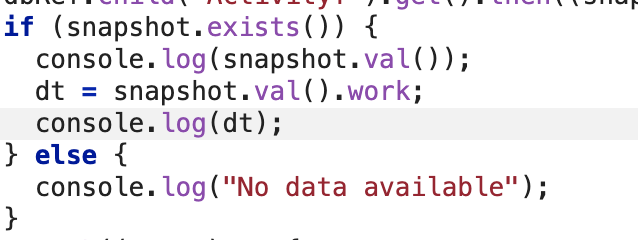
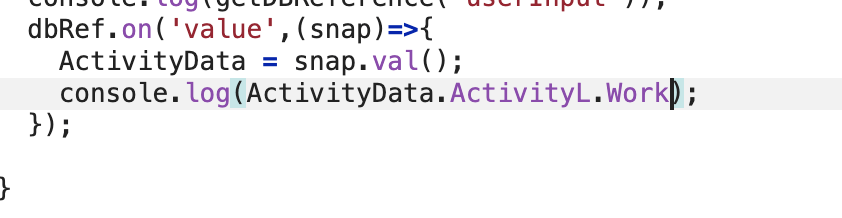
Later when I consulted Professor Moon, he told me that the userId is an essential part of the get function. But I don’t have to use this method to retrieve data. Instead, I can use snap.val() to get the data:
3) Cannot utilize data on another web page
On the user input page, I stored the data in a list so that I don’t have to retrieve data from the firebase to sum them together. But when I tried to utilize data on another web page in the setup function, the data couldn’t be stored in the list.
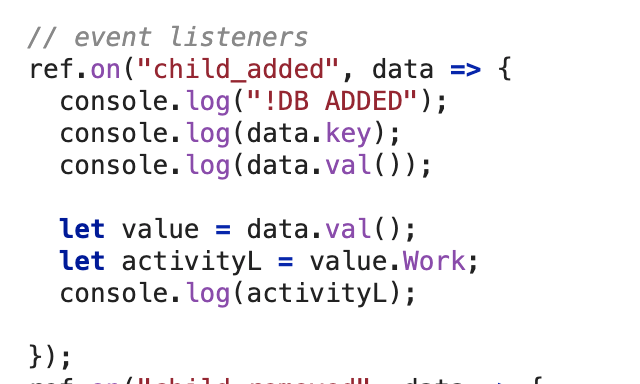
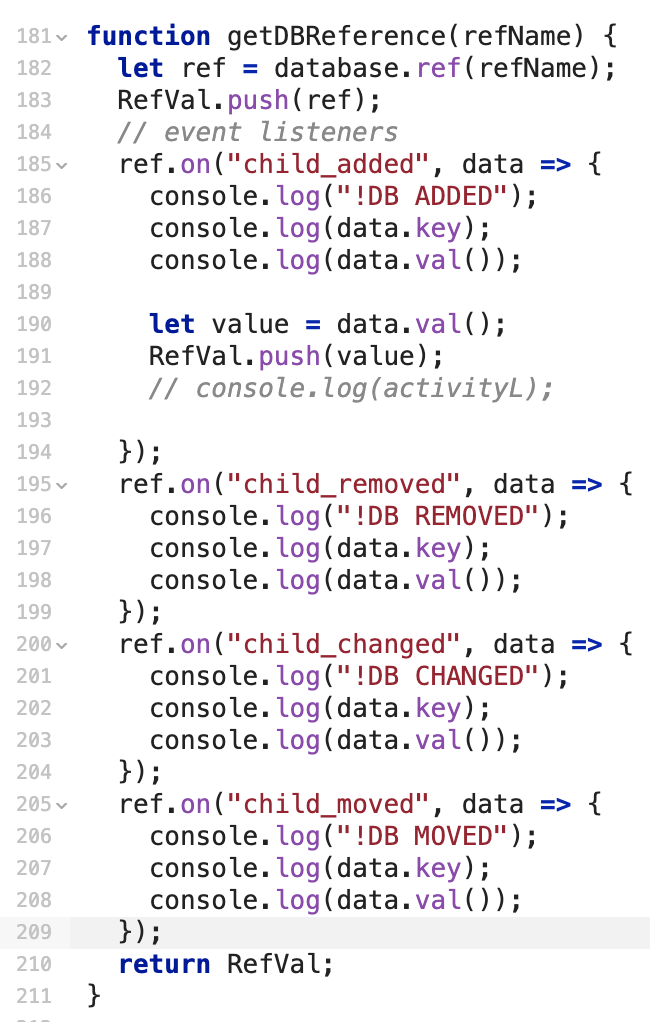
I also tried to return a RefVal list with reference and the values as its elements:
But the list couldn’t be used correctly:
Finally:
4. Time sequencing
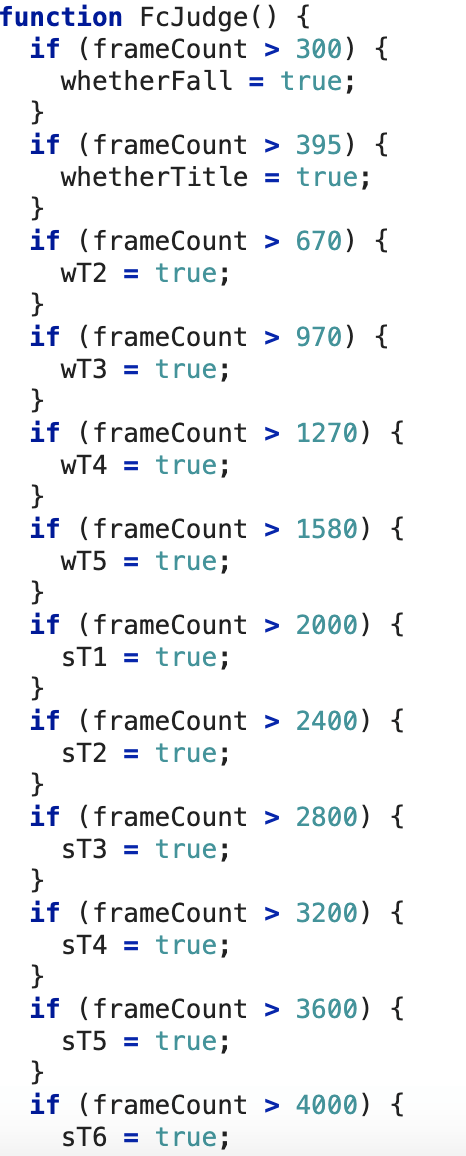
I used frameCount as the time signal for displaying the texts and animation:
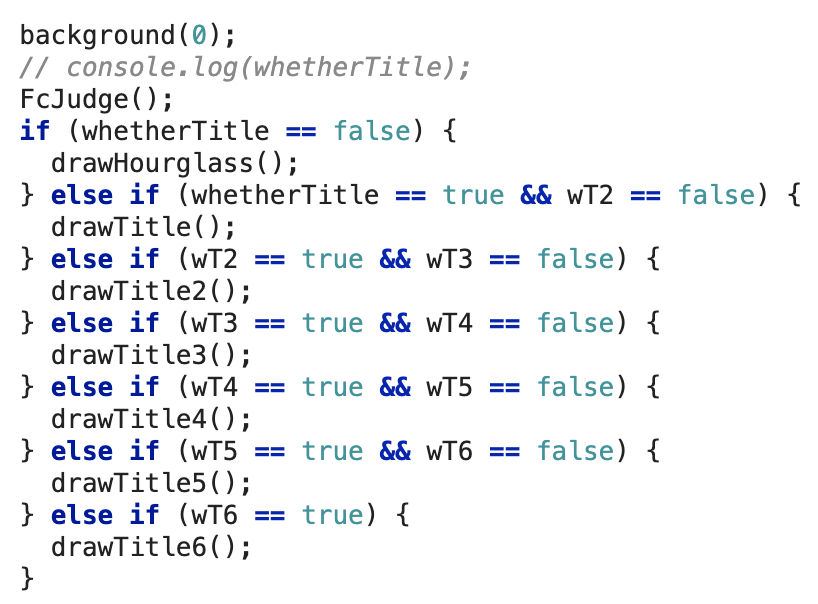
But every time I run the code, the time for loading the sound is different and the sound couldn’t match the animation accurately. I will solve this problem by using other signals in the future.
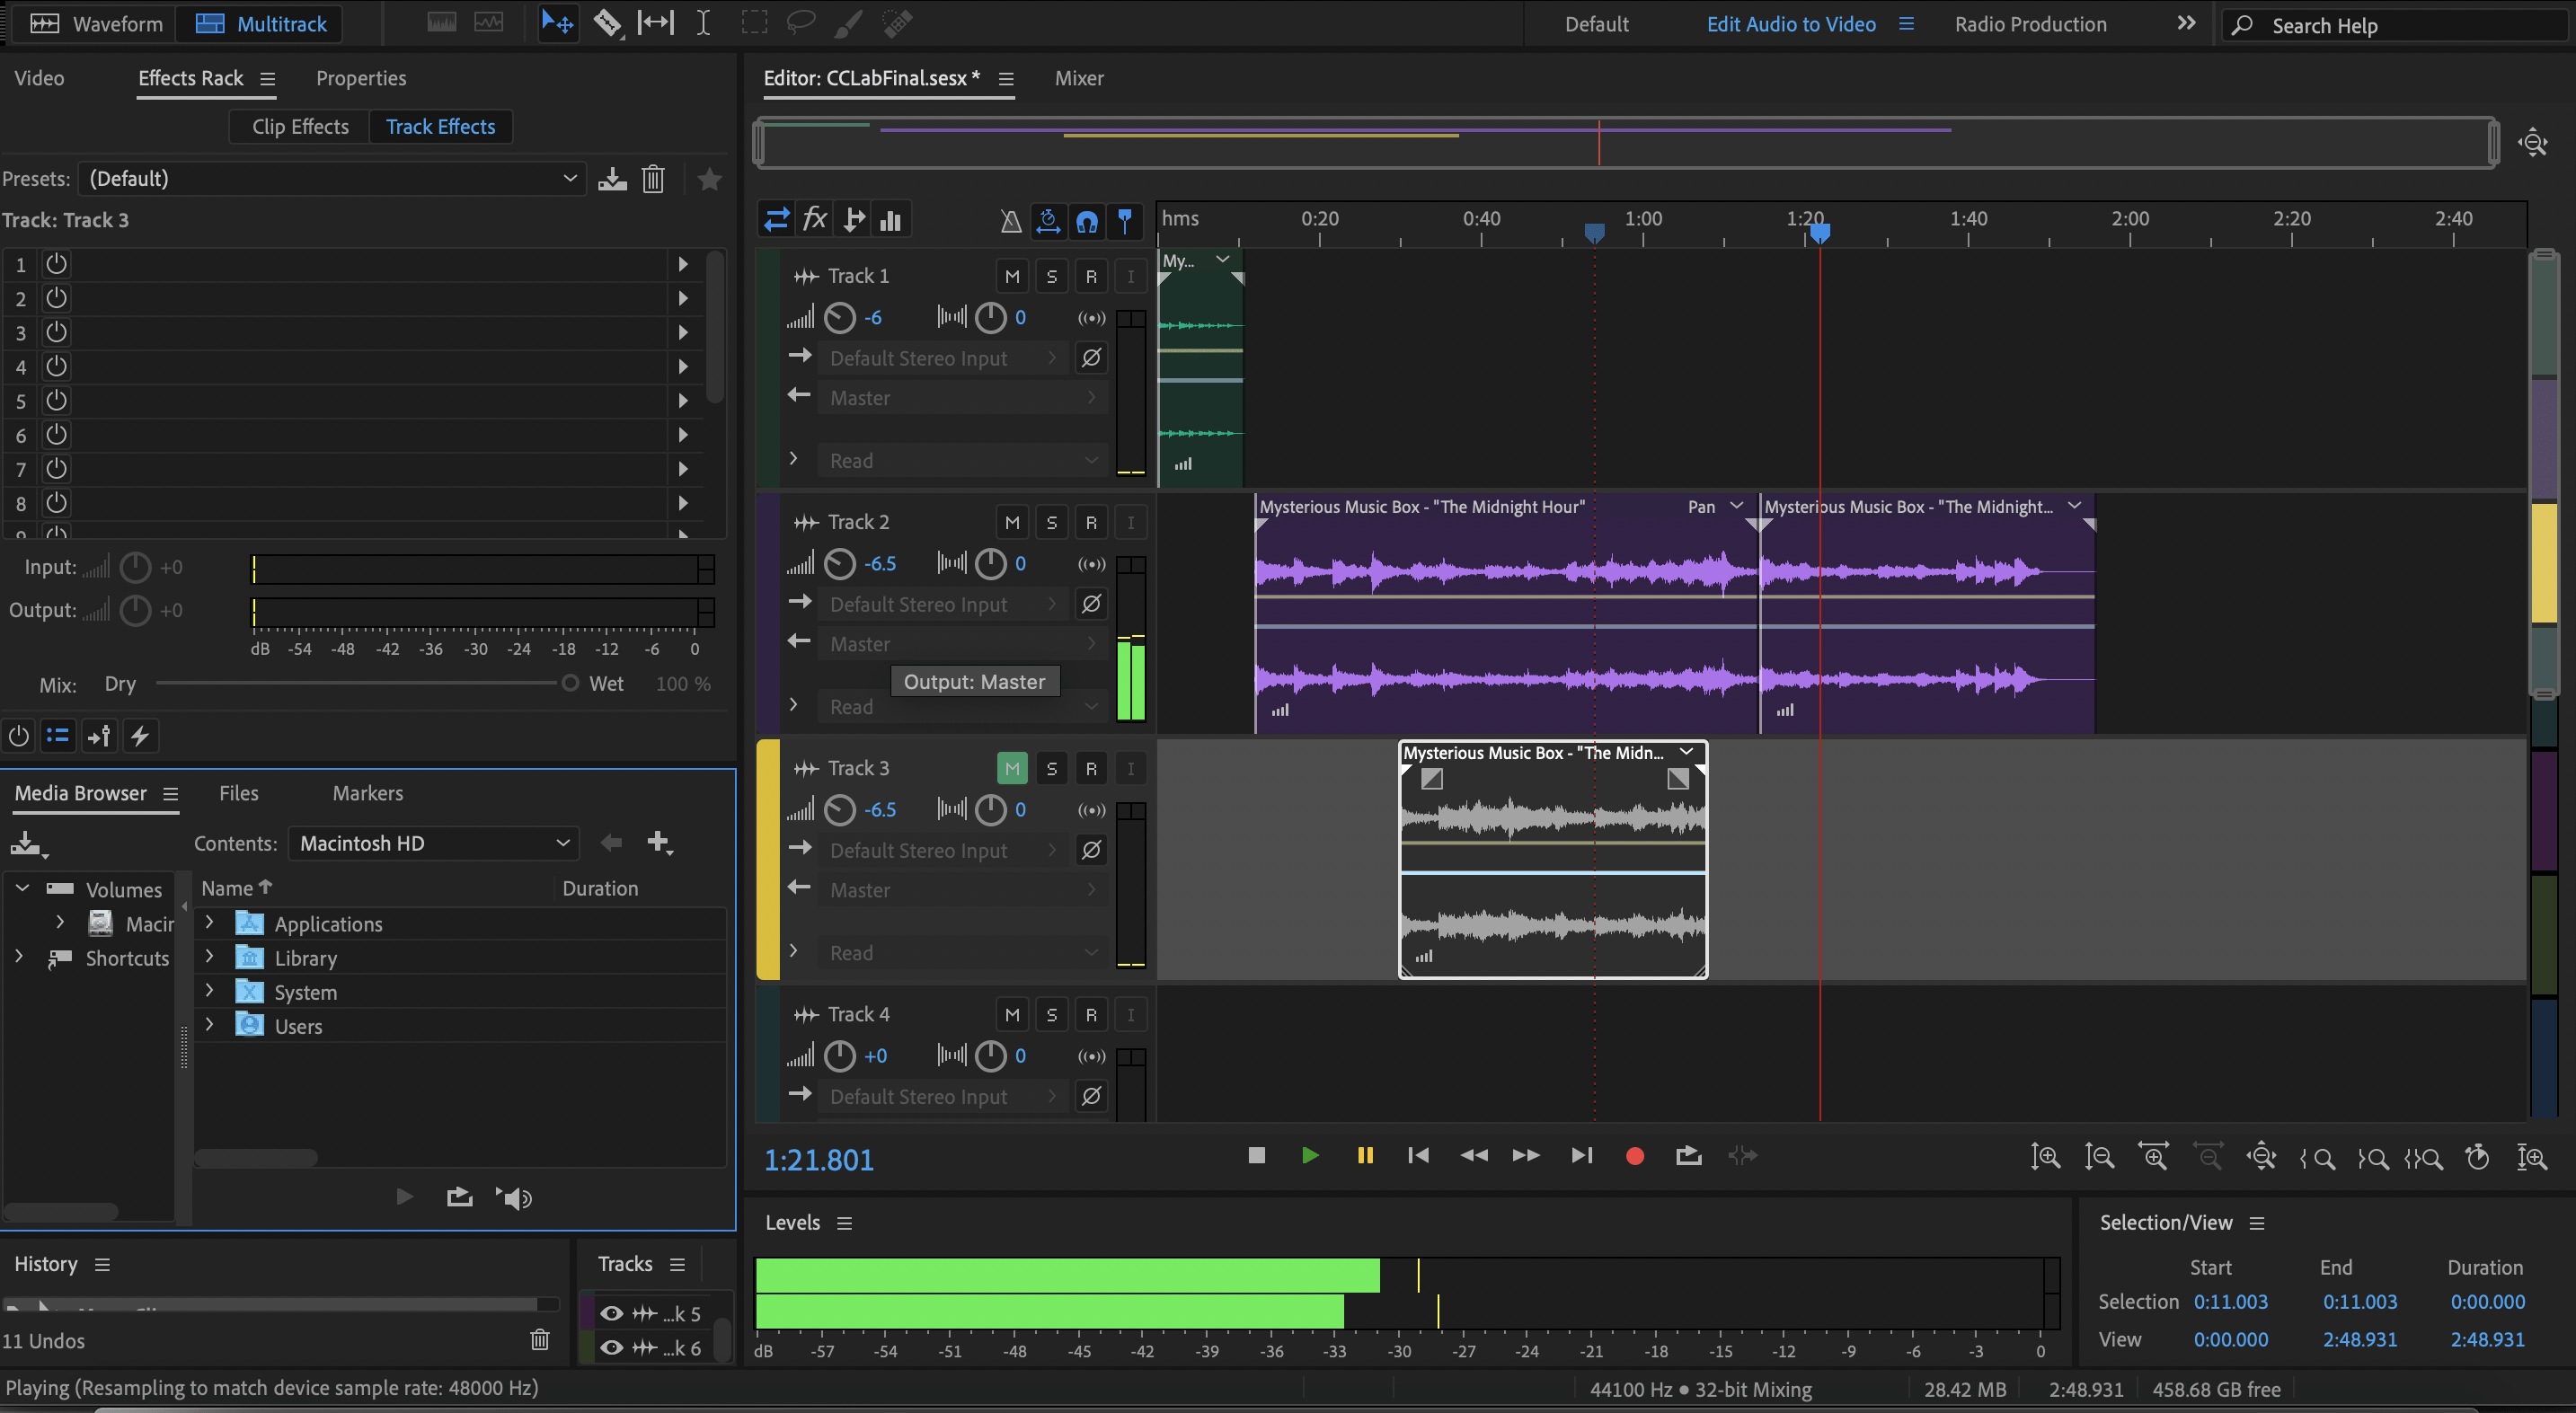
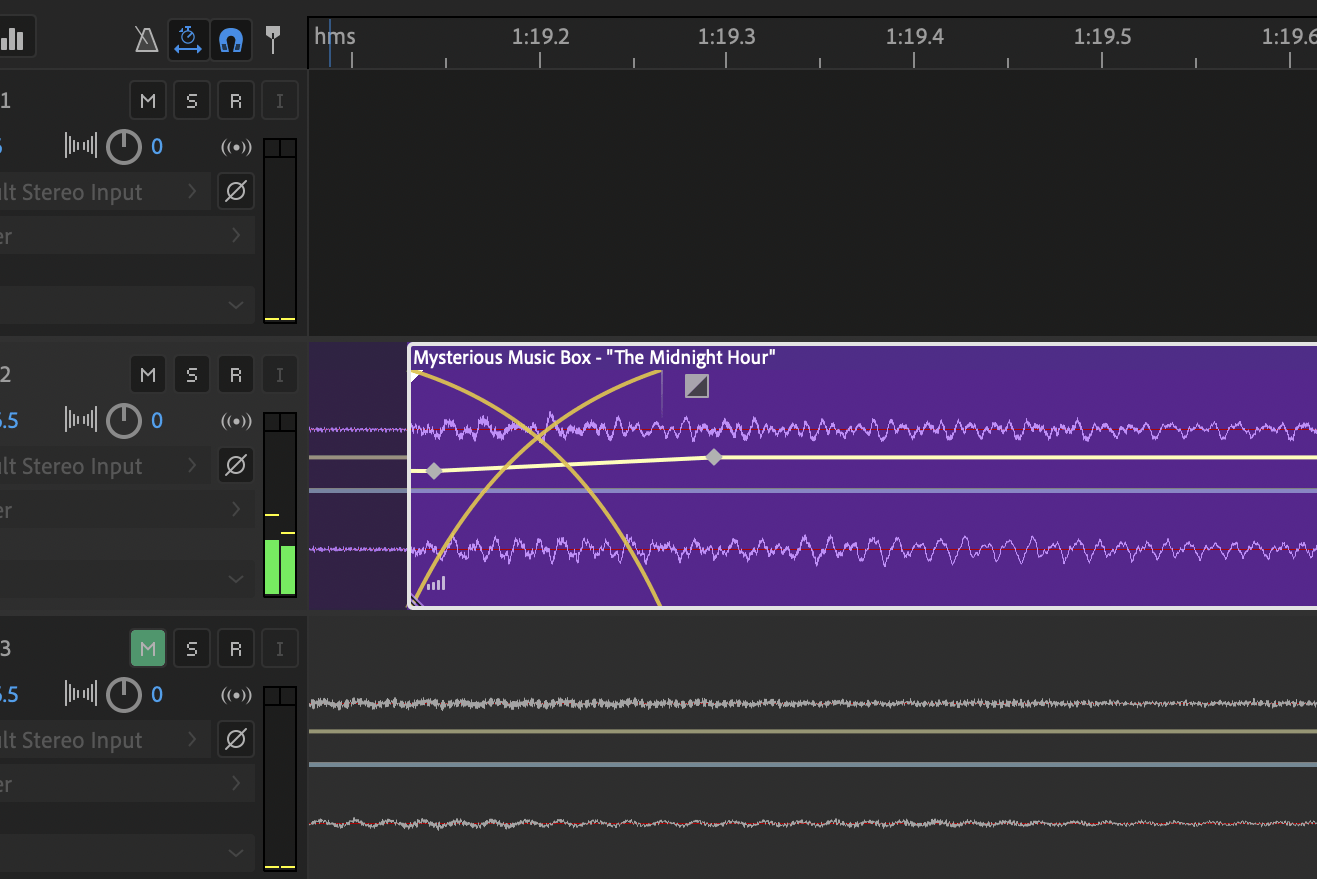
5. Background Music
I downloaded two raw music from Youtube: the first is a clean wall clock sound effect and the second is the music box bgm. I adjusted the volume of the music downloaded. Then I cut the audios and assemble them together to make it the right length.
6. Re-visualize the time
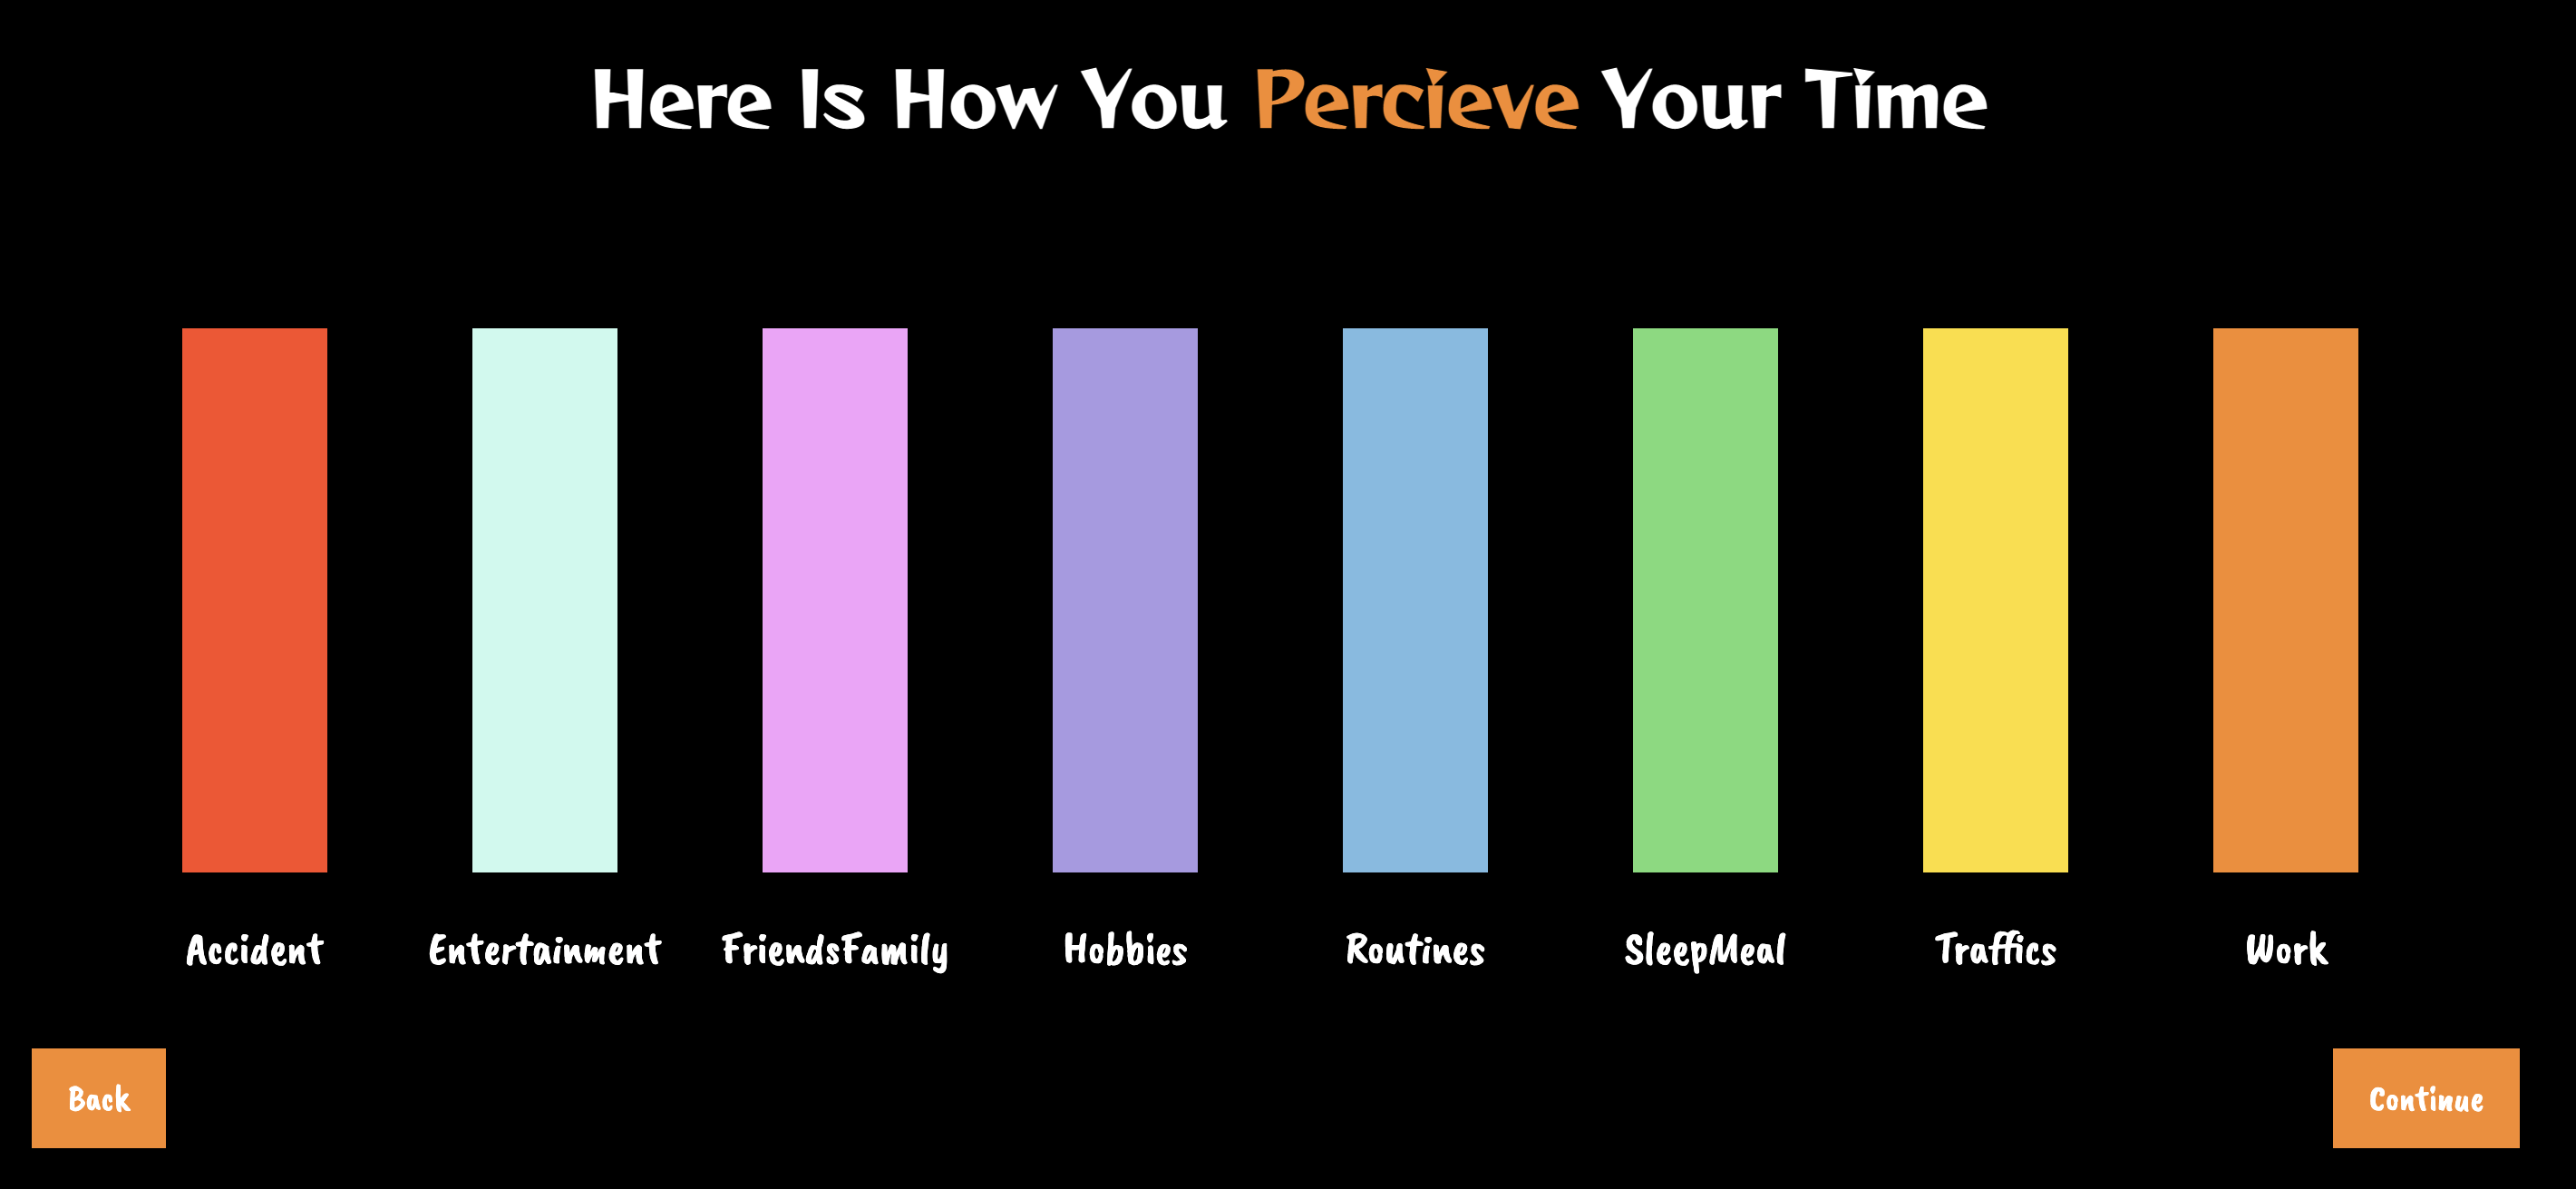
I used a rectangle (window width) to hide the lower part of the histogram and adjust the y position of the histogram rectangles to visualize the objective time:
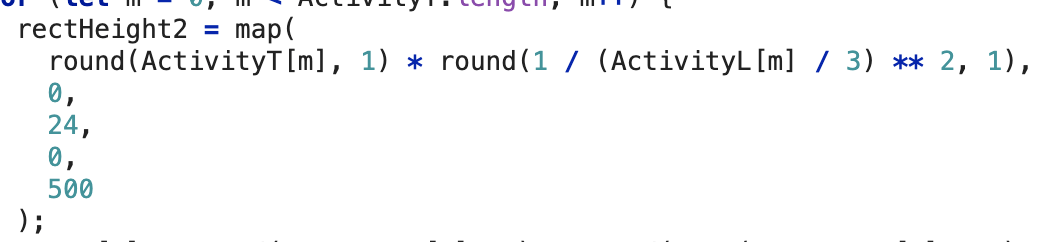
I experimented with formulas that can best map the likeness to the total time:
I used another rectangle to represent the total time based on likeness:
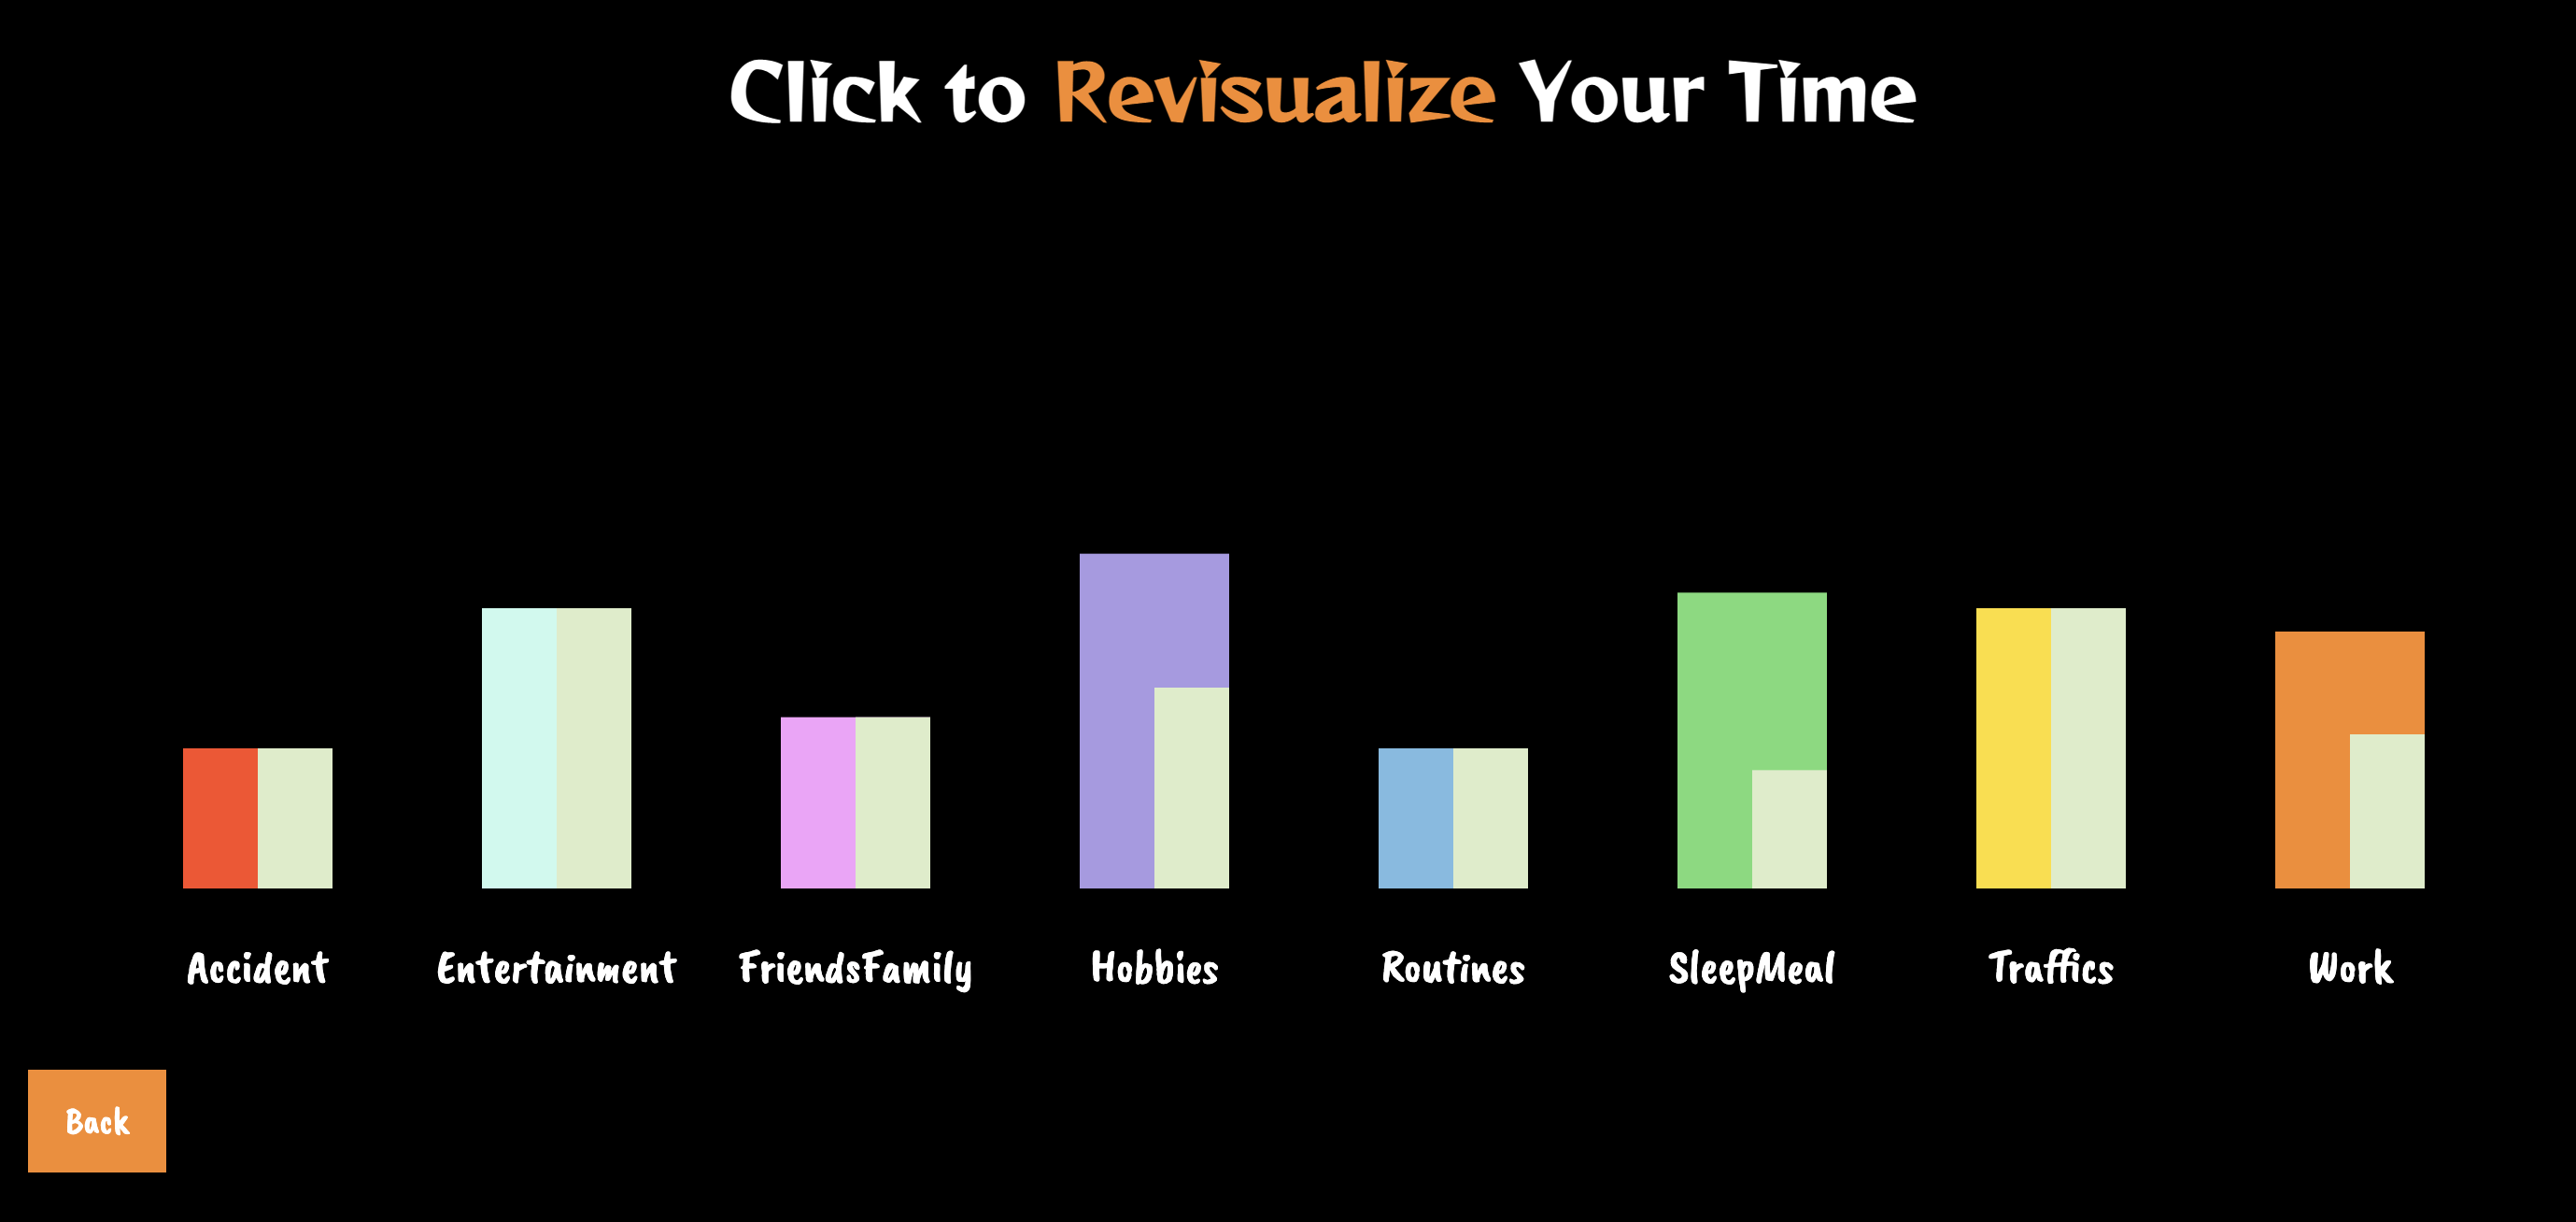
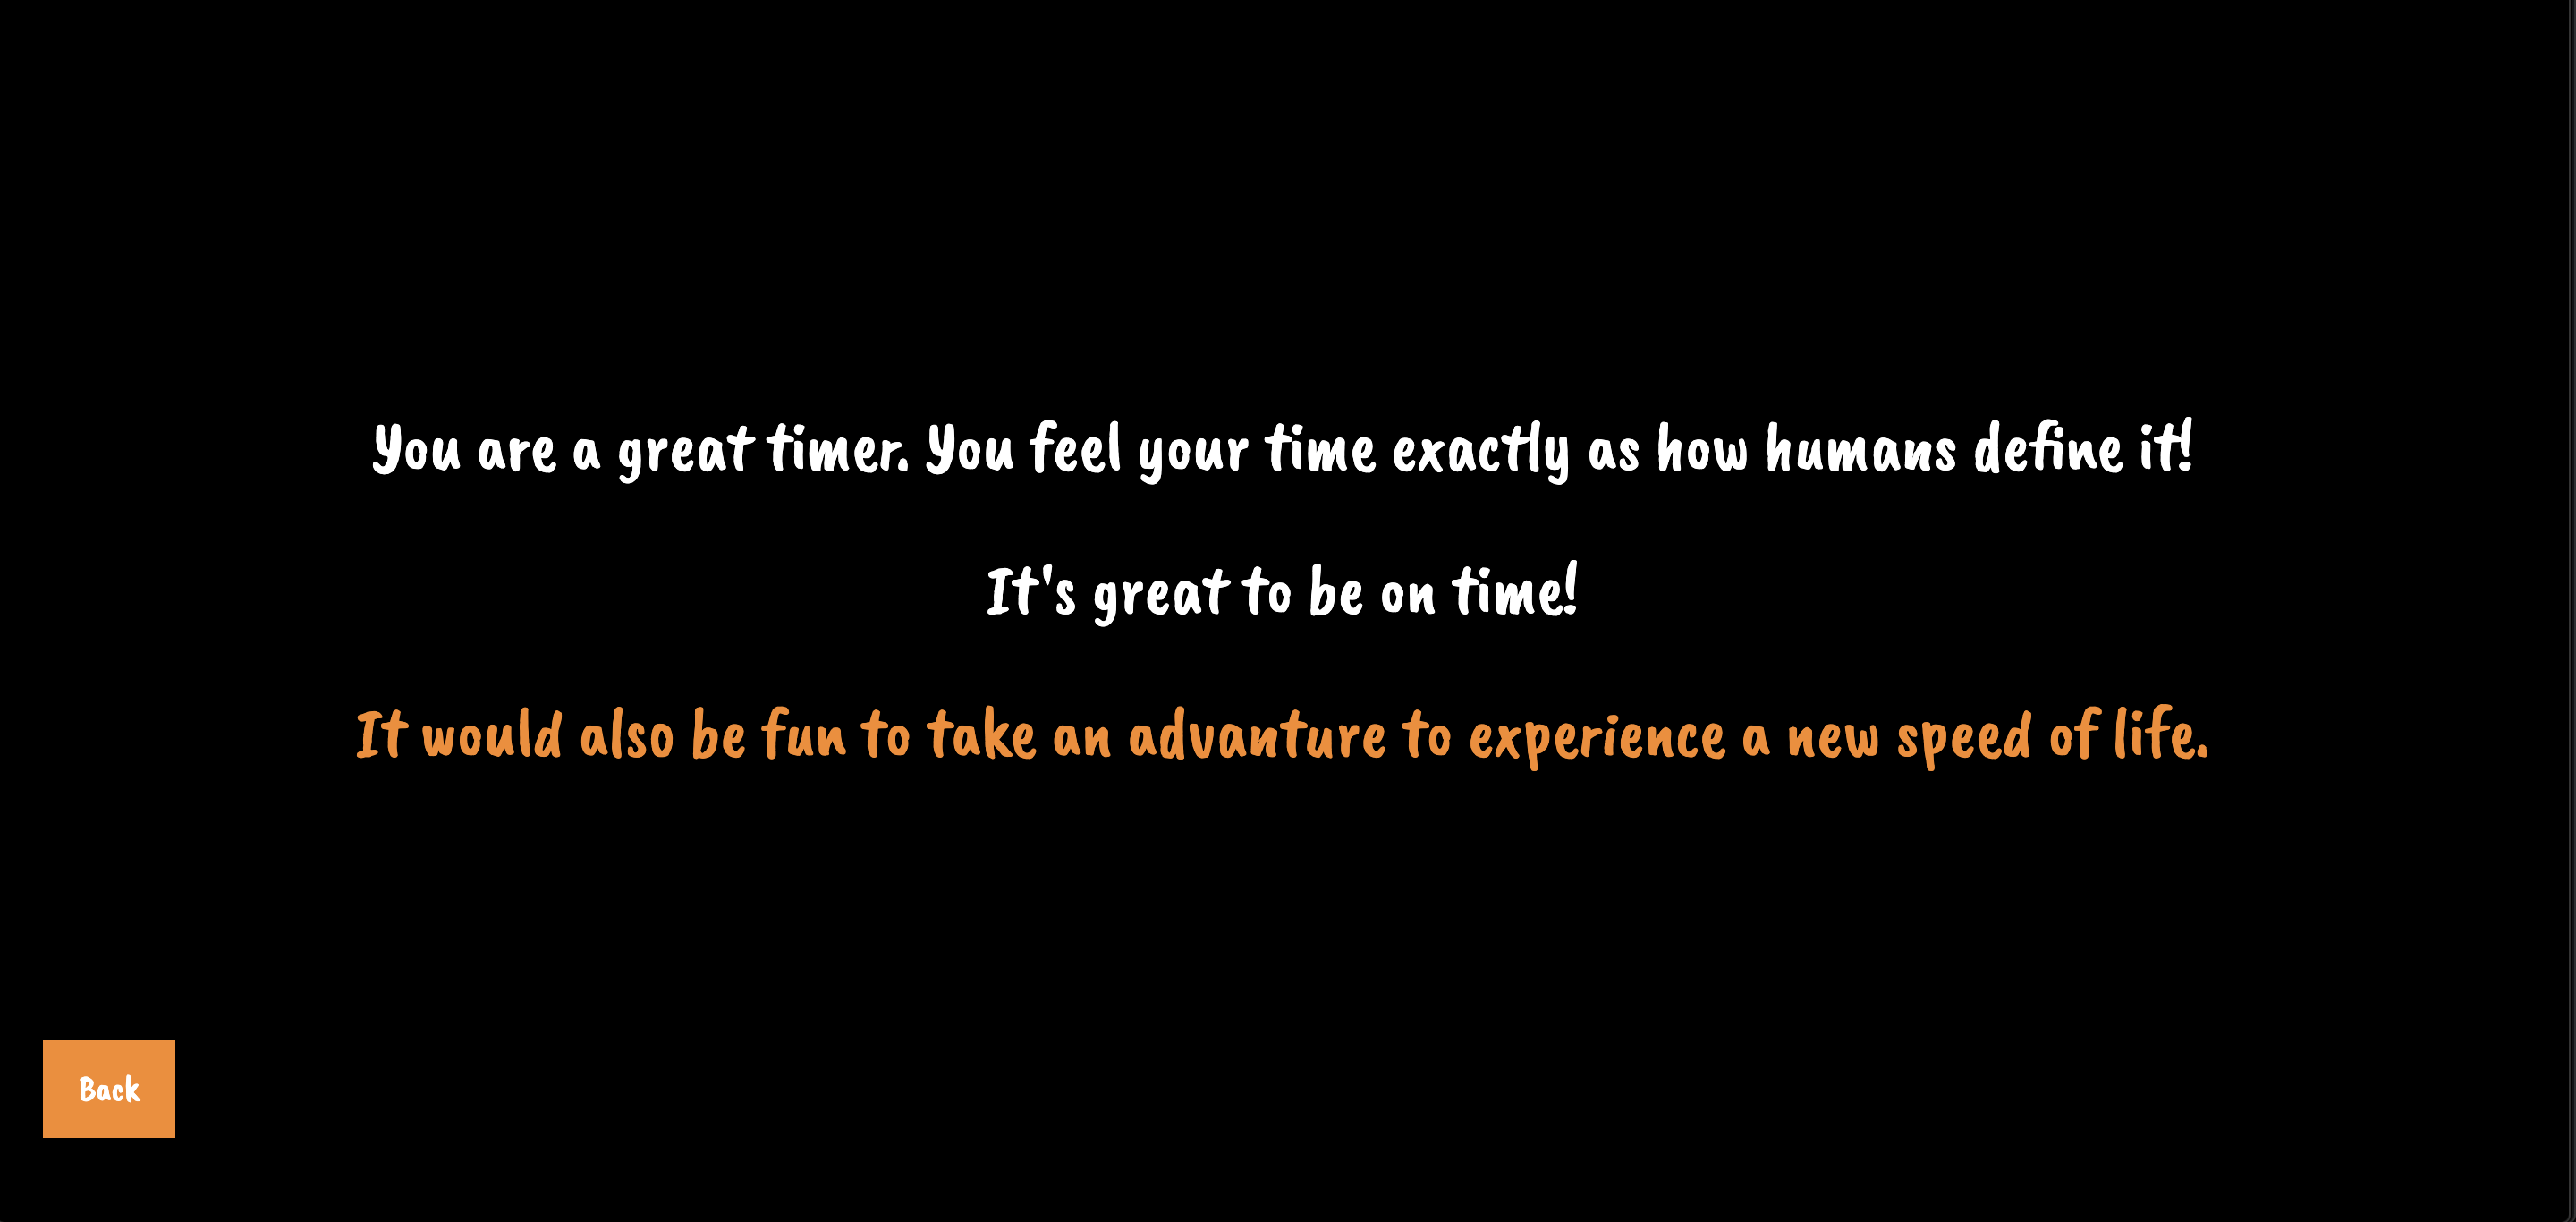
When the total time based on likeness is equal to the objective total time (when users input “neutral” for all the activities), they get this:

When the total time based on likeness exceed the objective total time, they get this:
When the total time based on likeness is less than the objective total time, they get this:
Feedback from Critiques
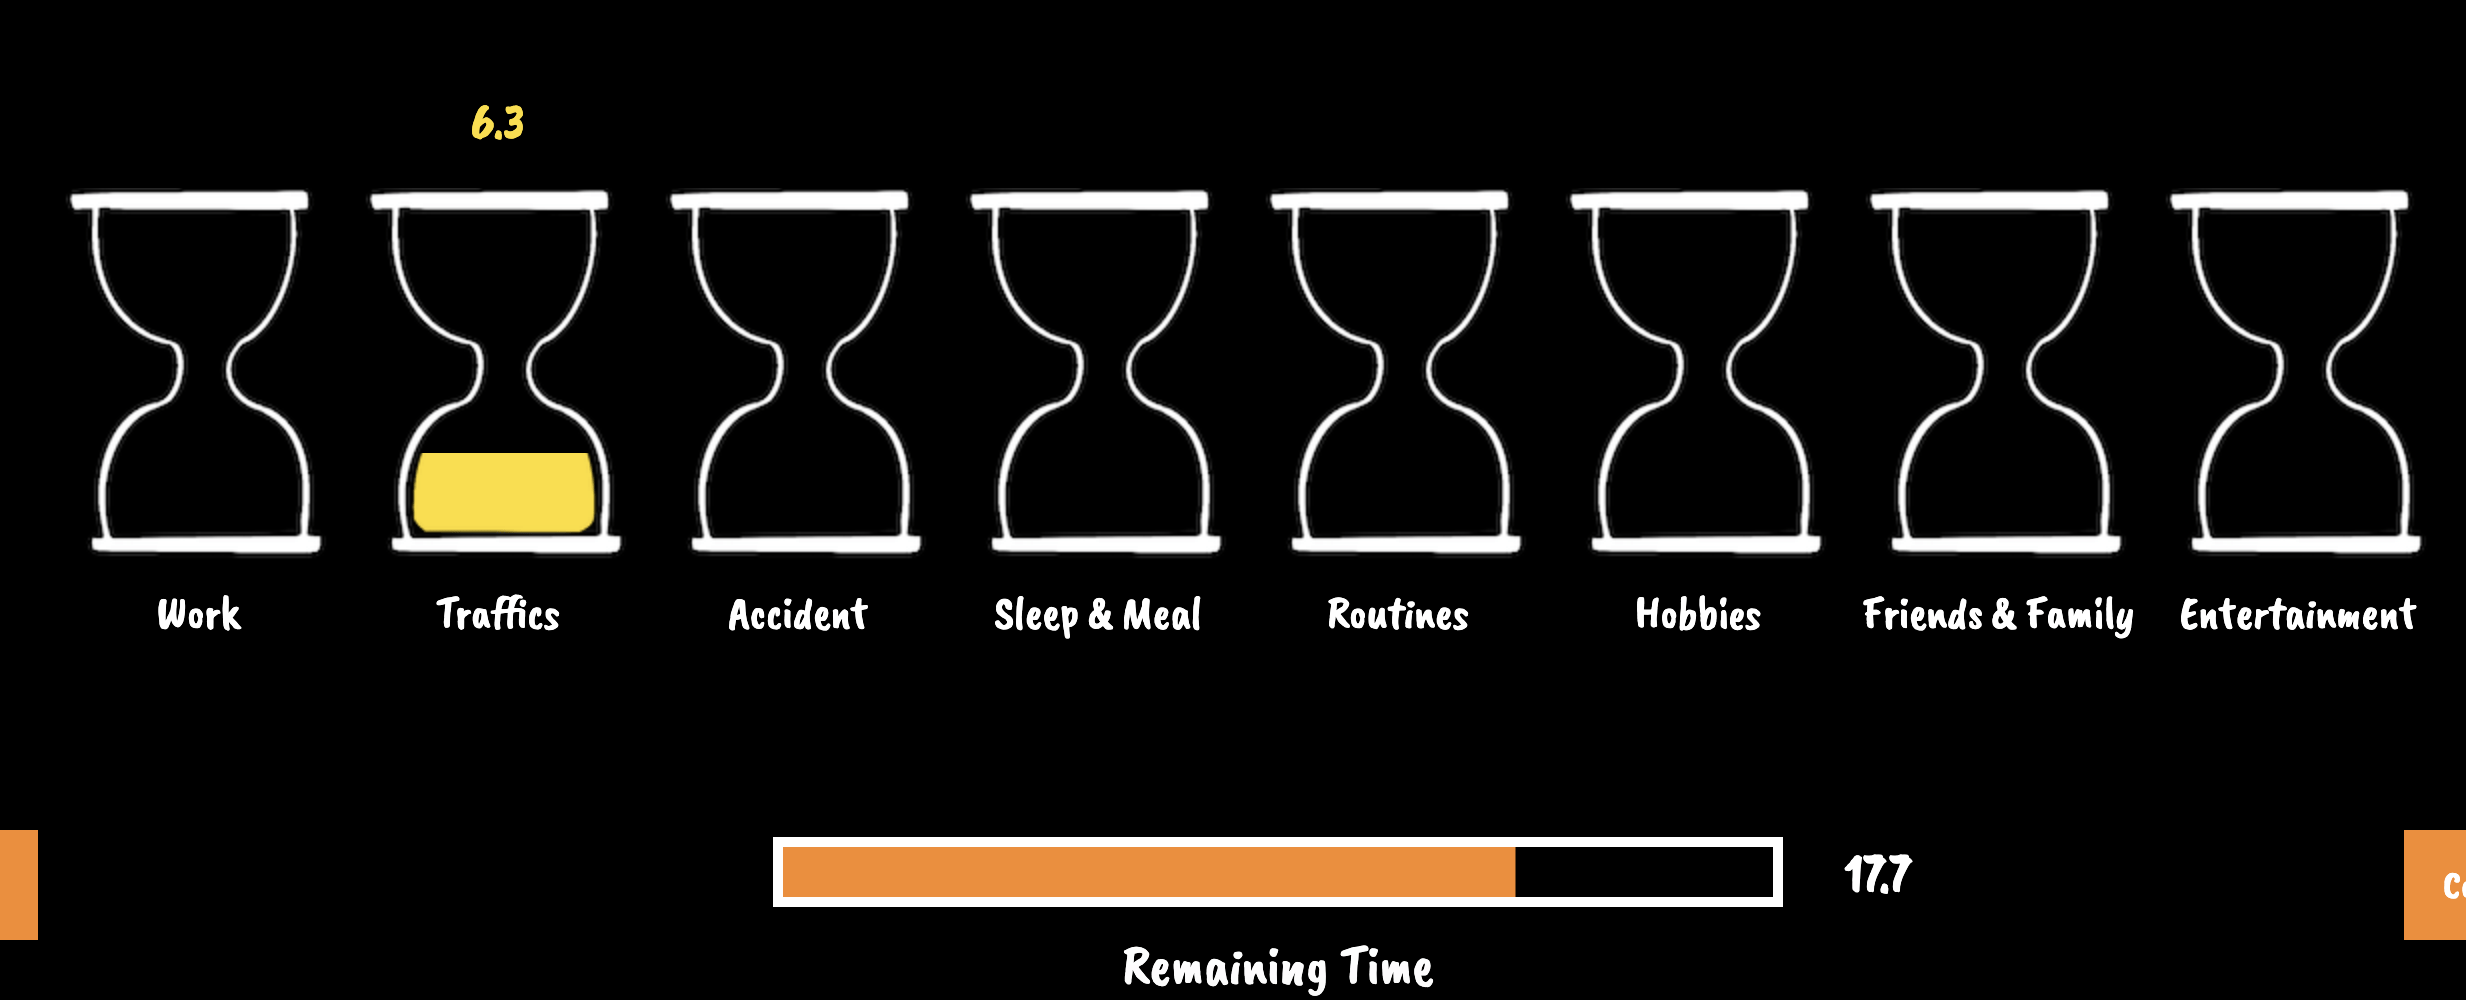
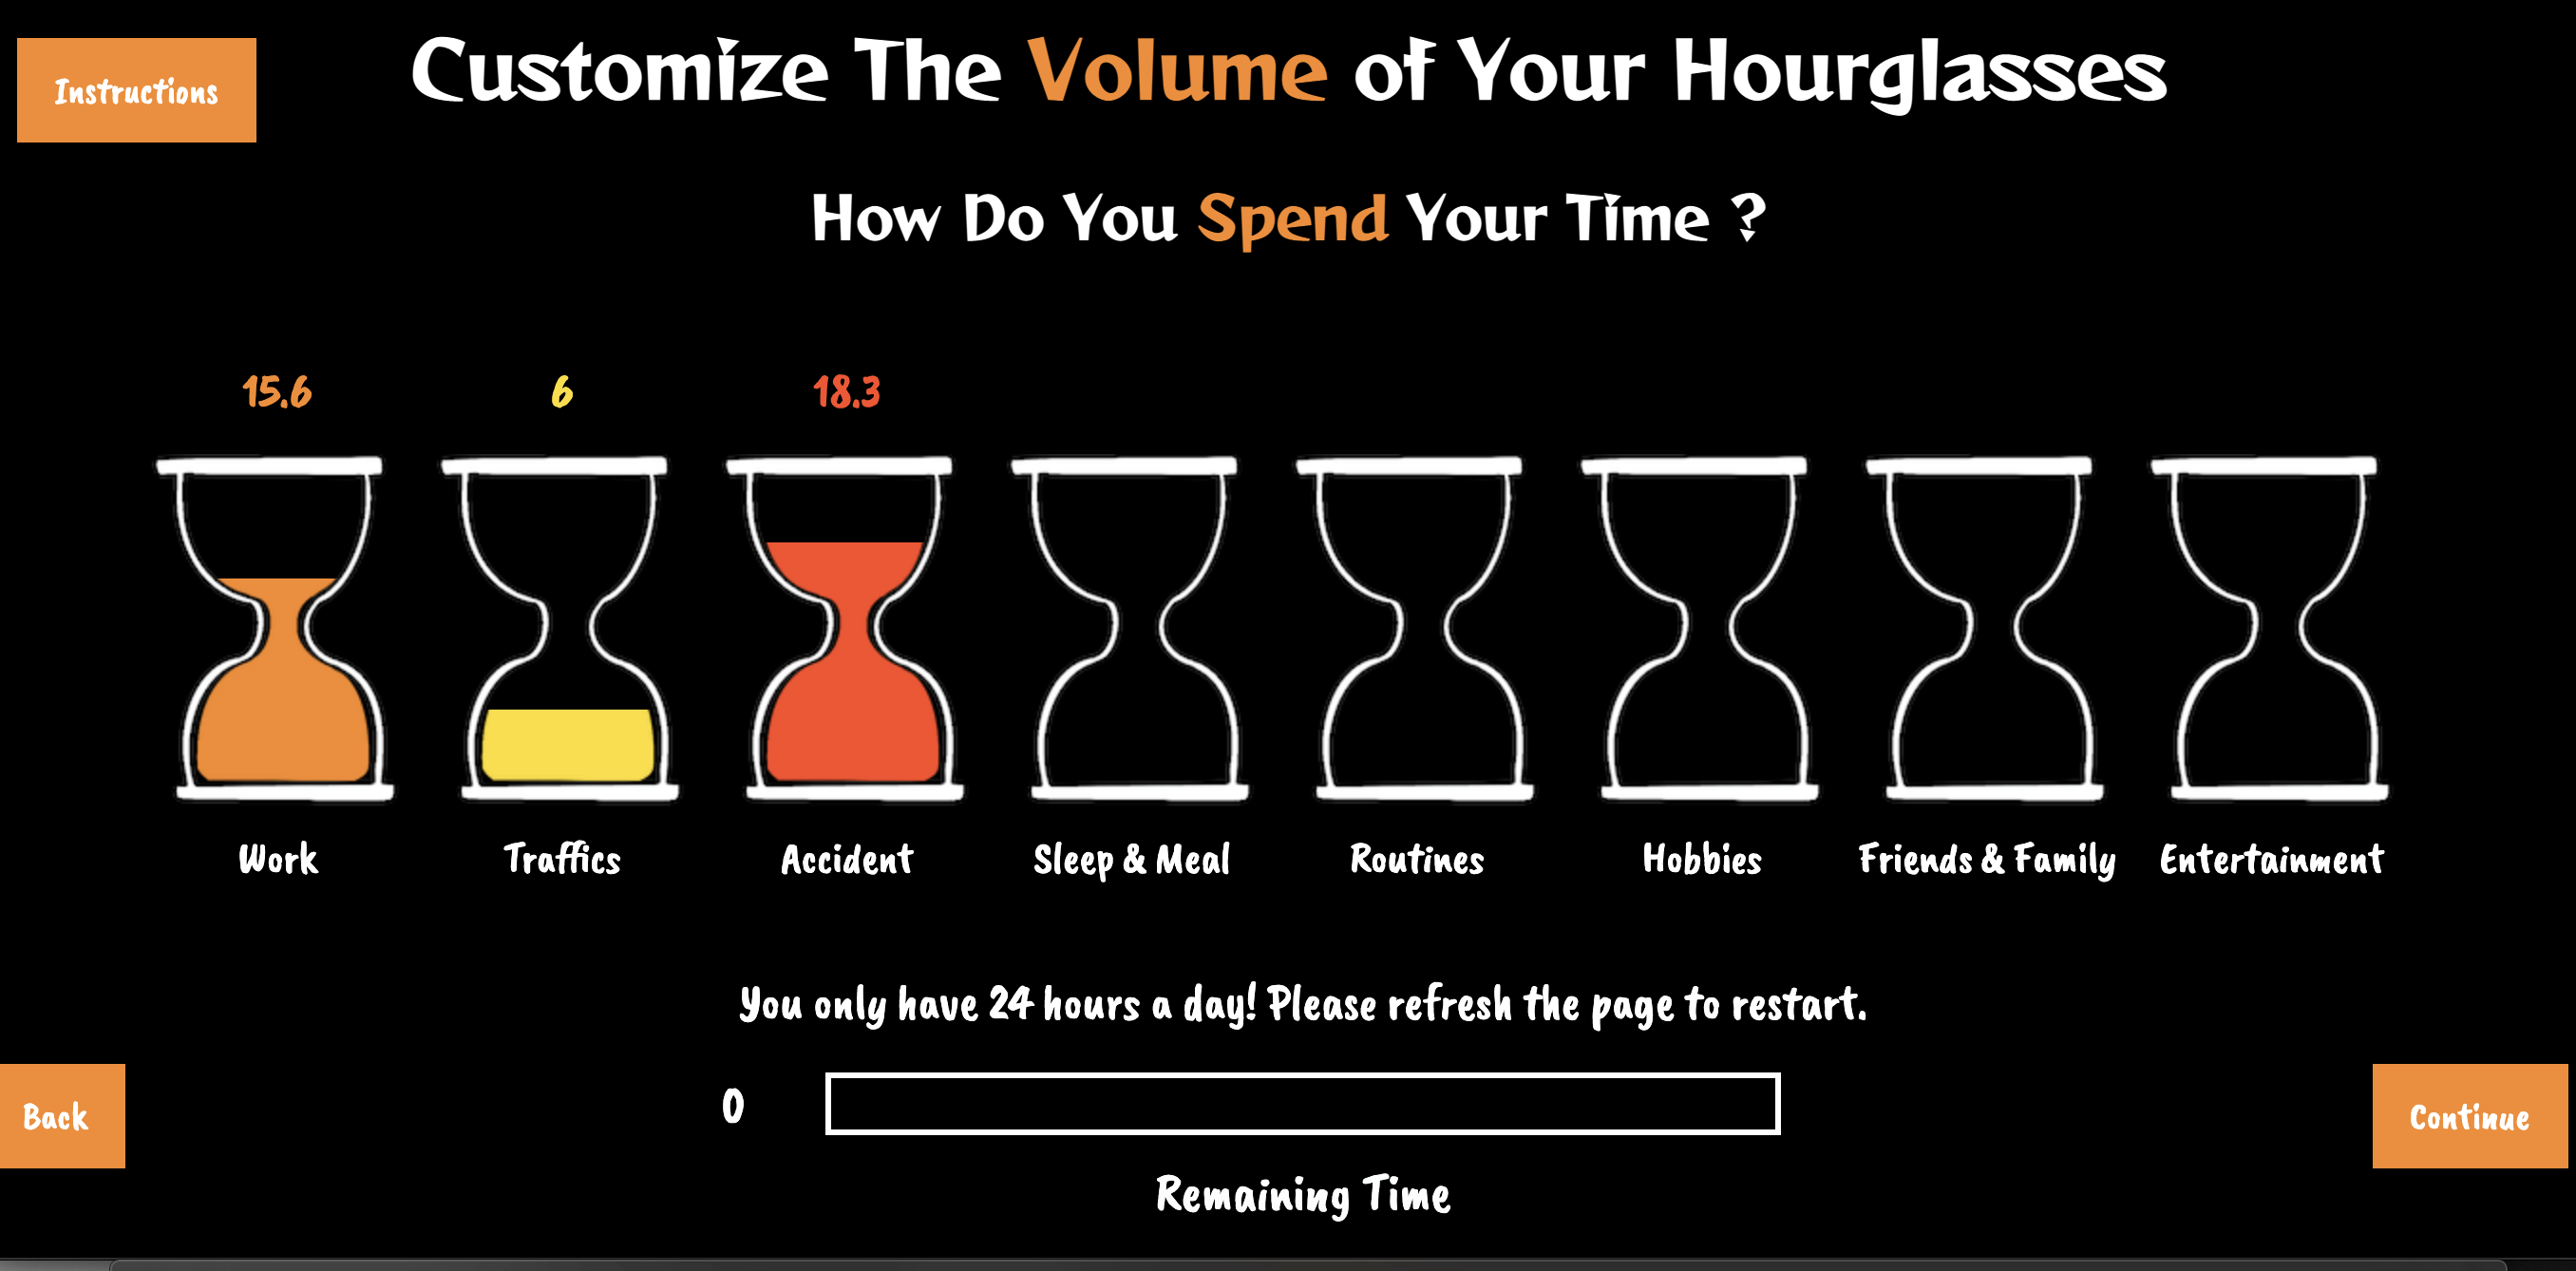
User Interaction: 1. Remaining time alert: For the pg2 user input (where users record their time spent on each activity every day), Mary suggested I make a remaining time alert that shows users how much time is left for the rest of the activity inputs. This can save users time for calculating how much time they’ve inputted and enhance the user experience. I used a progress bar to show the remaining time and improve according to Mary’s advice.
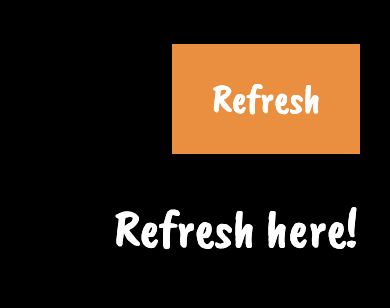
Also, I added a refresh button:
2. Trigger Animation: Originally, I used mouse clicking to trigger the pixelation of the comics and keypress for the falling of sands.
Professor Moon felt that this was redundant and advised me to use only one interaction to trigger the animation. And I revised the interaction according to his advice.
3. Continue button, instruction, and webpage adaptation: Hammond Liu, who inspired me to do this project, experienced it during the IMA show. He accidentally skipped the animation at the beginning because he pressed the continue button before the animation began (partially because the music wasn’t at play on the IMA show and he didn’t realize that there would be an animation). He thought that it would be better to hide the button until the animation ended. Also, he found that the webpage was messed up on the display screen due to different screen sizes. When he was inputting his data, he didn’t notice the instruction button and therefore felt confused about what to do and why. He suggested I display the instruction in a more concise and explicit way. I will make improvements based on his suggestions in the future.
Hourglass Animation: Both Rachel (on Interaction day) and professor Moon comments that the speed difference between hourglasses should be more explicit so that users can get the point easily. The speed for “very like” should be very fast and the speed for “very hate” should be very slow. I adjusted the speed and added more contrast to the hourglasses’ animation according to their suggestions.
What’s more, Linda also commented that she wished to see all the animations on the same pages that the speed difference will be more explicit. I intended to do that when I was discussing with Rachel about the animation part on Interaction day. But I found that this made the animation less fluent. Also, the comics’ size must be reduced when they were all crammed into one webpage so that they couldn’t be shown clearly. If I increase the length of the webpage and make an end-to-end arrangement, users cannot see all the animation at the same time, which will fail the original purpose. Therefore, I kept the animations on separate web pages.
Background Music: On the interaction day, Lexie told me that some “clever background music” can greatly enhance the project. I select the music according to this advice.
Reflection/Lessons Learned
In this project, I learned how to utilize a real-time database for user input data. I also effectively utilized console.log to debug. I also learned to design user experience by listening to the users’ feedback. Compared to the midterm project, I make the user interaction more meaningful and concise. However, due to the time limit, I rush through creating the pages and wrote inefficient codes (e.g. time sequencing using frameCount). I need to improve on HTML/CSS skills for webpage design so that the javascript elements can fit better into the webpage. For user experience, I still need to improve and solve some major issues proposed by those who’ve experienced my project.
Future Plan
- Complete the stretch goal: the user categorization page
- Hide the continue button on the intro page
- Make the webpage self-adapt
- Provide instruction in a more explicit way (e.g. make the name of each activity clickable and show the messages upon clicking)
- Background Music for interaction pages
- Improve the codes’ efficiency
Attributes & Resource
Music: 1. Mysterious Music Box – “The Midnight Hour”
2. Clean Wall Clock Ticking Sound Effect
Coding: 1. Summing the array’s elements