12.R Final Project Prototyping
“Code + Time Visualization” — Prototyping
Demo
Fabrication
1. Creating Webpage
Firstly, I created the title using HTML and a p5 canvas with window width and window height:
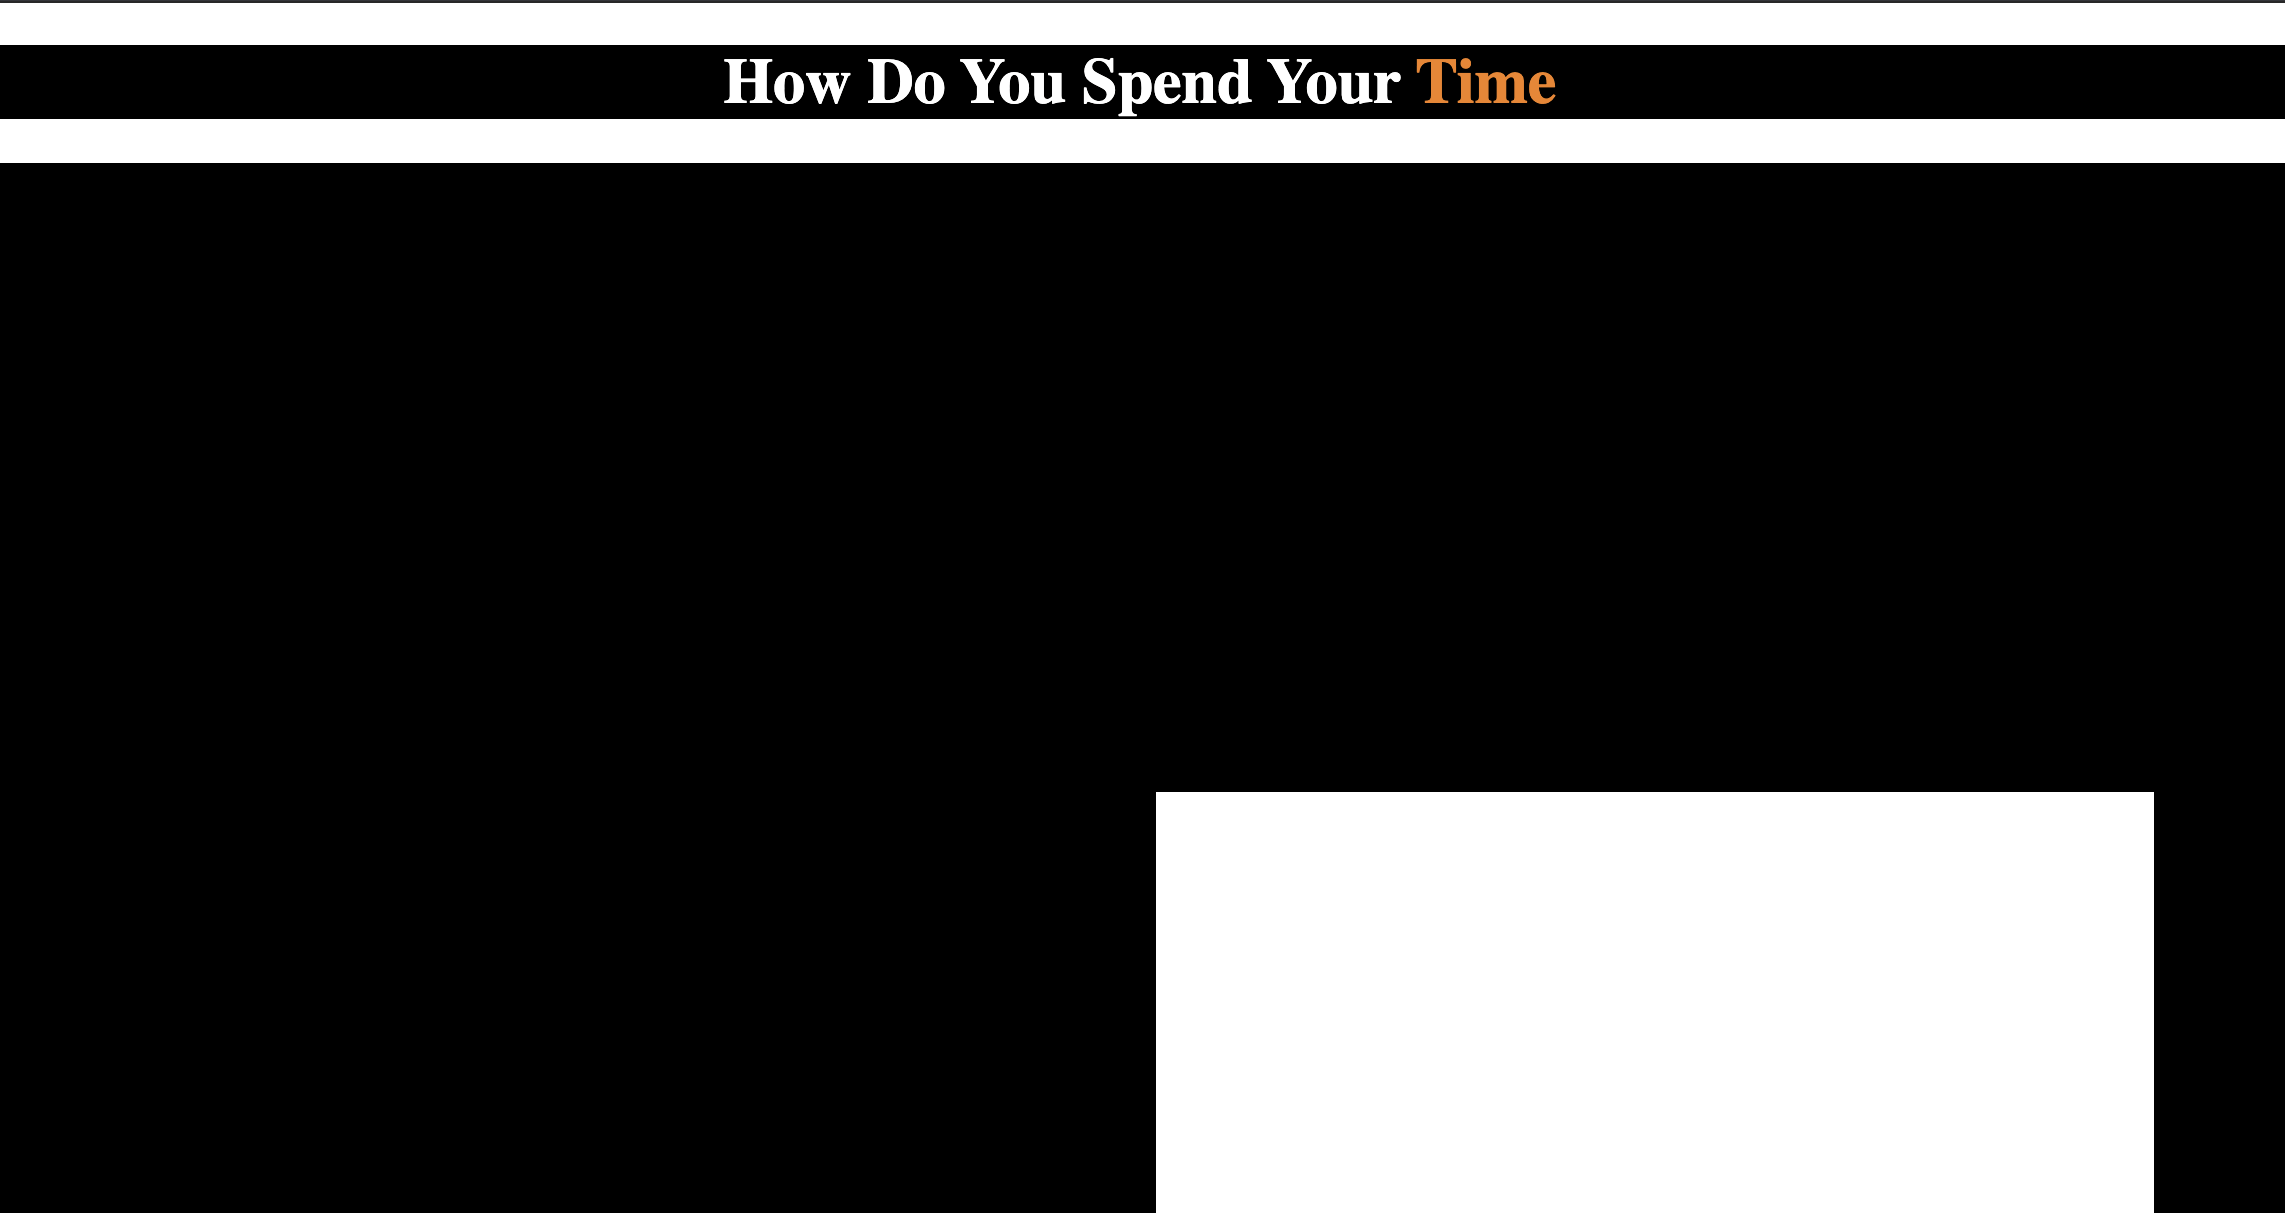
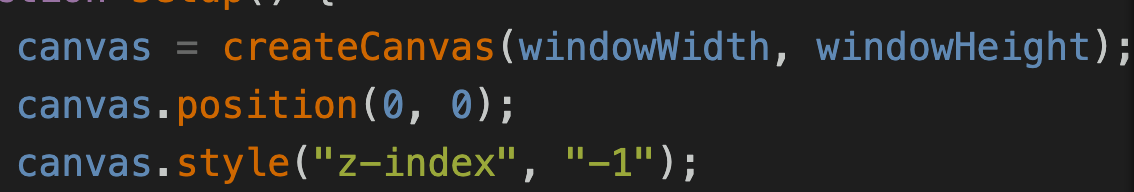
To eliminate the white border, I set the margin of the title to 0 and adjust the canvas’s position using canvas.position and canvas.style:
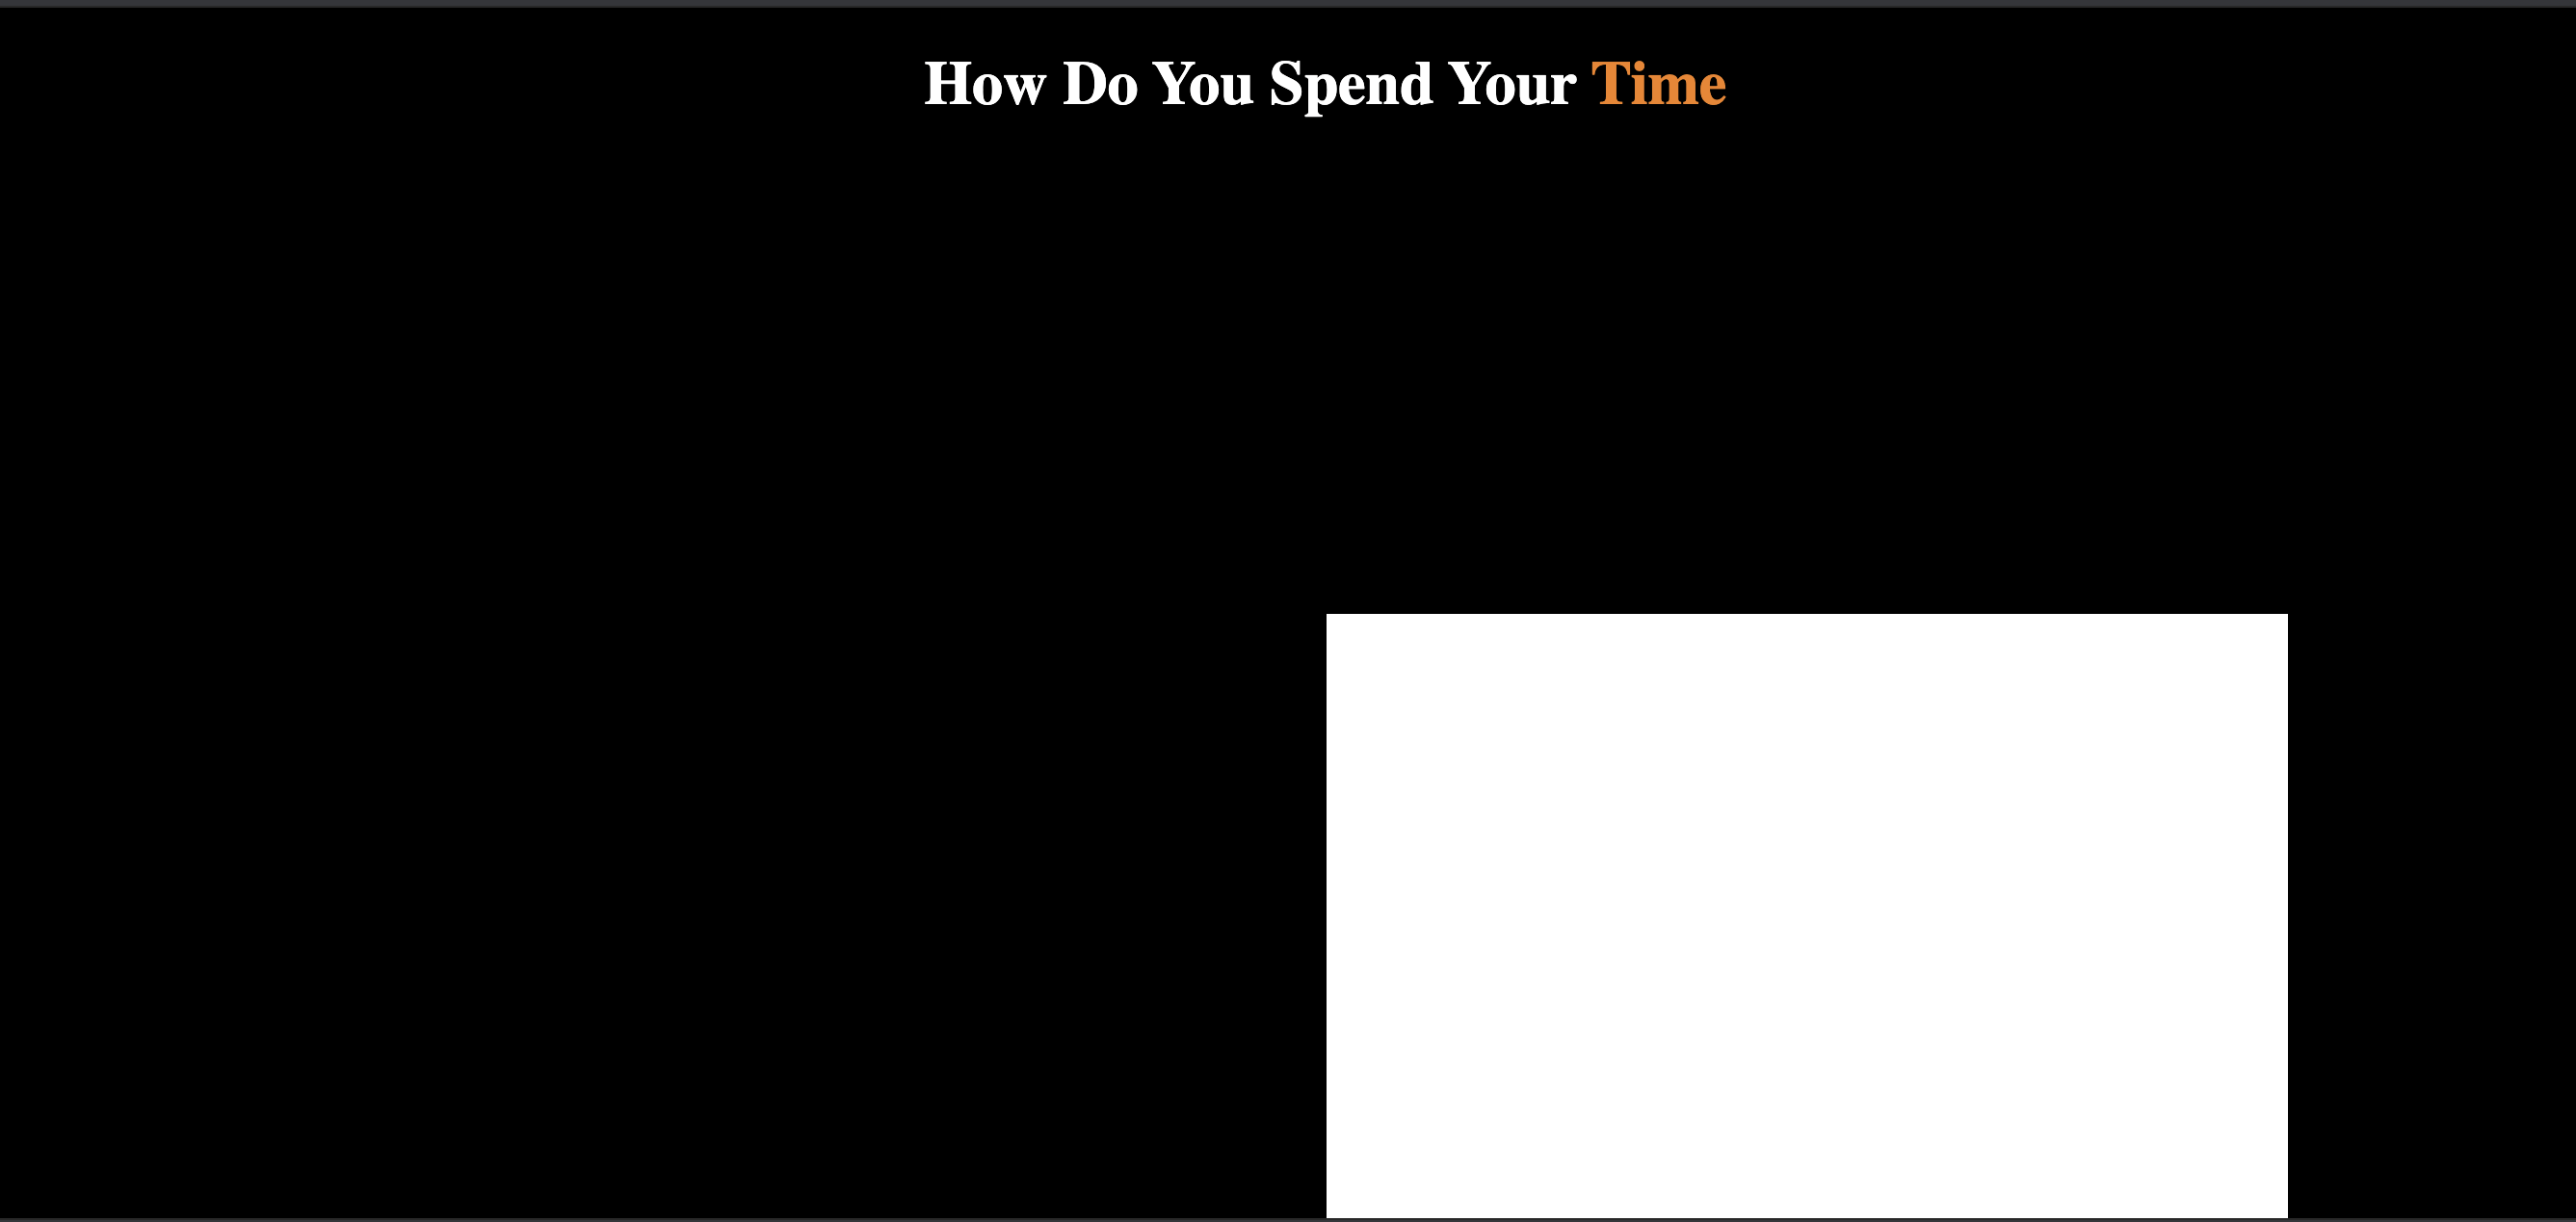
(The white rectangle is a pattern I drew in the draw function)
2. Creating Volume Rectangle
First, I defined an interaction range for mouseY position and created a rectangle whose position is in accordance with mouseY. The rectangle will only appear when mouseY falls into the interaction range:
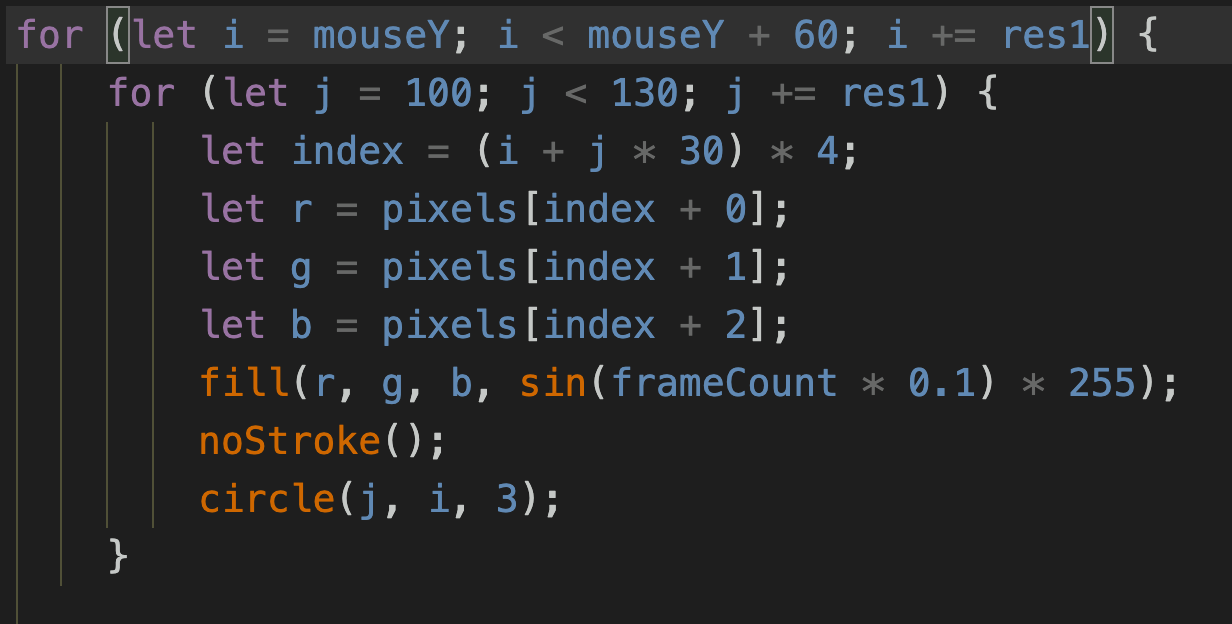
Then, I loaded the pixels and used pixel arrays to make the rectangles look like sands. Below is an attempt of using sin function in pixel’s alpha value:
Since the effect was not satisfying, I also tried to randomize the alpha values and sizes of the pixels:
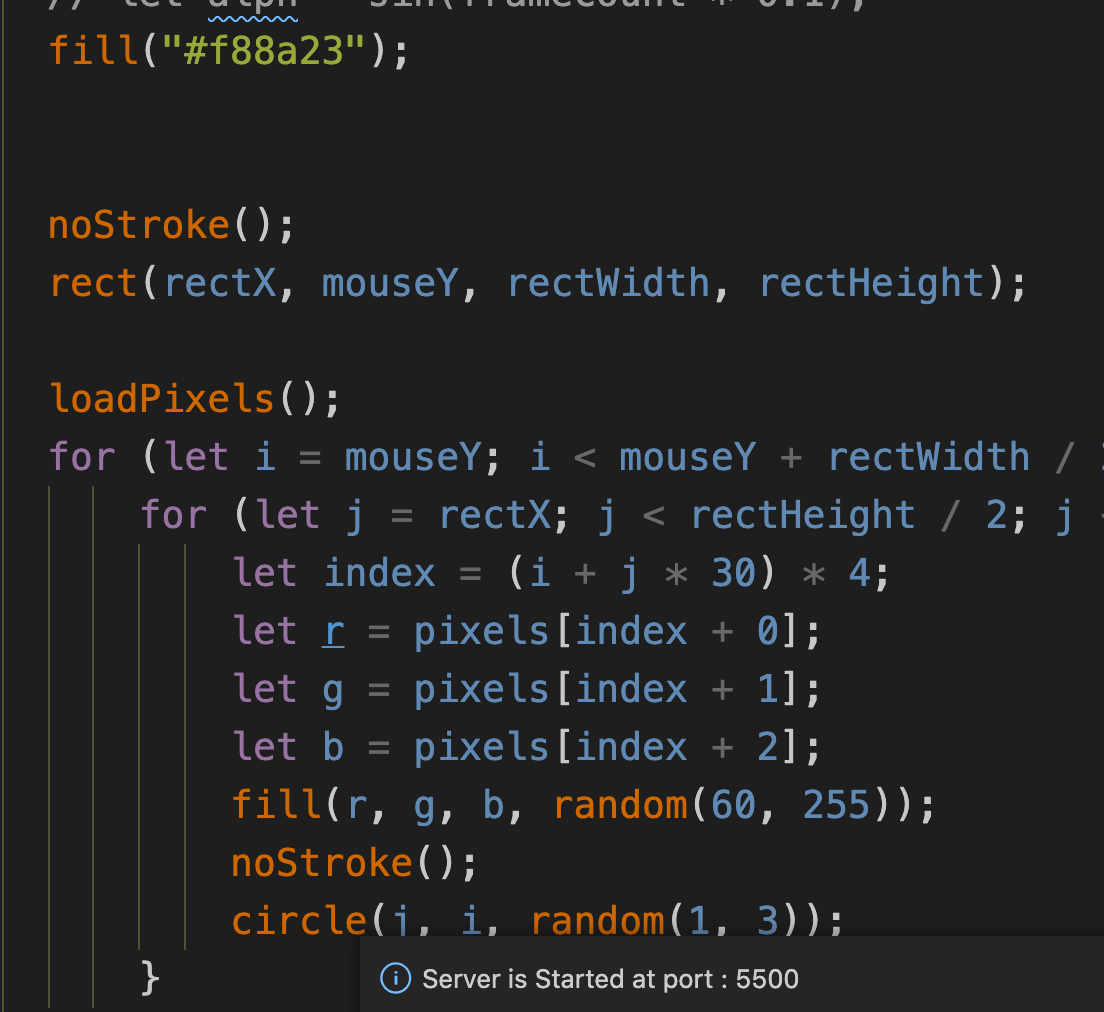
But due to the regular distribution of the pixels, the manipulated rectangle didn’t resemble the sands. So I decided to use a solid rectangle instead.
3. Constructing the hourglass:
I drew the hourglass in Procreate and exported it as a PNG file with transparent background. Since the rectangle is drawn from the corner and its height is fixed, I increased the length of the hourglass image to hide the rectangle when the mouseY value is large.

I loaded the image and adjusted its position and size to make it fit the rectangle:
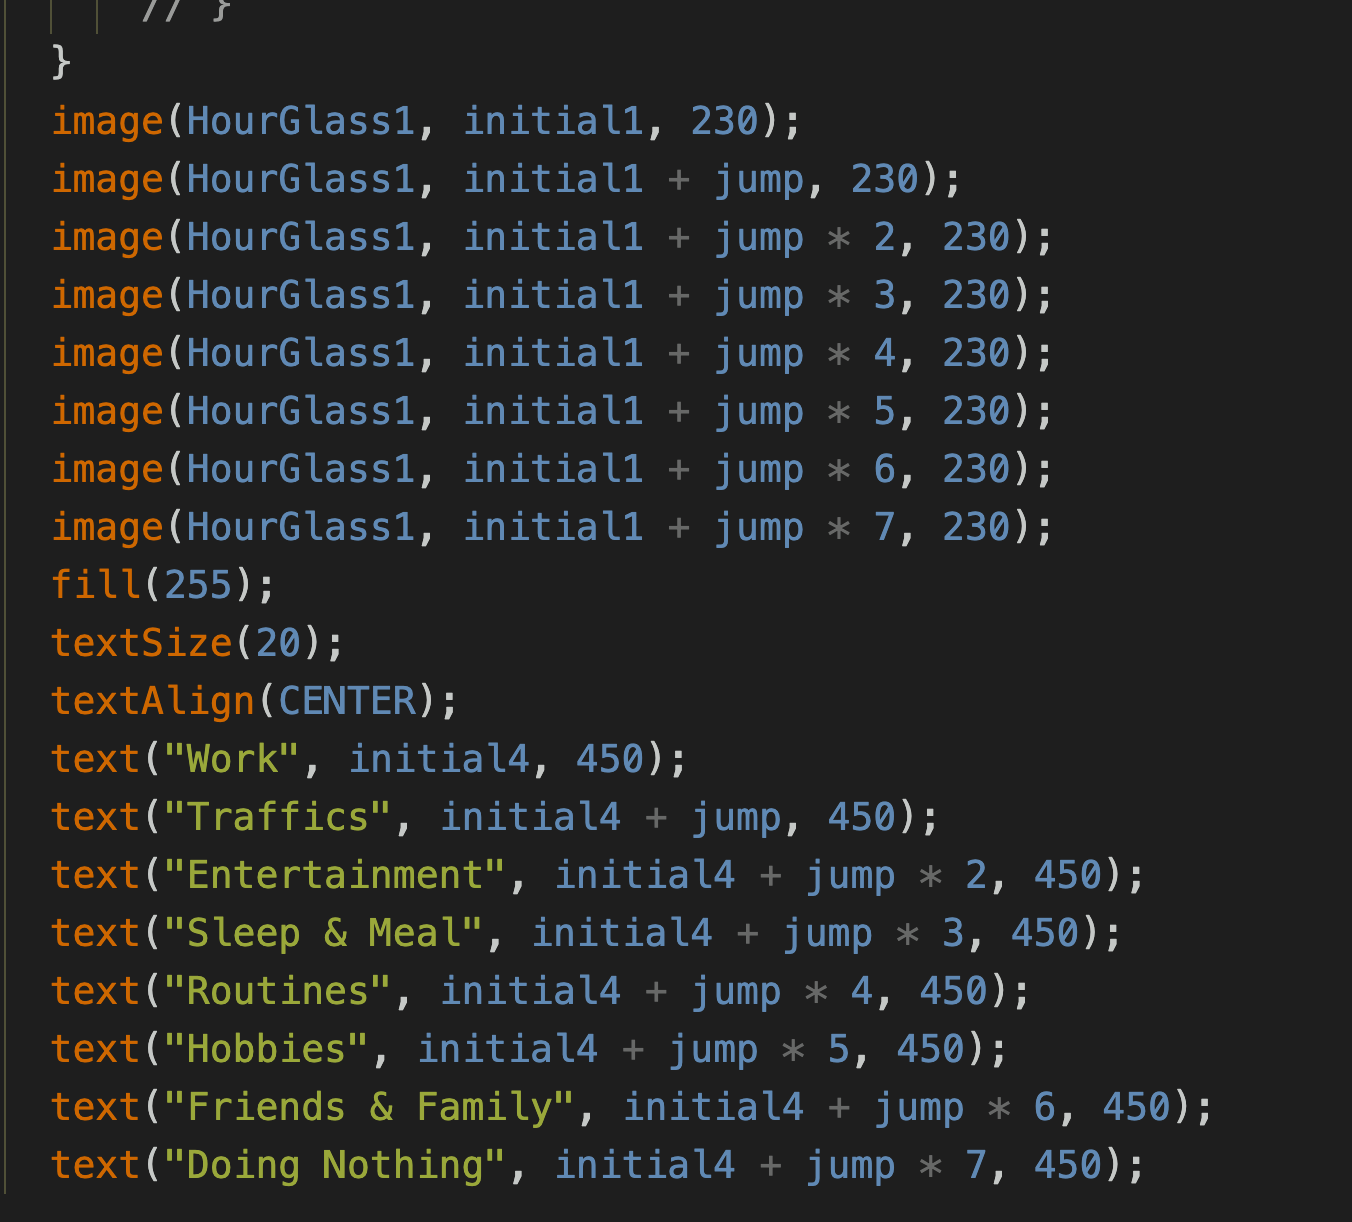
I then drew the rest of the hourglass and applied different colors to the rectangle. I used another if statement to delimit the interaction range of mouseX:
I also added texts to indicate the activity’s name of each hourglass:
Next, I mapped the mouseY value to the 0-24h time scale and displayed it above the hourglass. Below is a failed attempt due to wrong mapping:
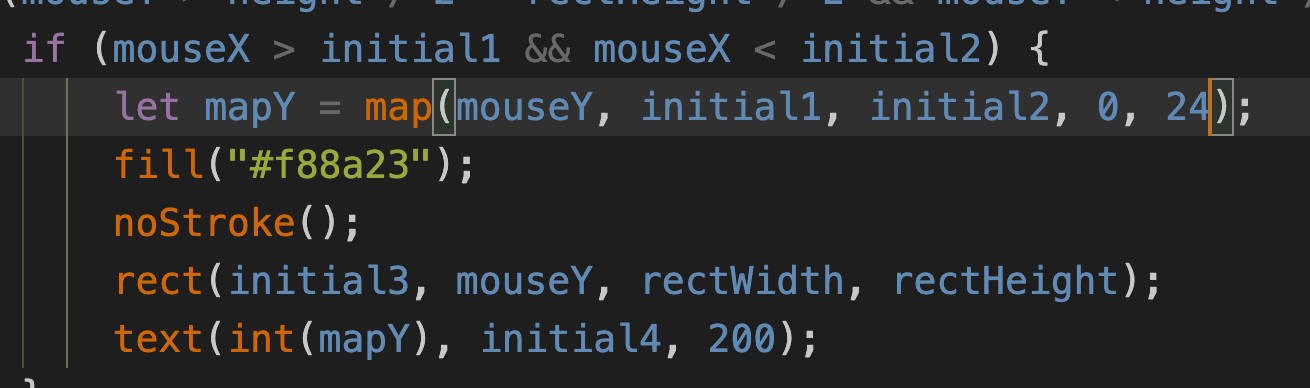
And the final version:
4. Fail to Freeze the volume and record the data when the mouse is clicked
I wanted to use lists to store the data at first:
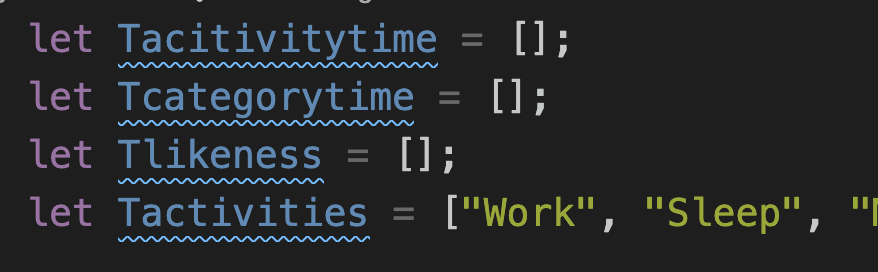
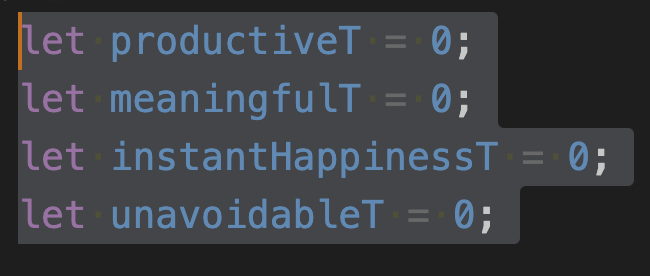
I defined a lot of variables and the data management became very complicated, so I used dictionaries to store the inputs instead:
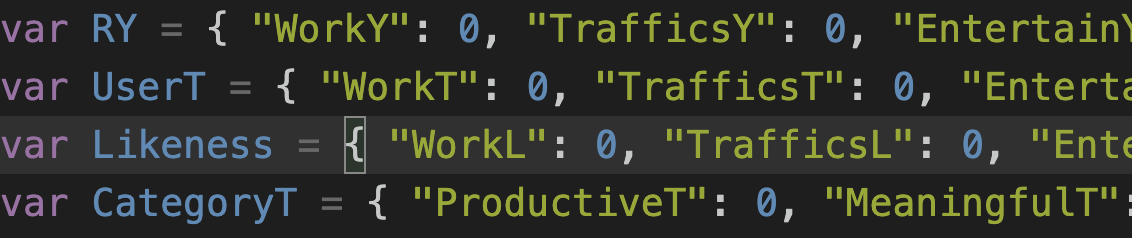
Oops, it’s not the correct format. This one is:
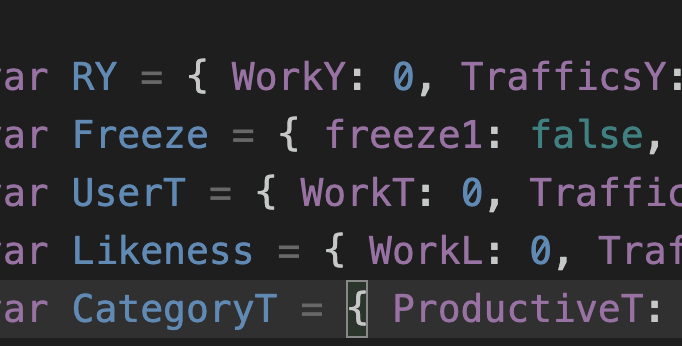
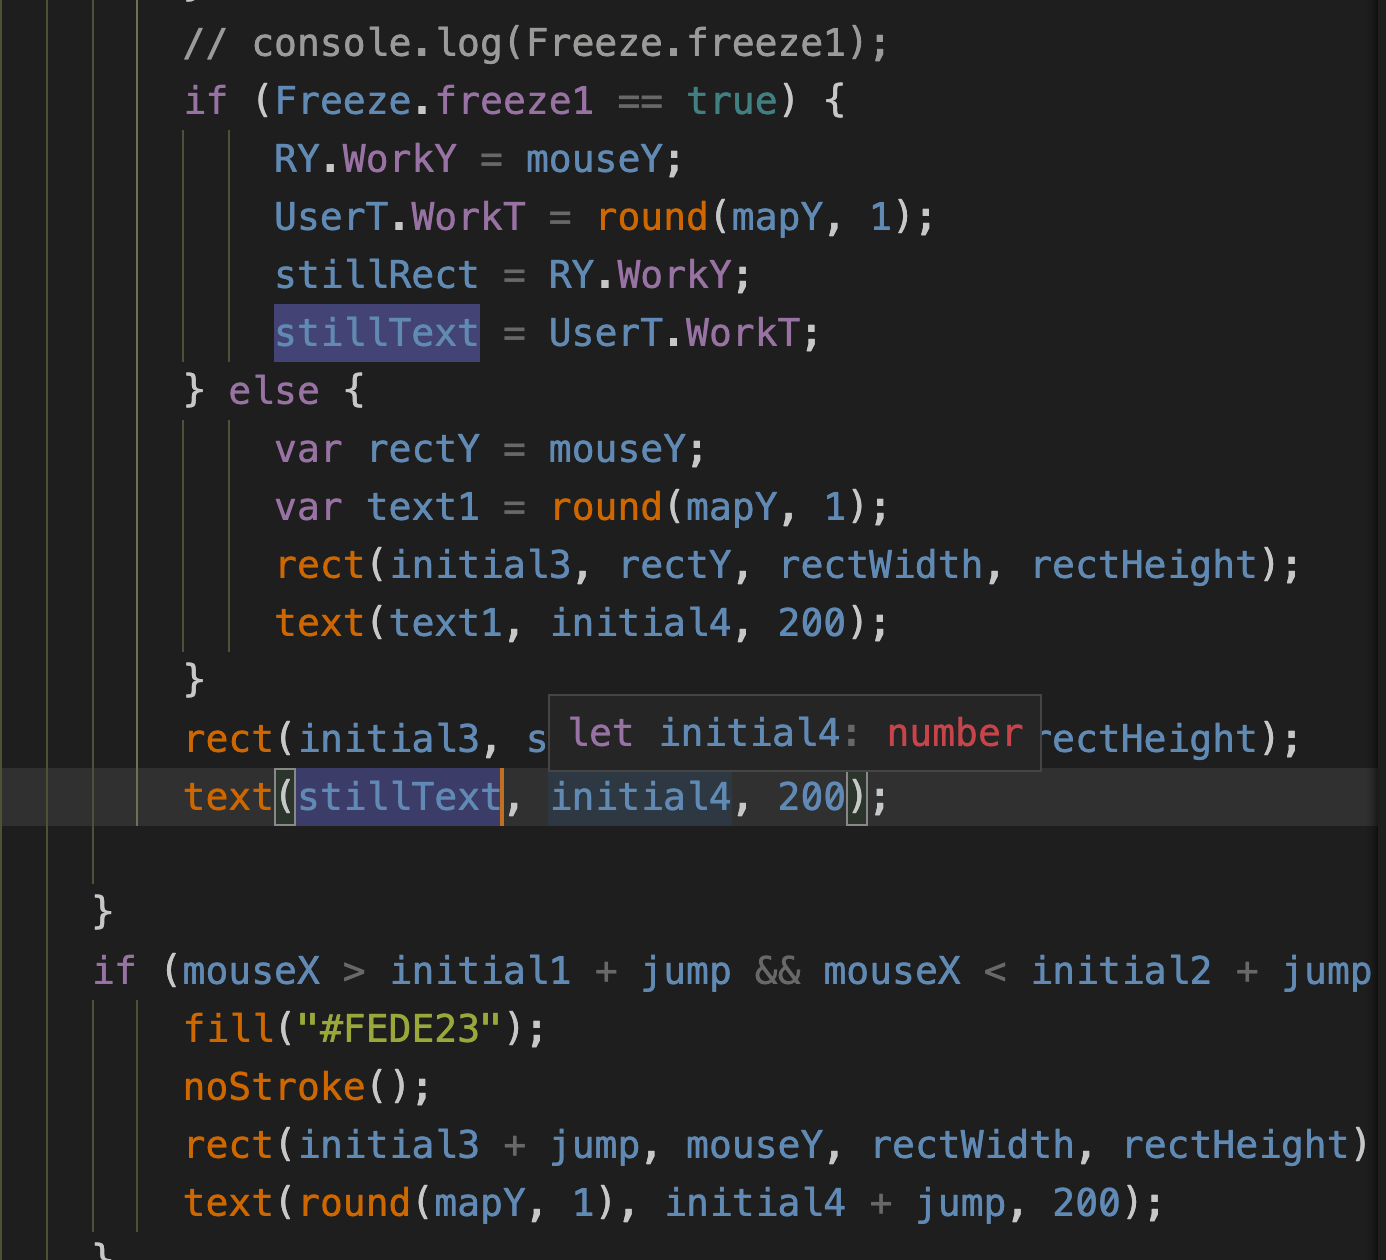
I tried to freeze the volume using a boolean value and dictionaries manipulation:
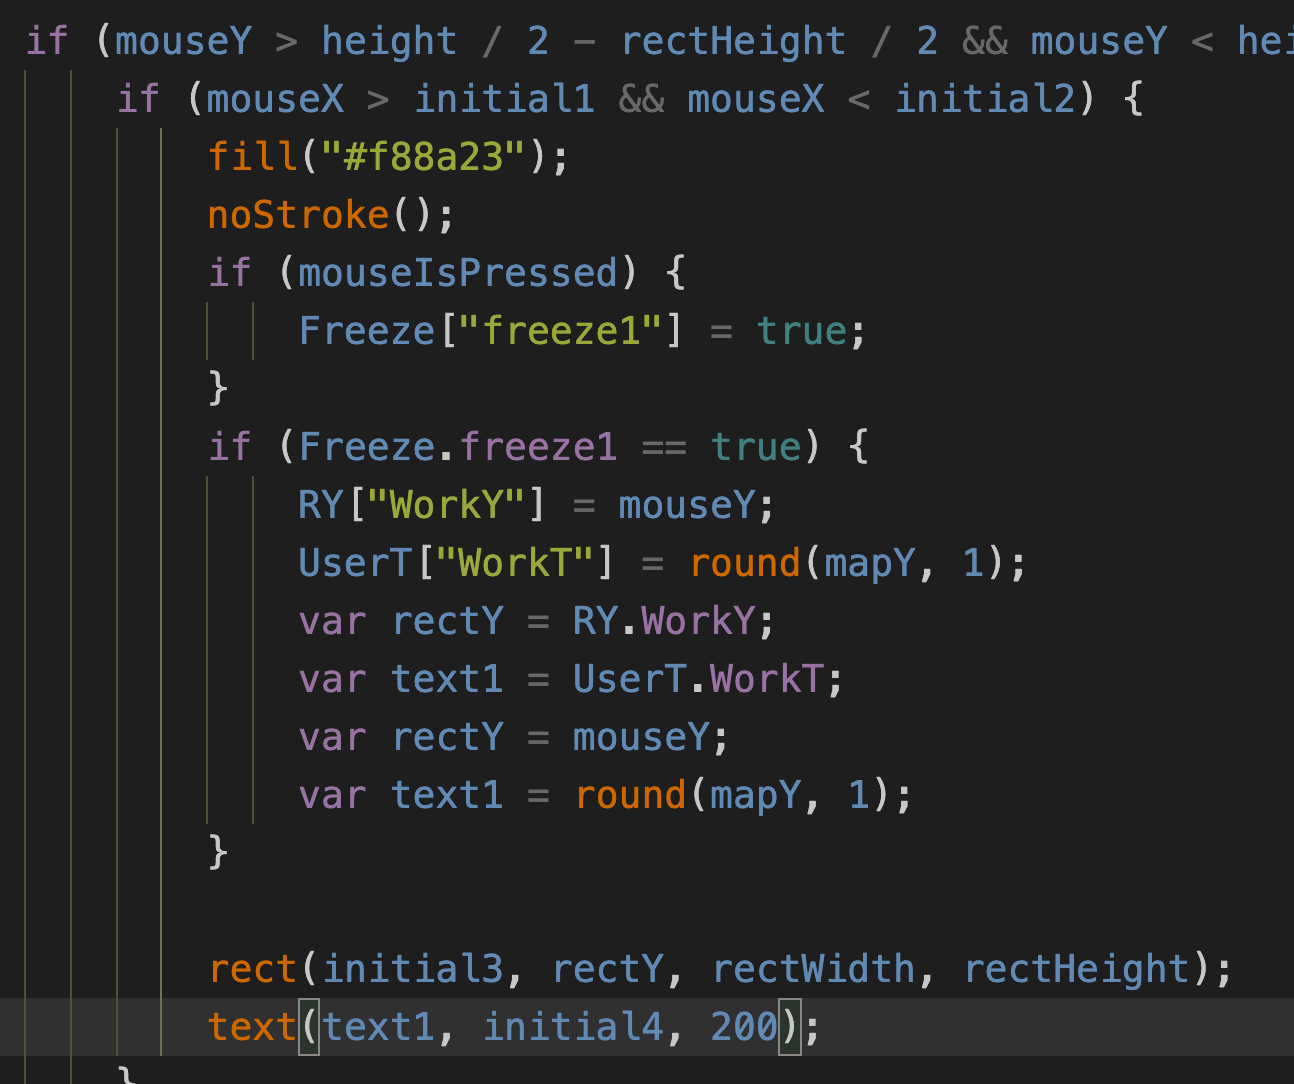
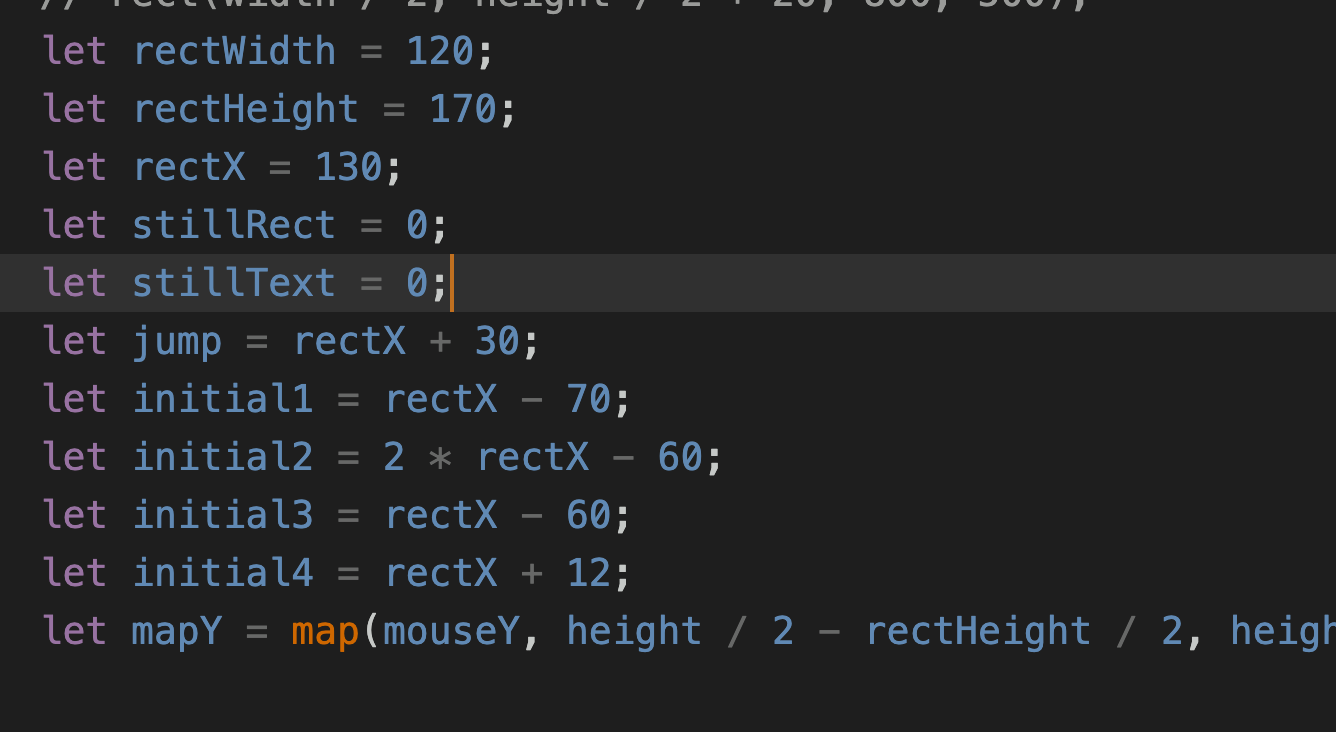
But the volume still changed when the mouse was clicked. So I drew a still rectangle outside the if (freeze == true) statement, hoping that there would be two rectangles when the mouse was clicked — one moving and one still:
I tried to use OOP to reconstruct the scene so that I can freeze the rectangle easily. But during the process, I found that I couldn’t store the user inputs if I used OOP to draw the rectangles. I’m still figuring out this problem.
Reflection
In this week’s recitation, I prototyped the most interactive page of my final project. I practiced embedding js canvas on a webpage and integrating the page with the HTML title. I also successfully create certain visual effects and interactions (mouse movements and hourglass construction). However, my goal is:
- when the user moves the mouse over the hourglass, the volume rectangle will change according to the mouseY position and a text will indicate the number of hours.
- when the user clicks the mouse, the volume rectangle freezes, and the number of hours will be stored in the dictionary.
And I encountered the dilemma:
- I failed to use a variable “freeze” to freeze the rectangle upon clicking.
- However, if I use OOP, I cannot store the inputs in a list or a dictionary.
I’m still trying to solve this problem and make progress on my final project.