10.R JSON Visualization
To Cure
Demo
Coding
Fabrication
1. Map drawing
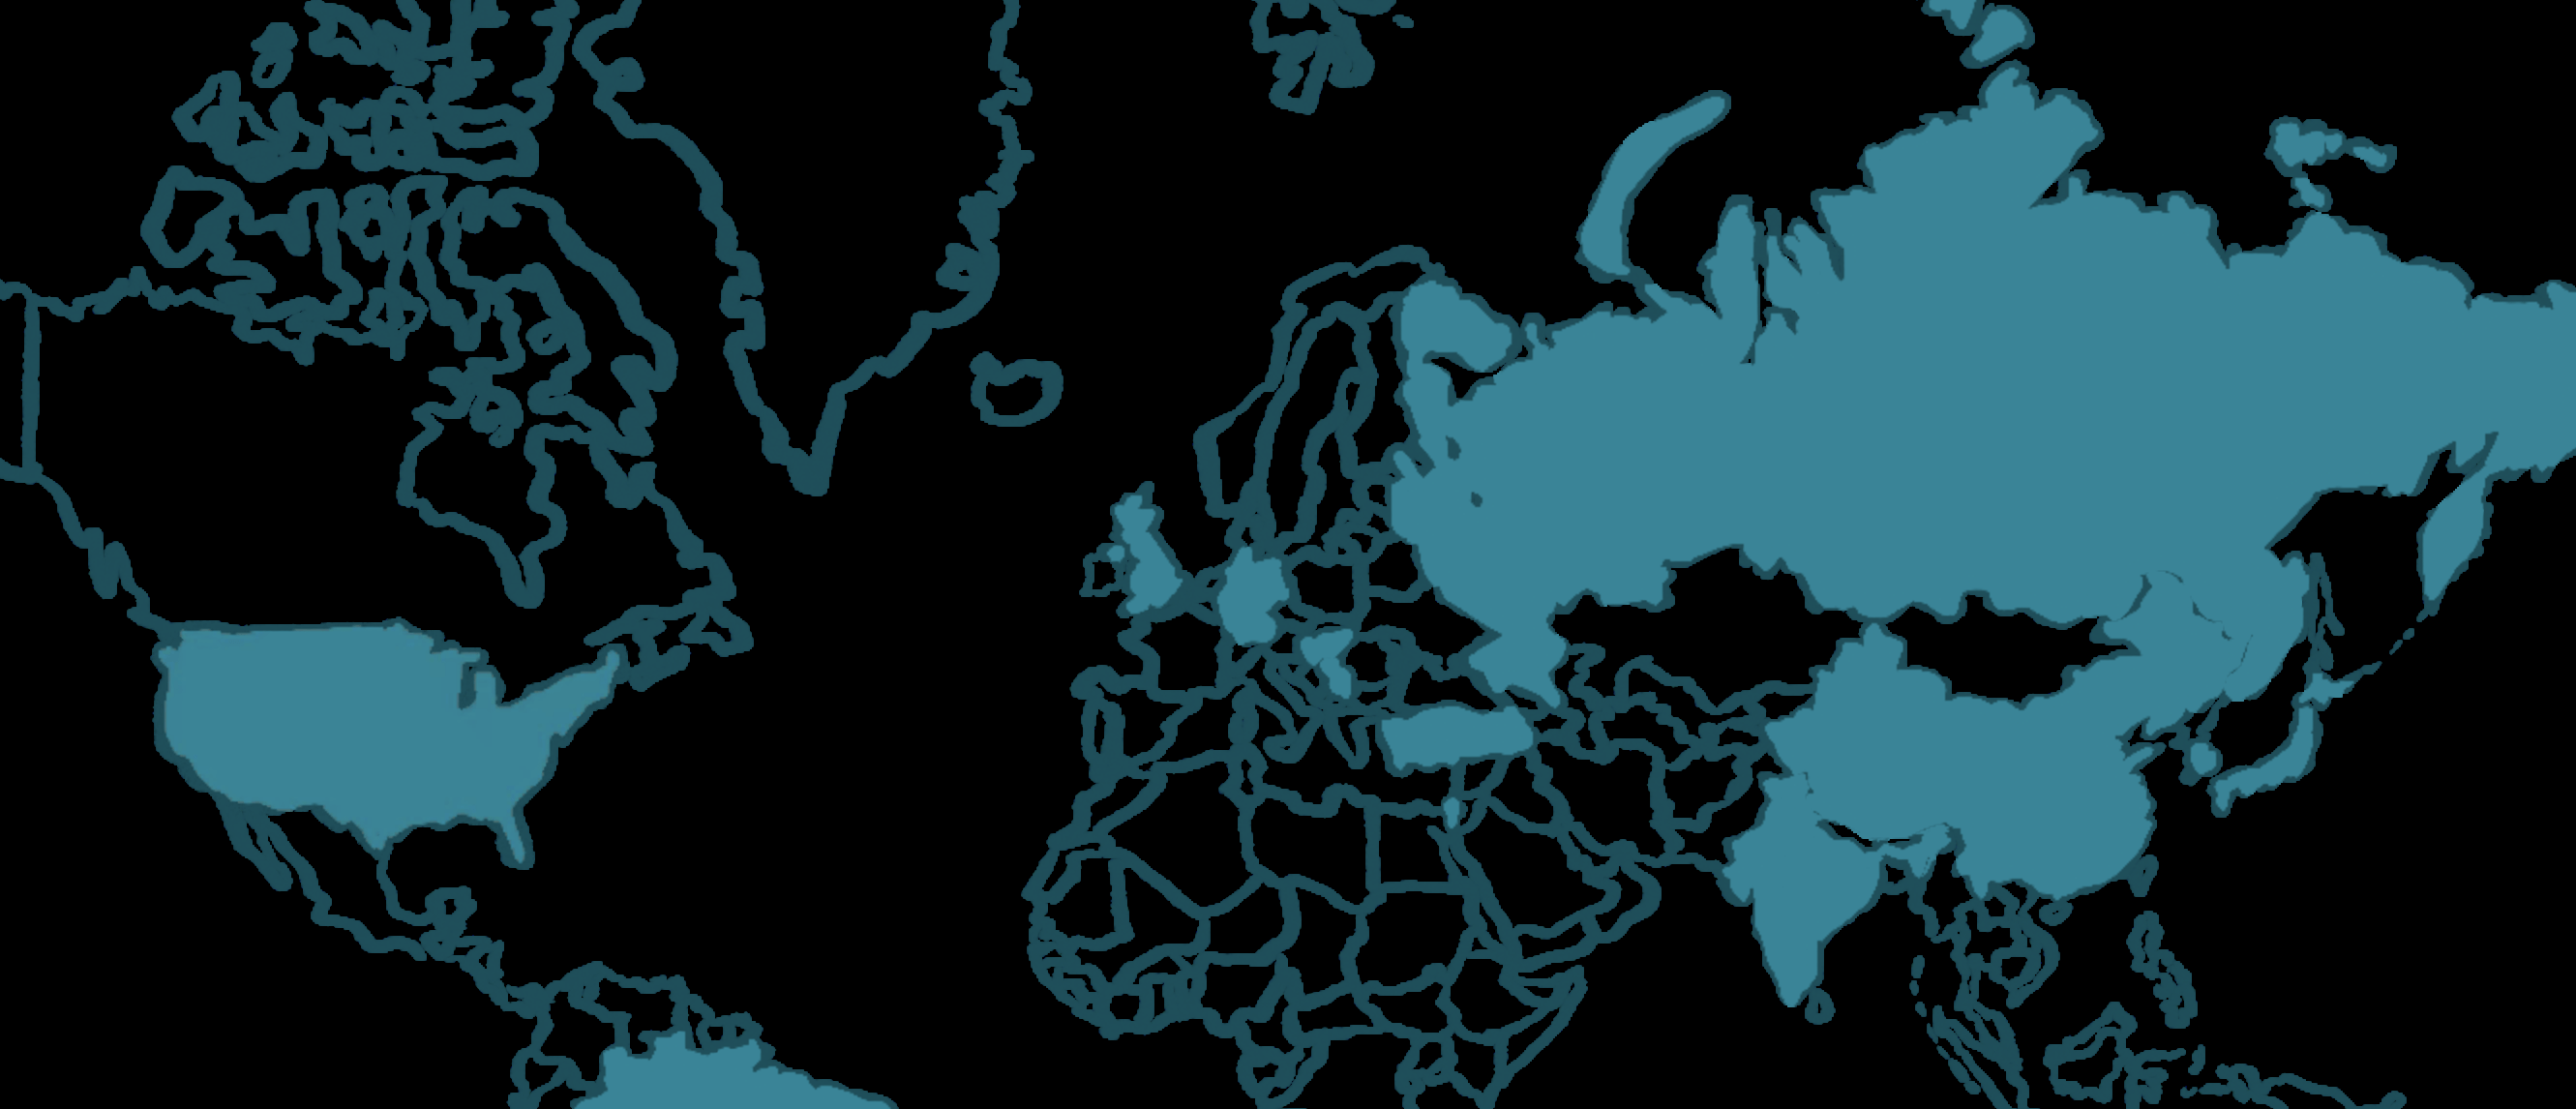
Firstly, I imported the map given by professor Moon in the 10.2 In-class Exercise to procreate (a drawing software) and outlined the mainland.
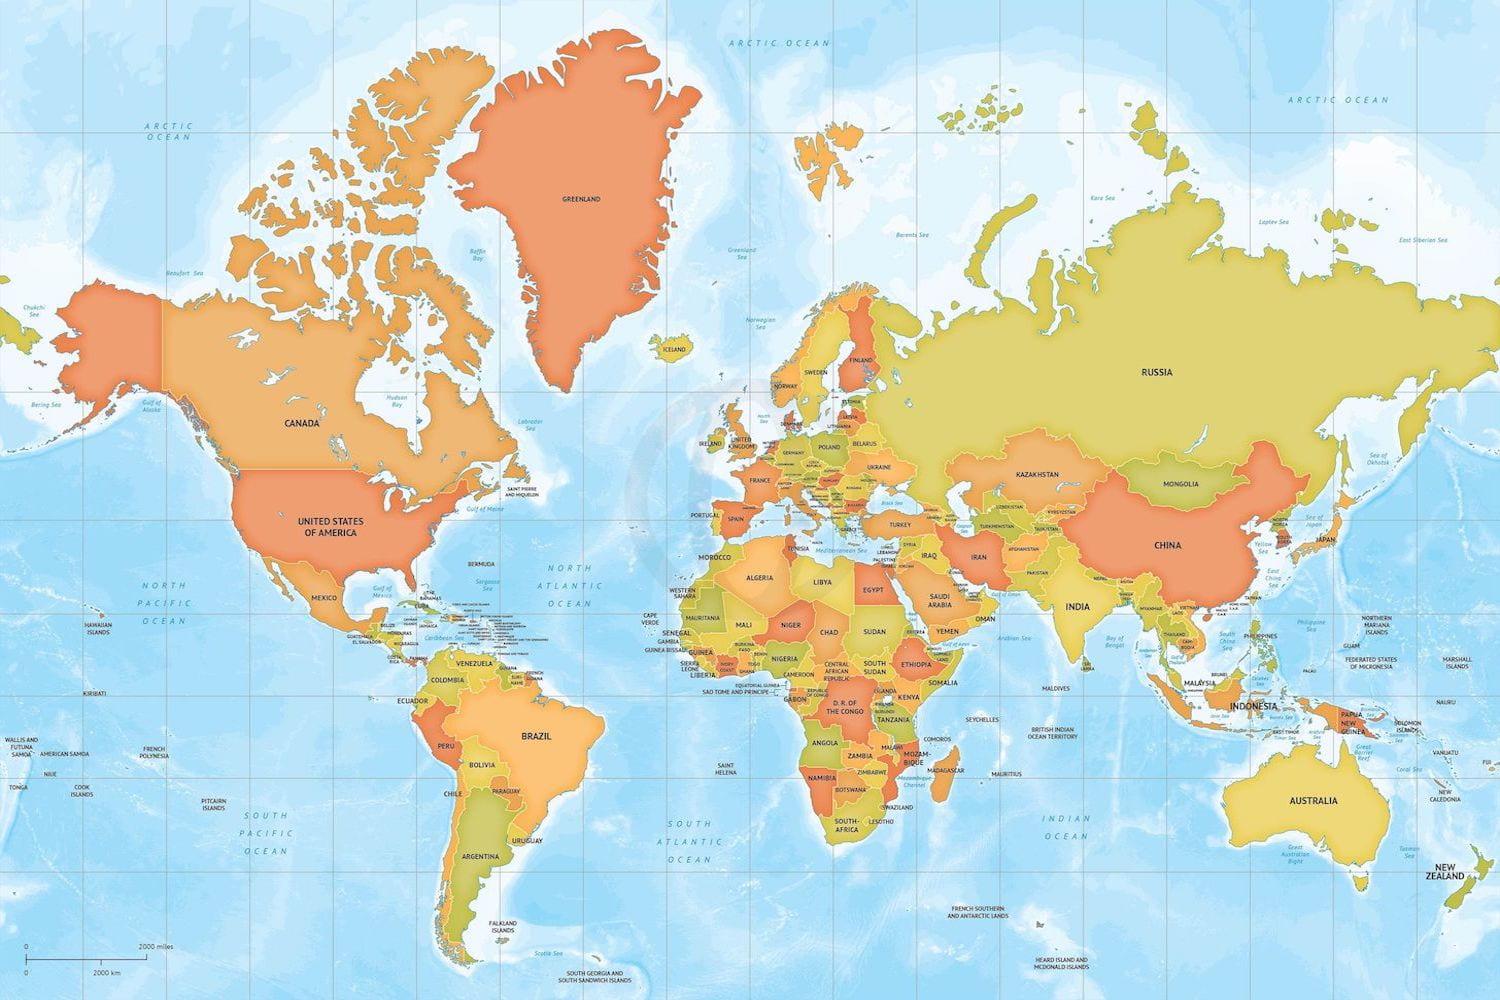
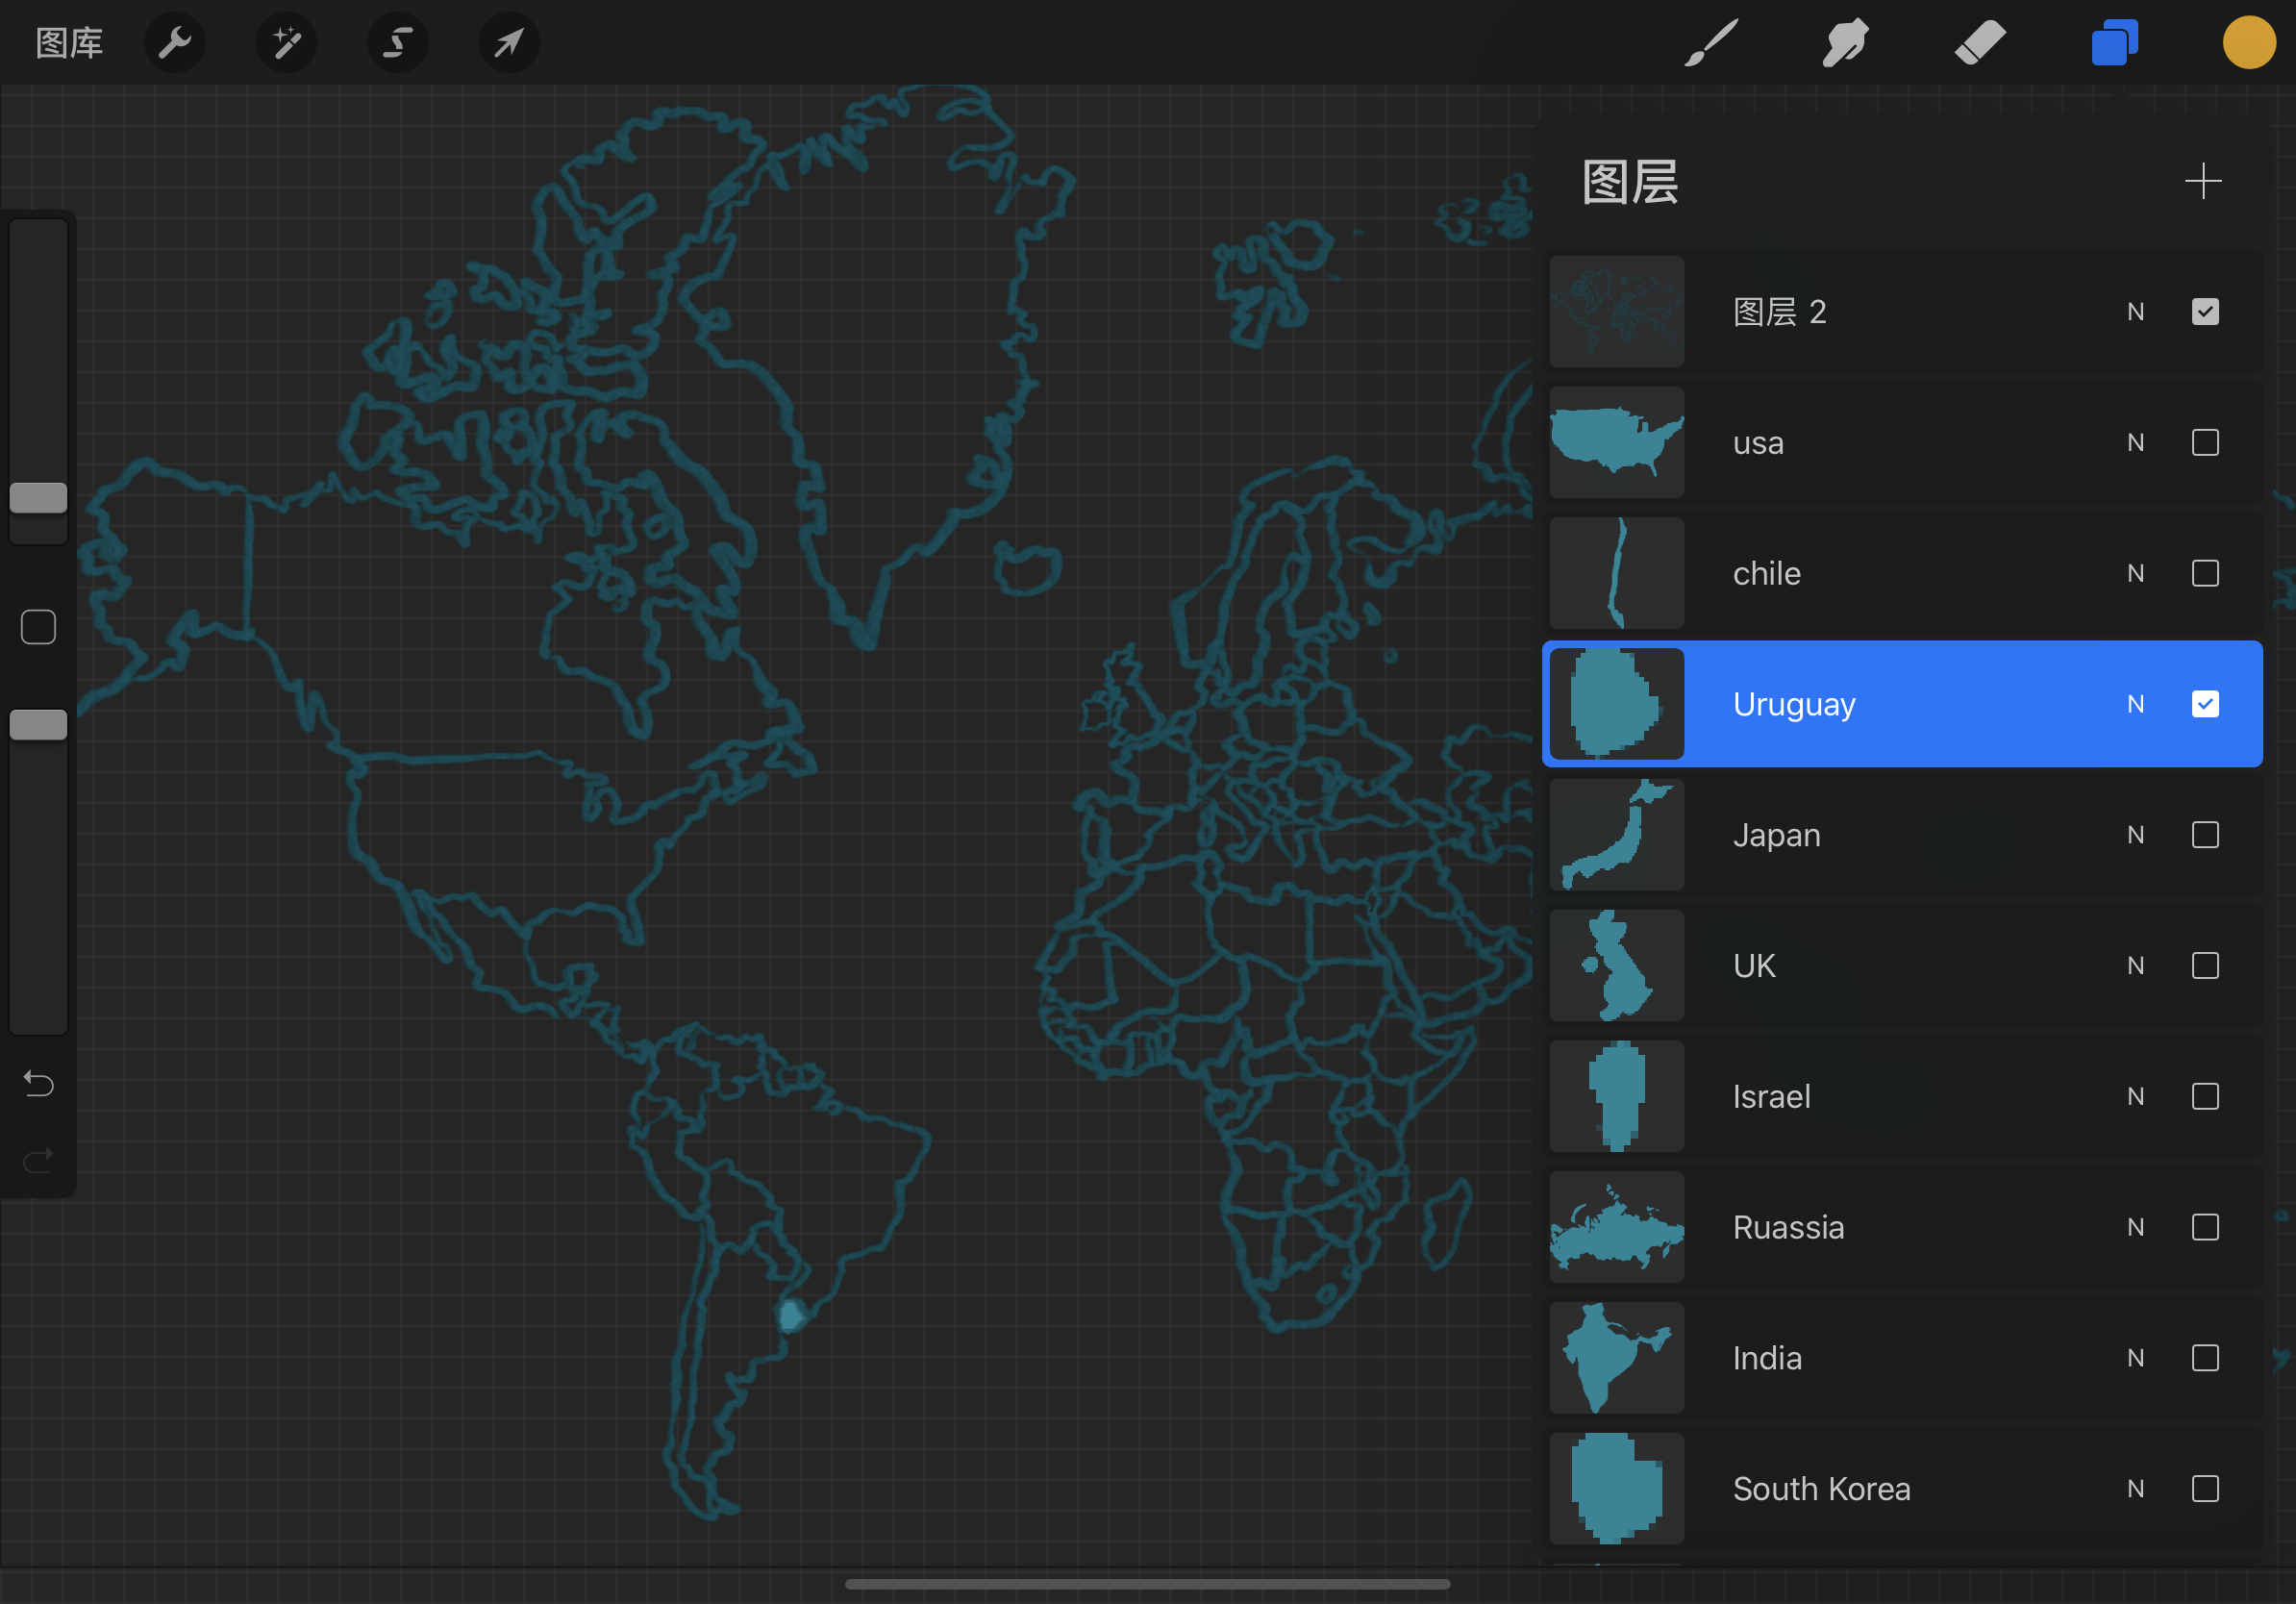
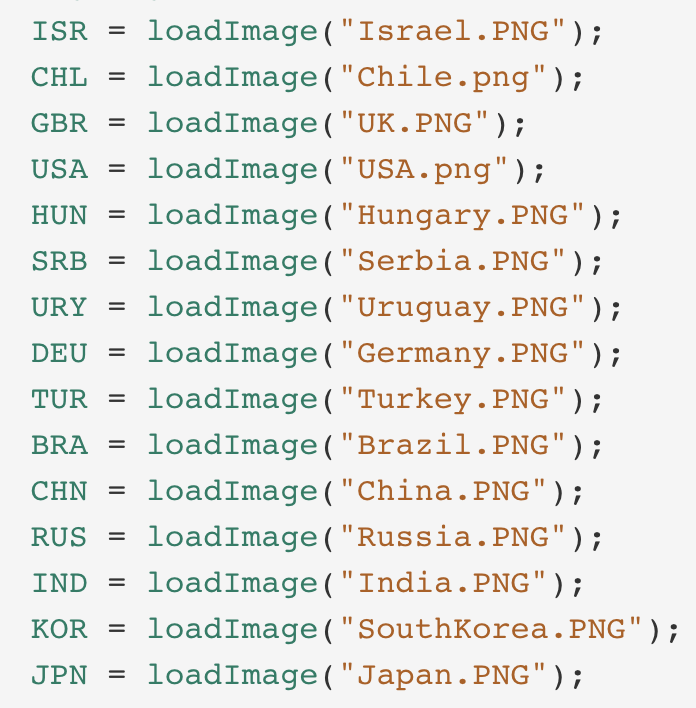
I filled the countries that contain JSON data with light blue and kept the filled colors in separate layers. Then I exported each layer in PNG format and imported them to onlineProcessing. At first, I tried to associate each loaded picture with the iso code of the country and used the extracted data (iso_code) to call the image:
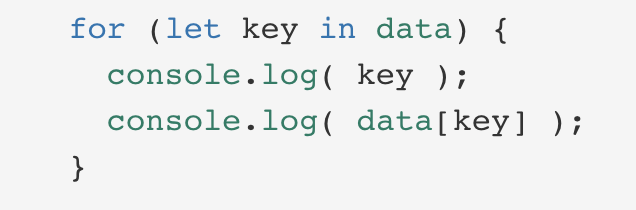
I had trouble storing the image variables in an array and constantly got error messages. So I created an array “highlight” to store the loaded pictures (filled countries) without naming them, following the order of the JSON data:
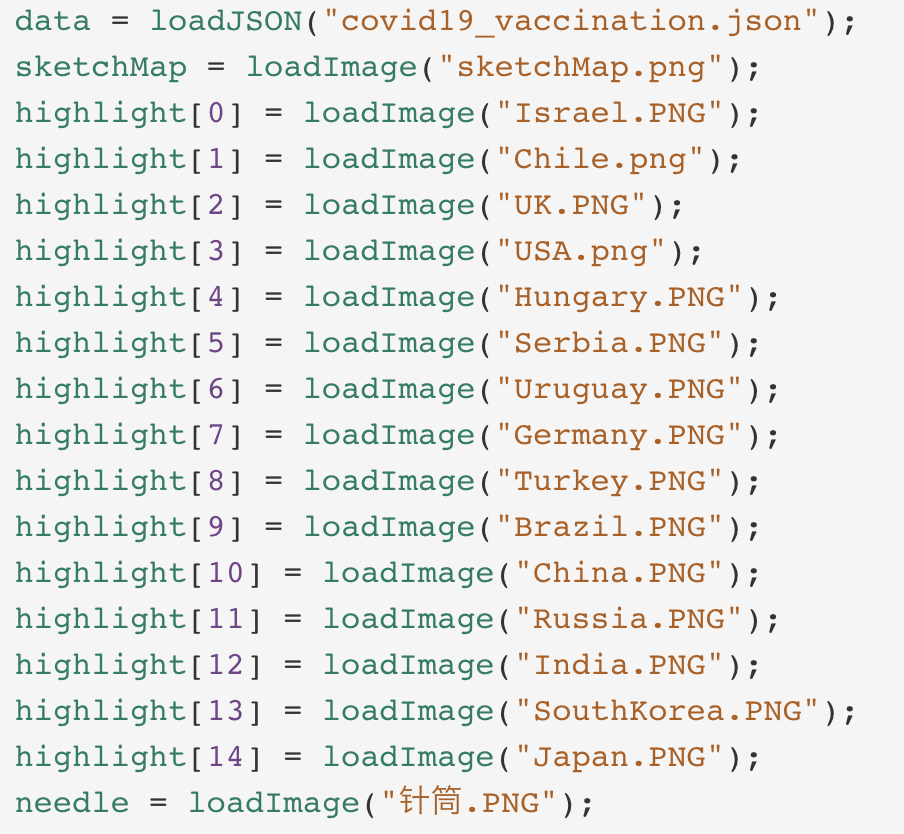
The images could be called in this way:
![]()
I tested the position of the images before importing data:
2. Data importing
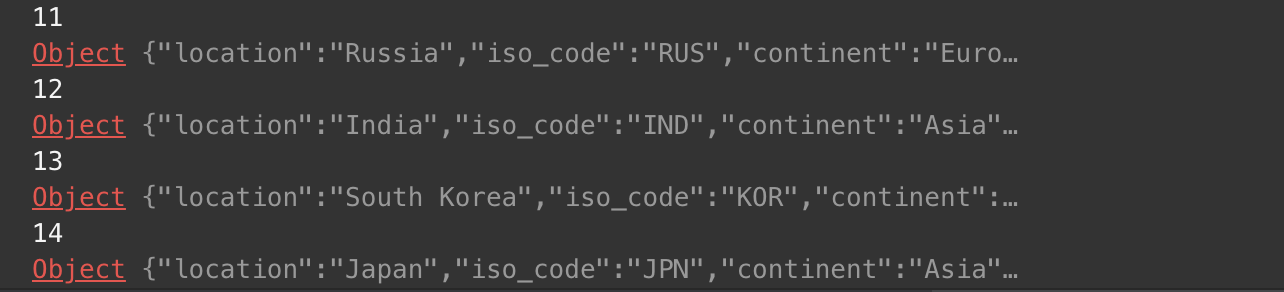
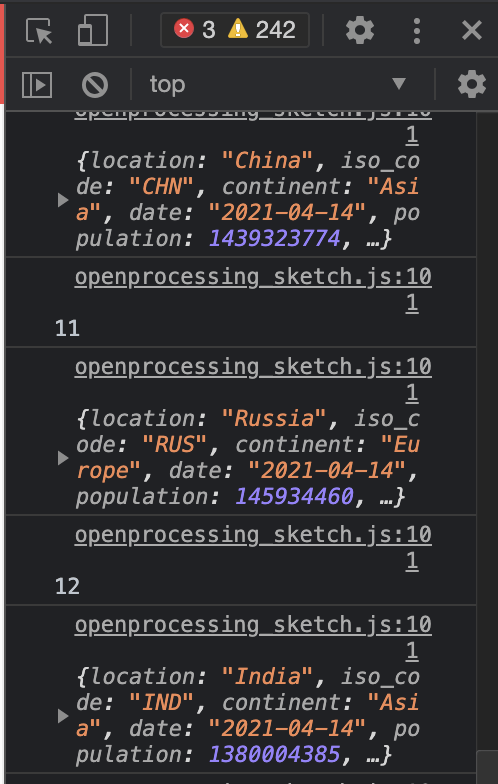
I used the variable “data” to store the loaded JSON file and checked the data’s content through “console.log”.
3. Mouse click interaction
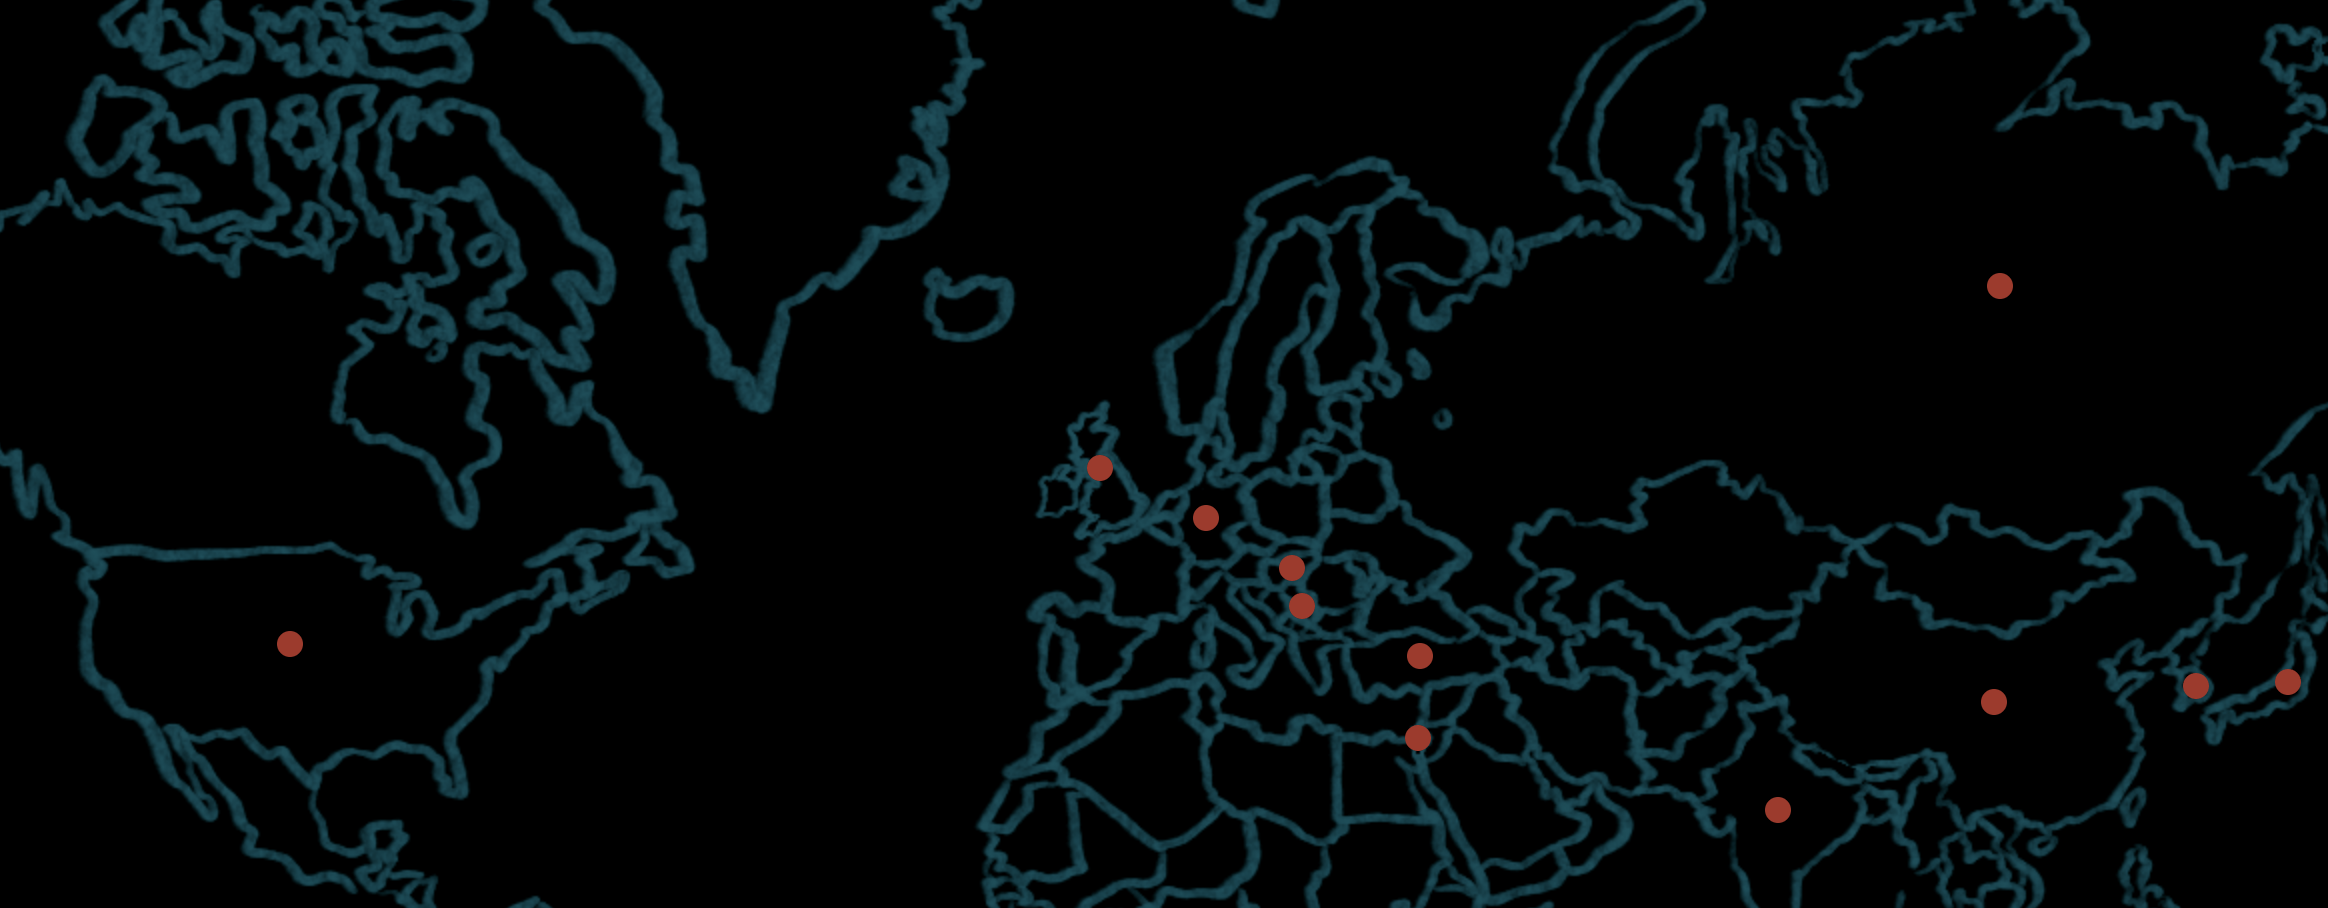
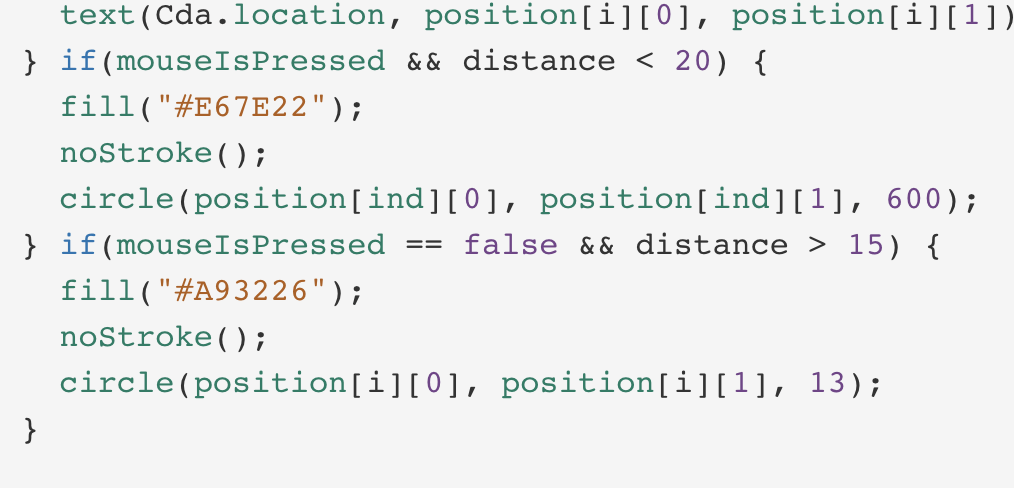
When designing the interaction, I wanted to create three circles to delimit the effective region for each country, so that the countries with different shapes could be covered. However, since some of the countries lied very close to each other and some of them were too small, the method didn’t yield a satisfying result. Therefore, I created some red points to indicate the available country’s location and let users click within these points to view detailed information. I used the mouse position to determine the effective region of mouse interaction and stored the positions in an array (this method is inspired by professor Moon’s code in the in-class exercise):
![]()
![]()
I solved the problem by using another if statement to limit the drawing of red points:
4. Needle tubing
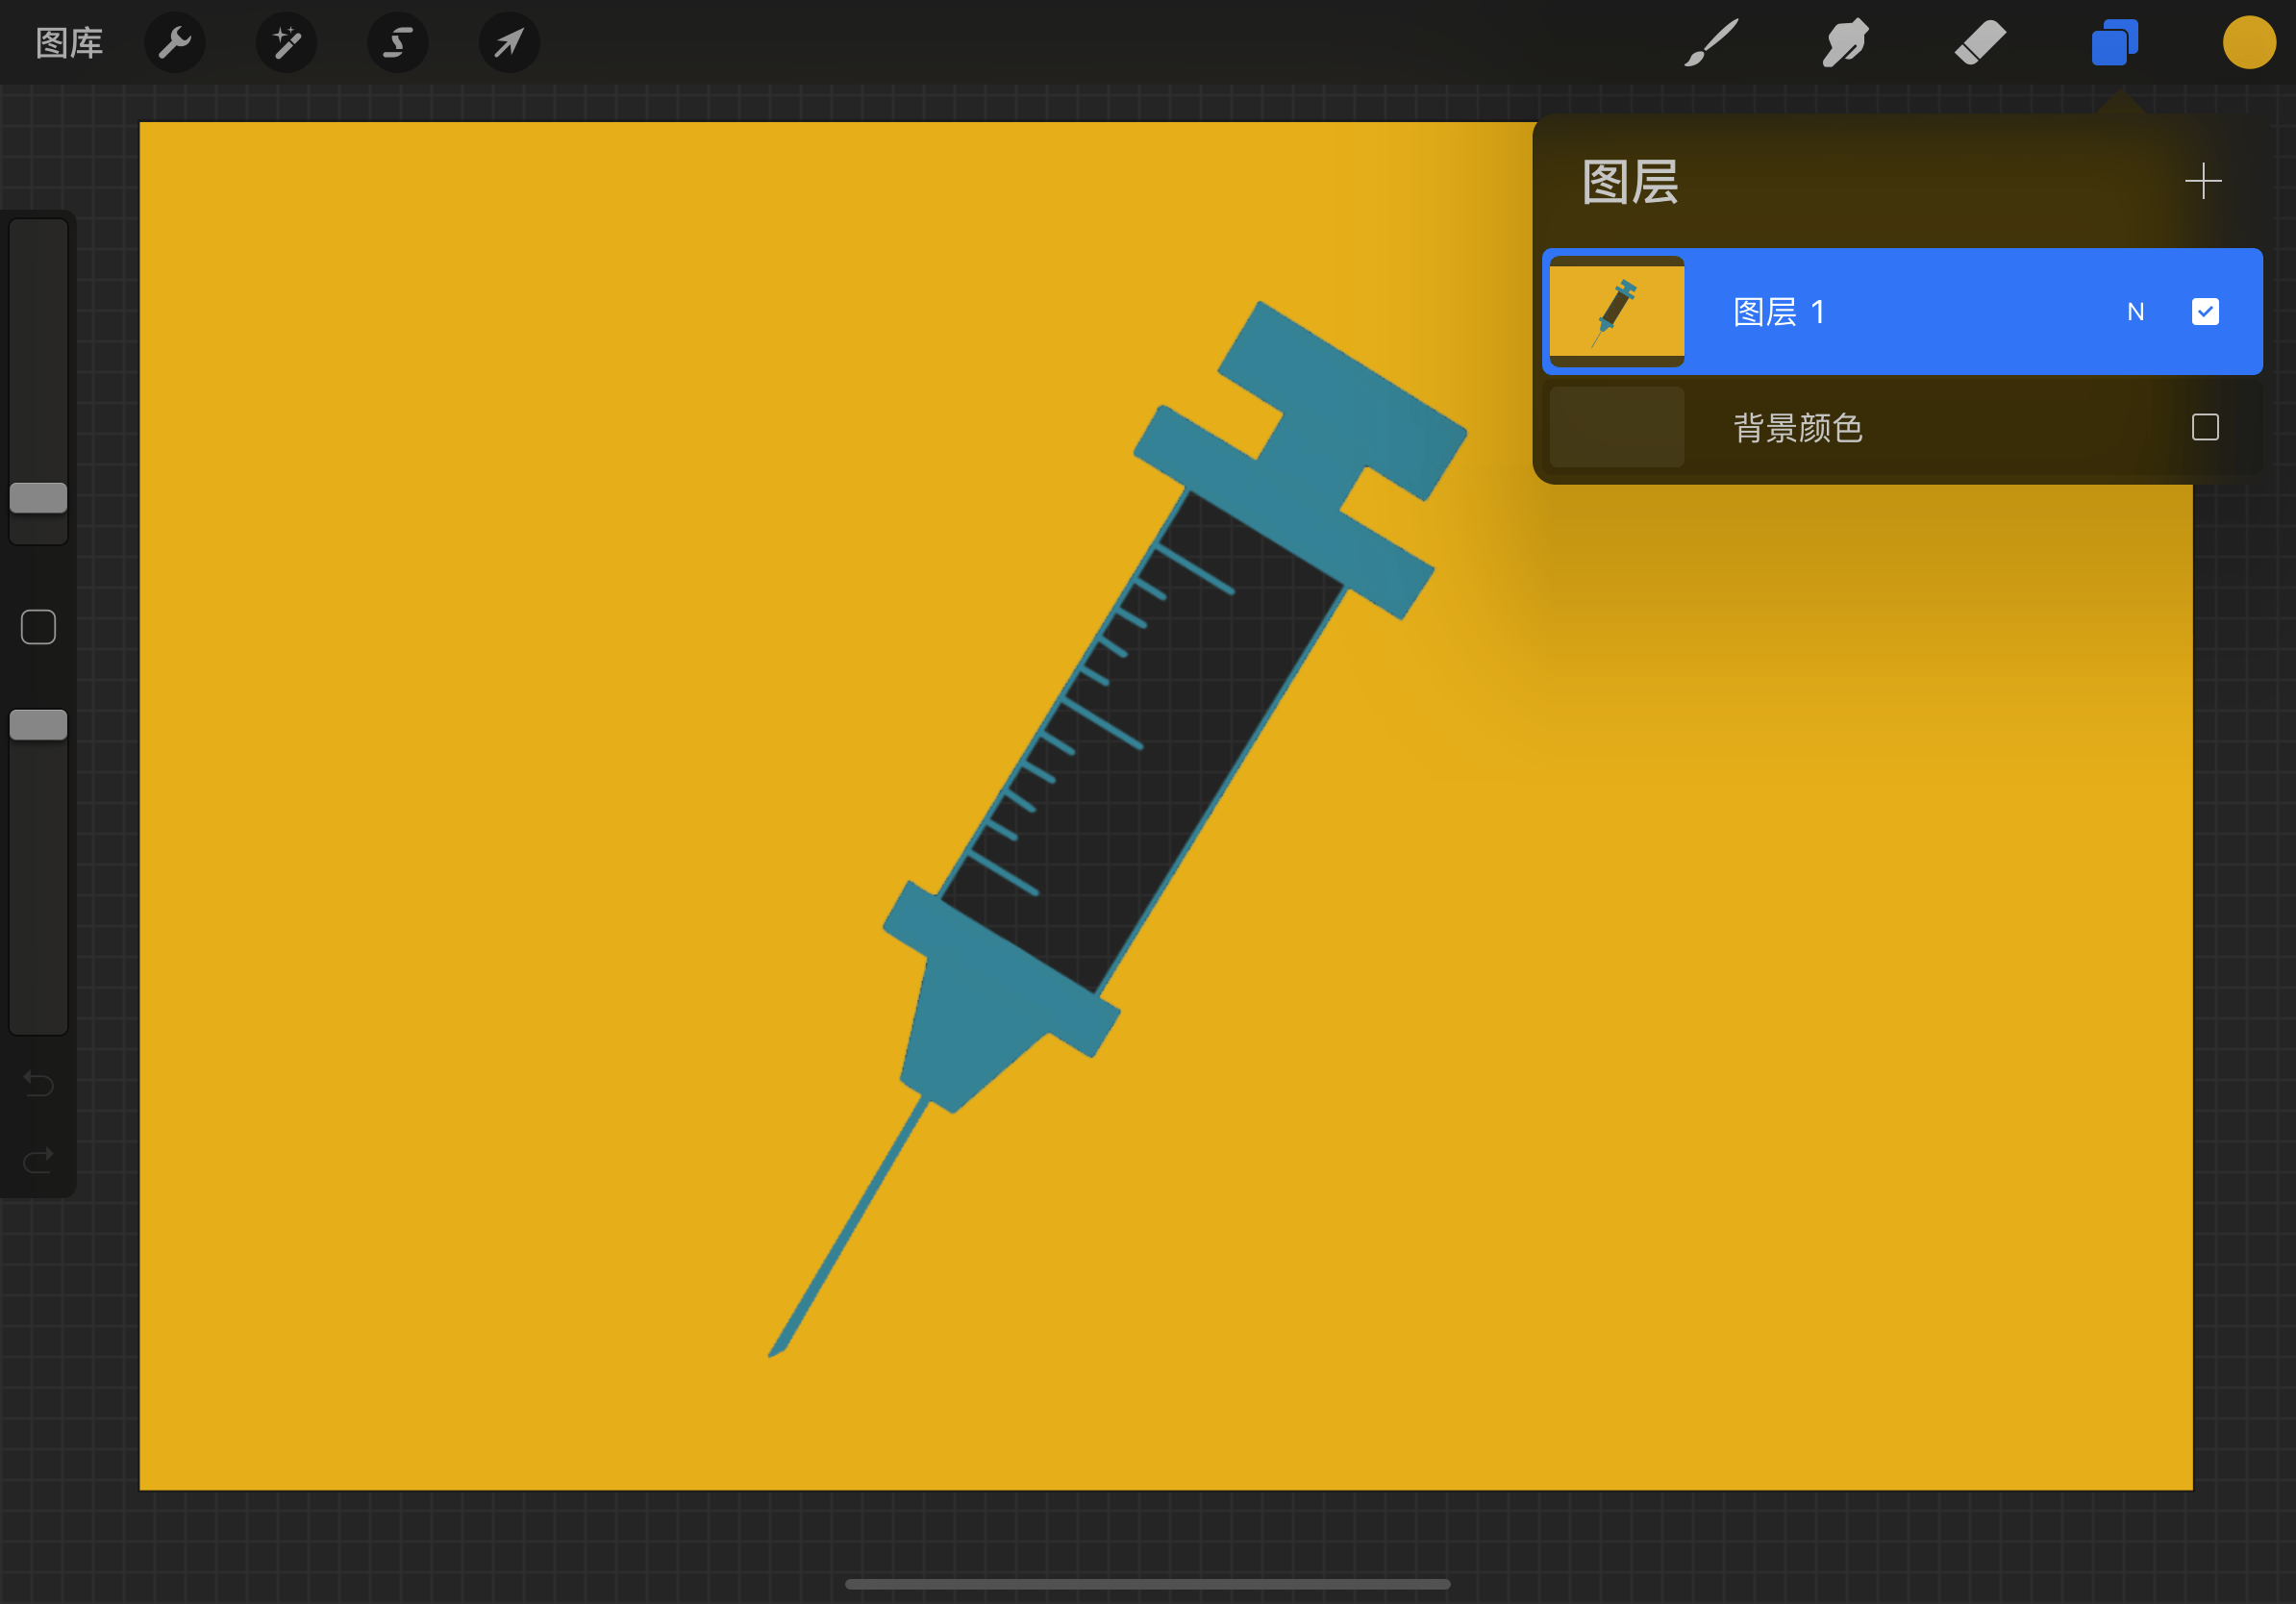
Inspired by the meeting with professor Moon, I drew a needle tubing in the procreate, leaving the tube empty, and exported it as a transparent PNG file:
I then made it appear when users click on the red points:
The vaccination rates of a lot of countries (with a fewer vaccinated population per hundred) couldn’t be shown. I spent some time adjusting the height of the rectangle to show as visualize as much data as possible:
I also tried to adjust the position of the needle tubing according to the mouse position but failed because the width and height of the PNG image were fixed:
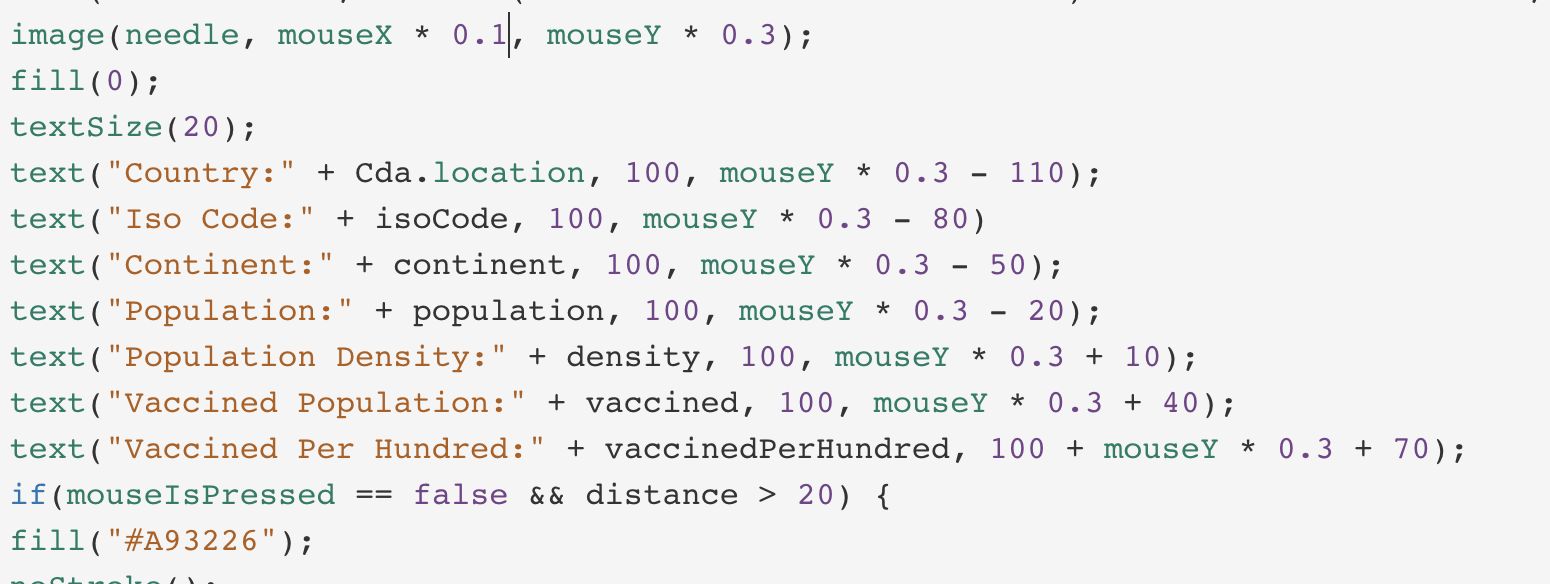
I also adjusted the text according to the mouse position and failed again, because it was really inconsistent:
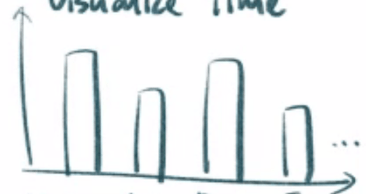
5. The histogram
At first, I tried to draw a histogram like this:
I turned the “vaccine_per_hundred” value into a ratio that decides the height of each bar:
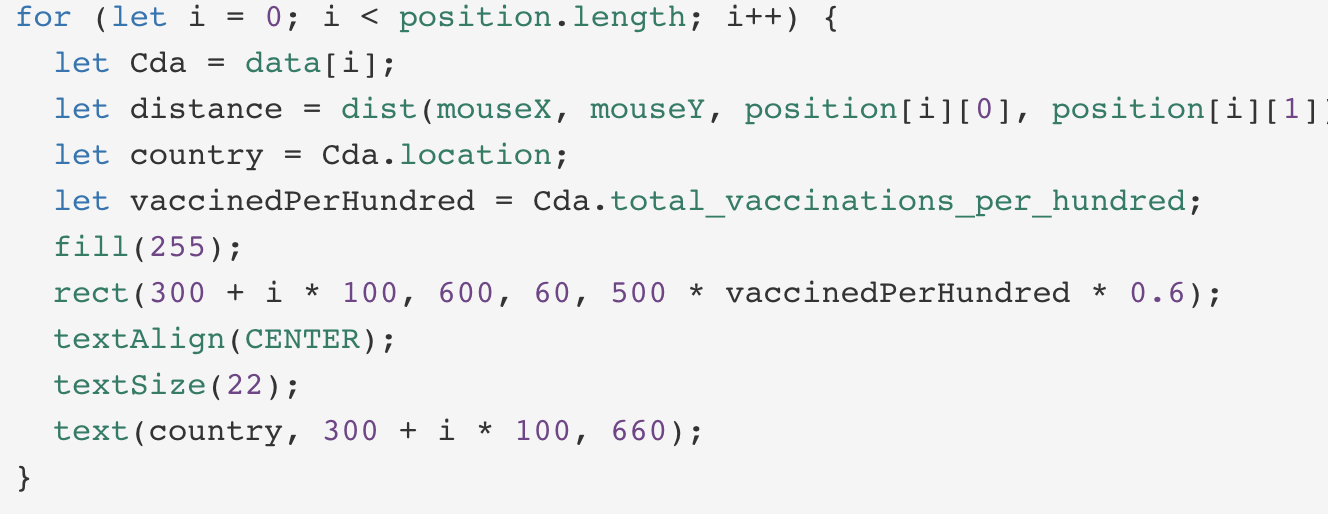
Sadly, I got this because the rectangles were drawn upside-down:
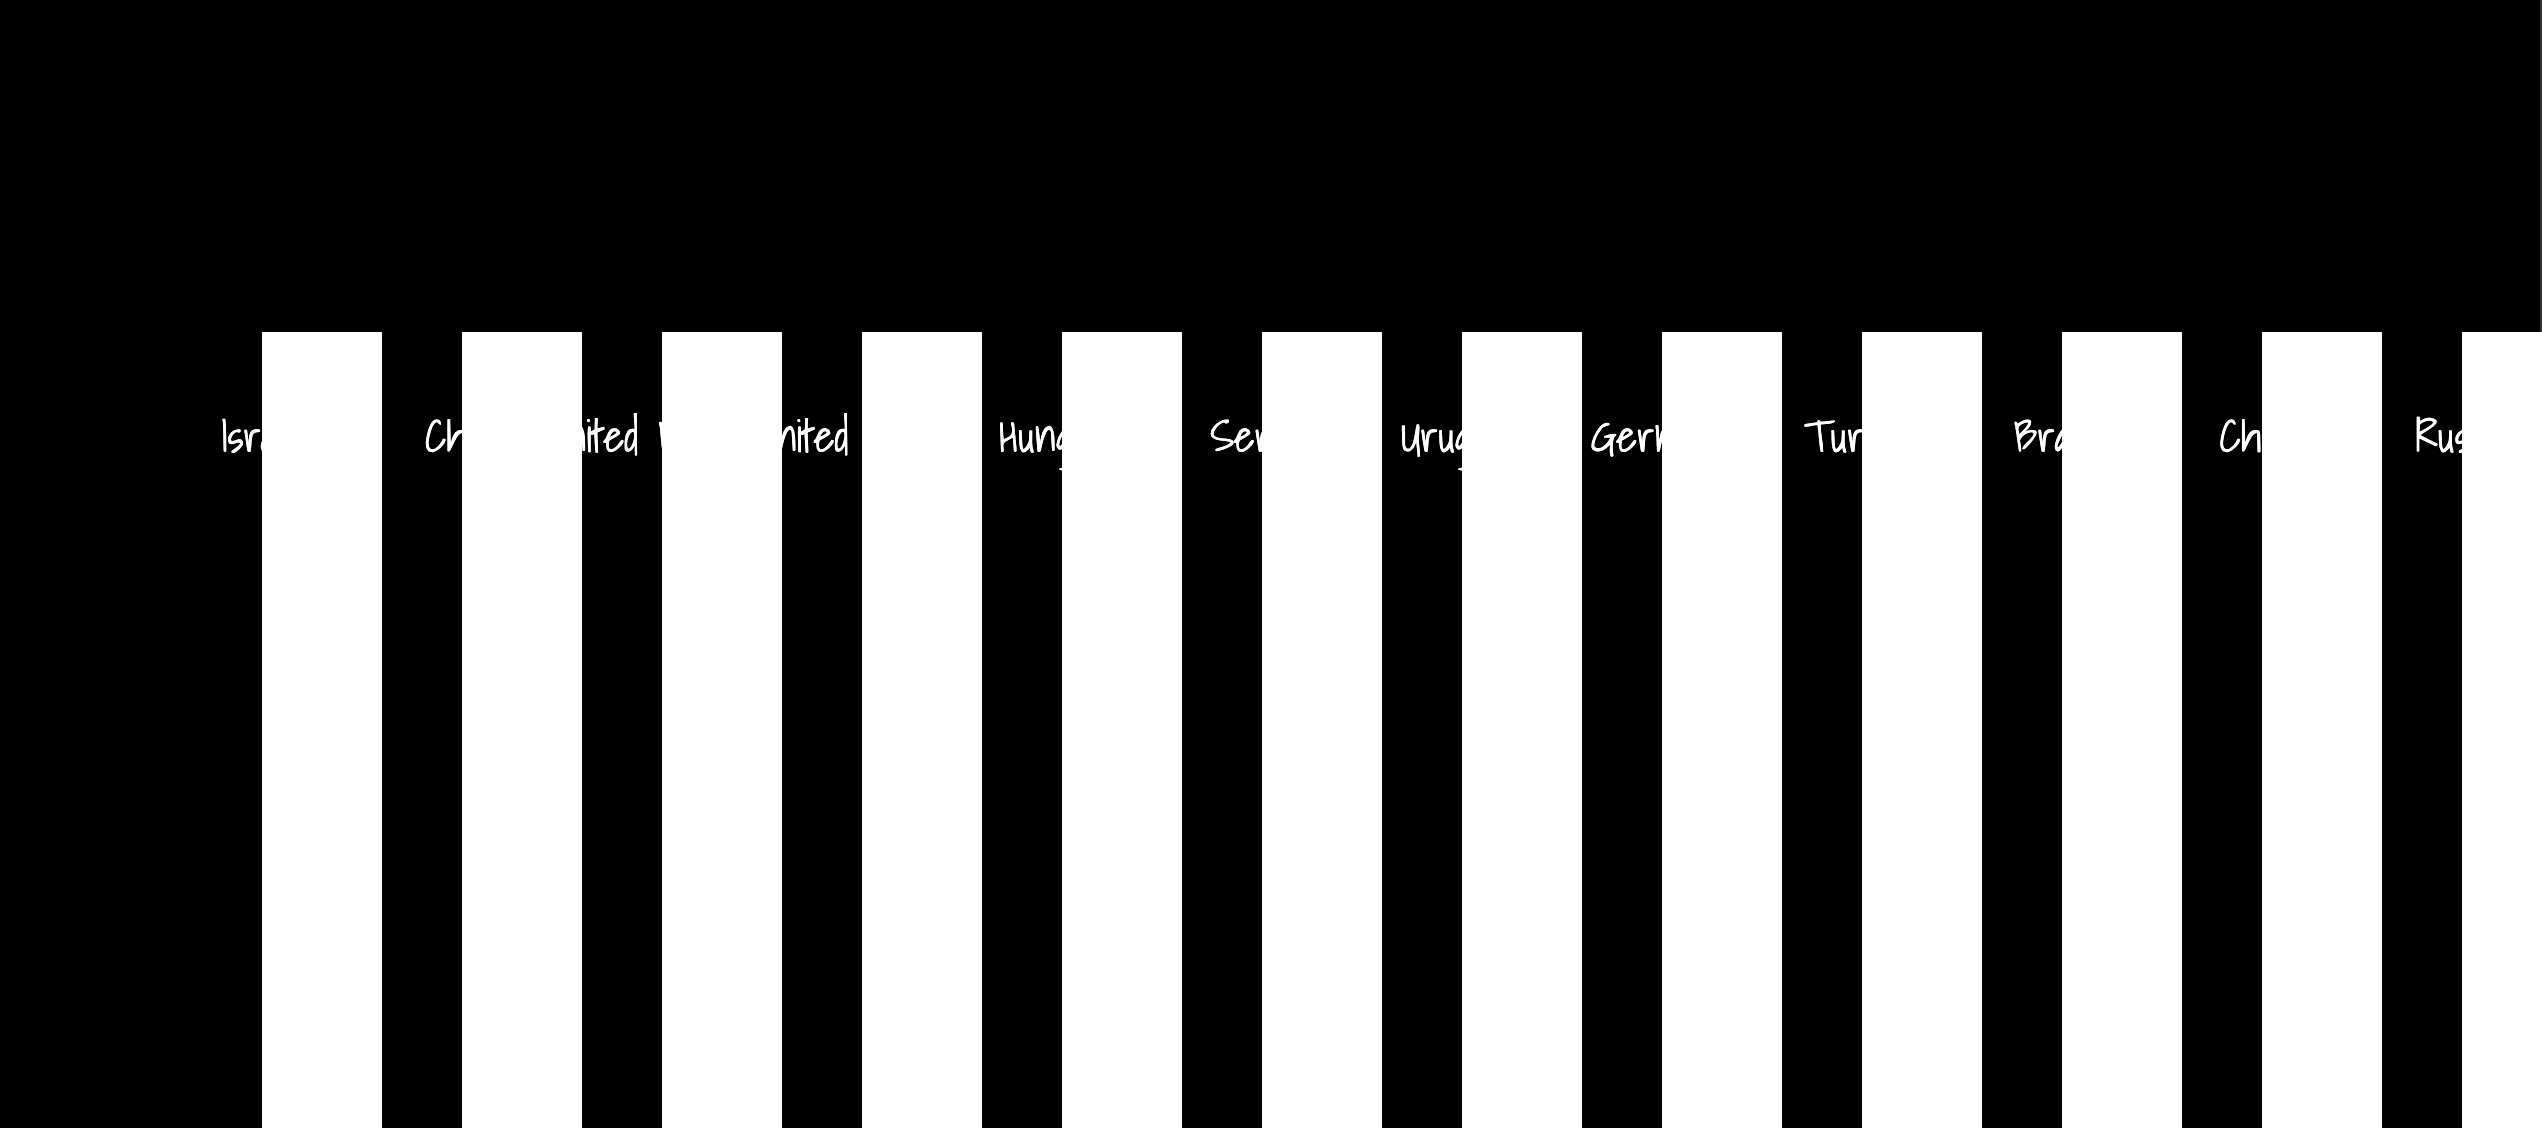
Later I figured out that I can use “rectMode()” to adjust the drawing direction. But at the point, I just used an upside-down method to draw the histogram since it also looked good:
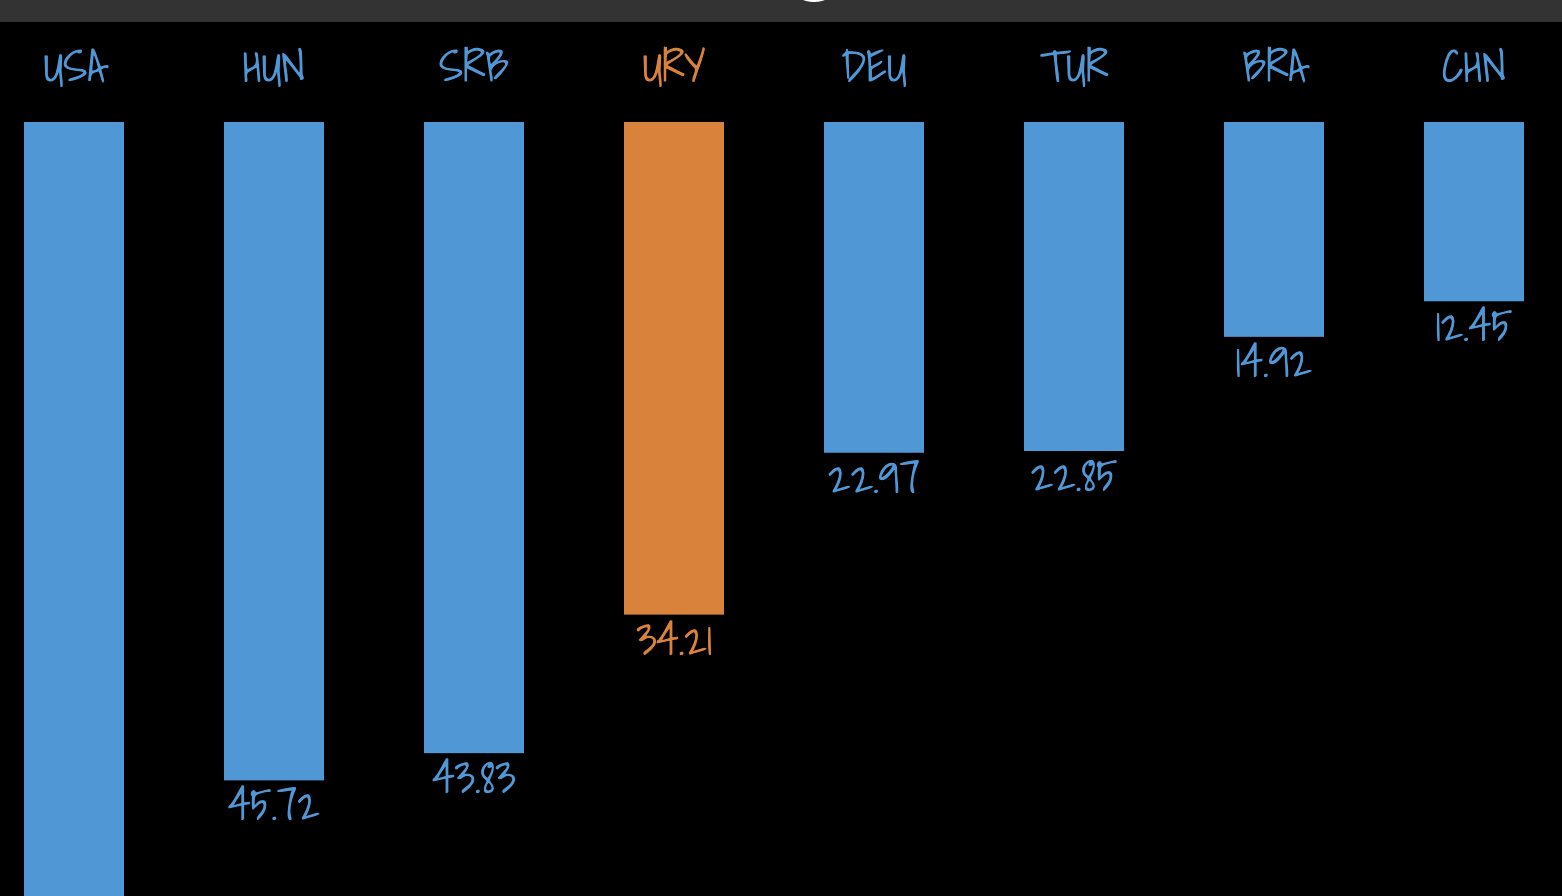
I then adjusted the color and added some mouse interactions. I met the same problem as the map when creating mouse interactions (later bars were drawn after the mouse click was detected):
After solving the problem, I added the “vaccine_per_hundred” values to the bottom of the bars:
And I used a circle to test the pie chart visual by binding its position with mouse positions:
I wanted to visualize the proportion of each country’s vaccinated population within their respective continents. So I sorted the “total_vaccine_number” data according to the continents and stored the vaccinated population of each continent in an array:
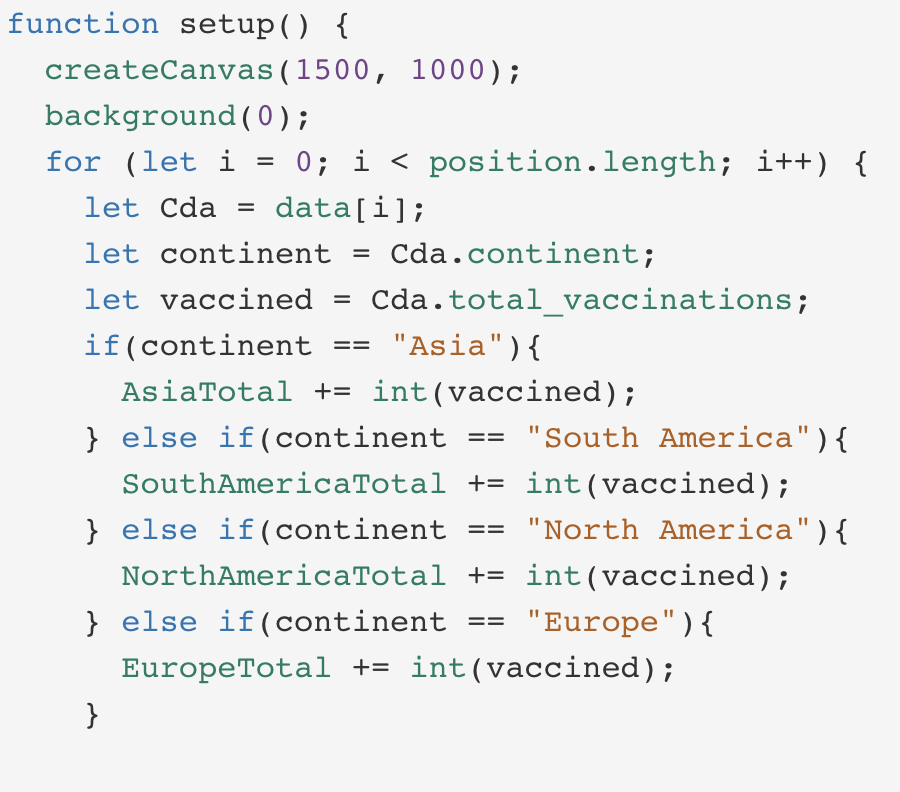
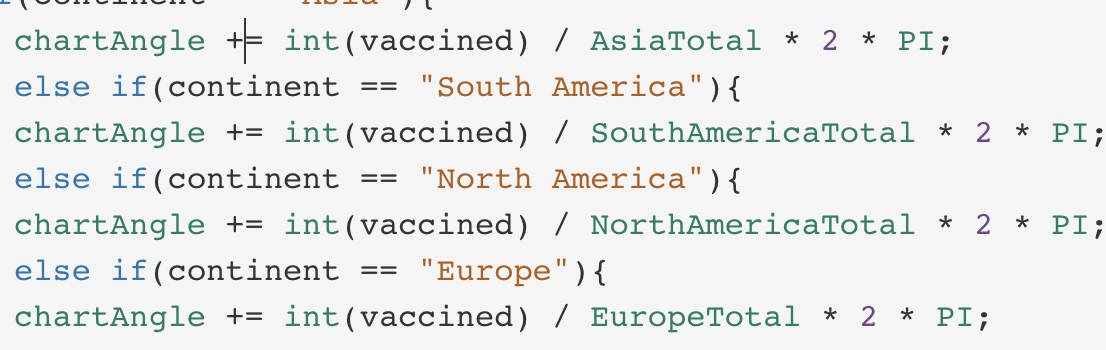
I divided the vaccinated population of each country by the total vaccinated population of its continent to get an angle for drawing the pie chart:
![]()
A failed attempt to proportionate the chart:
It occurred because I added new values to the “chartAngle” every frame:
Also, I felt that the visual was changing too much, so I just kept the pie chart at a fixed position.
6. Scene transition
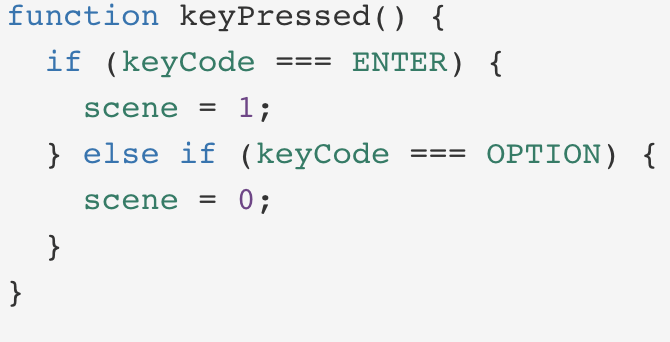
I defined two scenes — “WorldMap” and “Charts” — and used keys to trigger the transition between scenes. I used “RIGHT_ARROW” key to go to the charts scene and “LEFT_ARROW” key to go back at first, but they were also triggering the movement of the window (since the canvas size exceed the window’s). I replaced them with the “ENTER” and “SHIFT” keys and found that I couldn’t do screenshots or screen records because the “SHIFT” key was occupied. Finally, I replaced the “SHIFT” with the “OPTION” key, which had very few functions during the execution of this code.
Reflection
In this recitation, I practiced accessing and visualizing a large amount of data in JSON format using for loop and understood data parsing better. I also explored diverse ways to interpret the data and utilized my drawing skill to create interesting and intuitive visualizations. However, there’s still a lot of space for improvement:
- The positions of the needle tube image and the pie charts are fixed at a certain point so that users will miss the visuals if they scroll down/right the canvas. I may scale the patterns’ size and try to make their positions more flexible in the future.
- The pie chart visualization didn’t make sense when it comes to the USA’s data: since it is the only country in North America, it takes up 100% of the pie chart, which gives a false impression that the vaccination rate in the USA is really high. I may consider sorting and visualizing the data in other ways (such as total vaccinations per country / total vaccinations of all countries) to make the visualization more reasonable.
- The method I used to draw the map is highly time-consuming and I failed to create the map interaction as provided in the example. I will try to use smarter ways to do map visualization in the future (though not knowing how now…)