Recitation 6: Processing Animation
Documentation
Upload the screen recording (video) of your interactive animation along with your code (copy-as-HTML) to the documentation blog. Write some comments about what you learned during this recitation, for example, list the most interesting functions you used or what you struggled with. Be thorough so that you can refer to these notes in the future.
comments: I learned how to use the mouse to interact. By using mouse position we can change the graph accordingly.
void setup() {
size(600, 600);
noStroke();
colorMode(HSB, 360, 100, 100);
}
void draw() {
background(204);
fill(0, 100, 200);
if ((mouseX <= 300) && (mouseY <= 300)) {
rect(0, 0, 300, 300); // Upper-left
} else if ((mouseX <= 300) && (mouseY > 300)) {
rect(0, 300, 300, 300); // Lower-left
} else if ((mouseX > 300) && (mouseY <= 300)) {
rect(300, 0, 300, 300); // Upper-right
} else {
rect(300, 300, 300, 300); // Lower-right
}
}
Additional homework:
Step 1
Create a Processing sketch with a circle or square at the center of the screen. Your canvas size should be 600 x 600.
Step 2
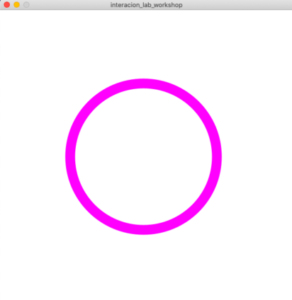
Next, modify that Processing sketch so that the circle or square periodically expands and contracts, like the circle in this gif.
Step 3
Then, modify the Processing sketch so that the outline changes color smoothly, as seen in the gif below. HINT: set the colorMode() to HSB.
Step 4:
Code:
float x;
float y;
float a;
float b;
float aspeed=5;
float bspeed=5;
void setup(){
size(600,600);
colorMode(HSB, 360, 100, 100);
x=width/2;
y=height/2;
a=width/2;
b=height/2;
}
void draw(){
background(360);
strokeWeight(20);
ellipse(x,y,a,b);
stroke(a,100,100);
x=map(mouseX,0,600,a/2+10,width-a/2-10);
y=map(mouseY,0,600,b/2+10,height-b/2-10);
a=a-aspeed;
b=b-bspeed;
if (a>width-220|| a<0+120){
aspeed=-aspeed;
}
if (b>height-220||b<0+120){
bspeed=-bspeed;
}
}