In this week’s reading, James Corner discusses about the essence, functions , and different types of mapping. He argues that although we tend to think a map is an objective description of the surface, it actually entails certain certain value orientation of the map maker. As the author puts, “what remains overlooked in this sequence, however, is the fact that maps are highly artificial and fallible constructions, virtual abstractions that possess great force in terms of how people see and act. ” It is undeniable that a map usually contains a certain kind of power relations. For example, when we are studying world geography and looking at a world map in China, the shape of China is always positioned in the middle of the map and painted with the most recognizable color. Also, when we are using an electronic map, with the behavior of zooming, we could clearly see the hierarchy of importance of all those items on the map. The buildings deemed as landmarks appear in the first place, and other “details of the street” gradually come into view with the zooming of the map. I could strongly resonate with the point that what is represented by the map is now constituting our cognition of reality. It even constructs an alternative reality beyond the reality we actually live in. It is normal for me to form an idea of a place before I really visit it by merely looking at the map. I have to admit that such visualization of reality makes it more convenient for me to make forward planning for my visit, but I always get shocked when I realize how reality is different than what is represented on the map when I actually arrive that place, especially when I am visiting some less developed place where many local family-run stores and restaurants are undercount by the system of the electronic map. Sometimes I feel like those stores and restaurants are eliminated by the statistical system just because they fall behind the times. With people more and more dependent of technology, the boundary between what is real and what is represented becomes even more blurred not because there are no differences between the two, but because what is represented by the map indicates some phenomenal trends happening now. Such intangible trends together with what is visible on the street form the reality as a whole.
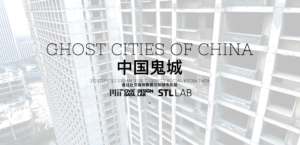
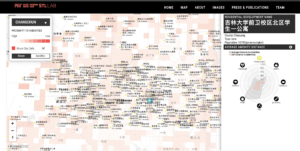
I agree that mapping is not depicting, but digging out some truths hidden behind the surface. Through researching and completing the mapping project, the producer could gain insights on the subject. One example is a mapping project called Ghost Cities of China.With the development of the Internet, a large amount of personal information, private data, and behavior patterns are stored and disseminated on the Internet People may not be able to imagine how powerful those data could be. This project uses data collected from social media to analyze the vacancy rate in China’s second and third-tier cities. The team collected data from social media such as Dianping, Weibo, Renren and Baidu. The data reflected the convenience of residential areas to schools, hospitals, restaurants, and grocery stores of 22 different second and third-tier cities in China. They managed to calculate a convenience score for each area, and used the score to determine the utilization rate of a residential area. For many years, vacant or underutilized residential areas in second and third-tier cities have increased due to excessive budget of construction made by the government. This “ghost town” map reveals the shortcomings of those seemingly prosperous areas and shows the risks of investing in these markets. On the one hand, the Ghost Cities of China map explores the underutilization of residential areas through gathering data from social media, and emphasizes the powerful role of open source data. On the other hand, this project is a great example of analyzing problems of a city or even a country through visualizing data in a form of map.
Here you can view the project.


Leave a Reply