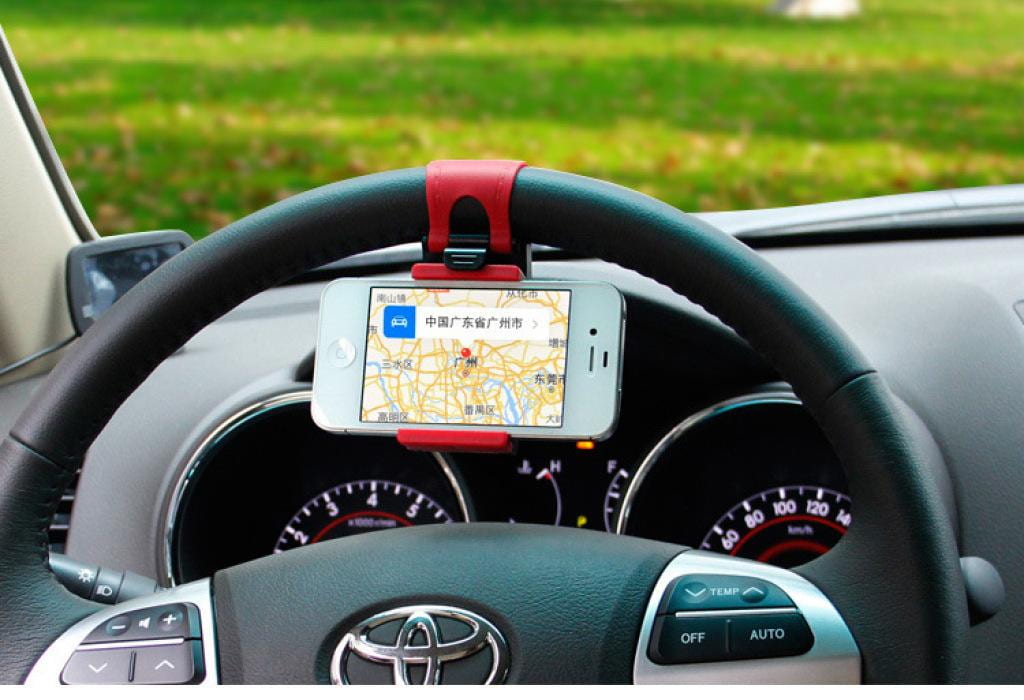
People now use maps for navigation. We use the “real-time map” on the mobile phone to navigate, in addition to seeing the direction of the destination, more importantly, let the “artificial intelligence” in the software tell us how to reach the destination faster/more conveniently.
This is what a flat, paper map cannot tell us.
This point of the navigation map is very different from the ordinary map. For example, the map in the traveling spot, rather than telling you which way is the easiest to reach the destination, the brochure map in the scenic spot also contains a lot of “layers”, such as the introduction of the scenery of each area, the distribution of convenient facilities, etc. The navigation map focuses more on “guidance” and “calculation”.
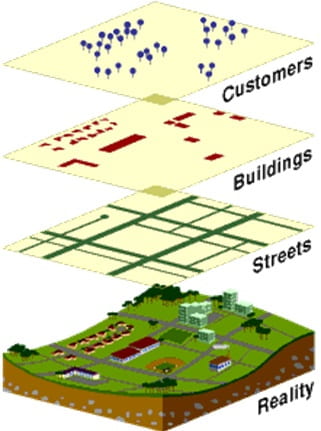
When calculating an optimal route, the calculation on the map side involves the use of algorithms and big data, which are more difficult for us to analyze. Anyone interested in smart transportation can watch this video which introduces the Alibaba City Brain in Hangzhou.
In this blog, I want to focus on how the analyzed data is collected.
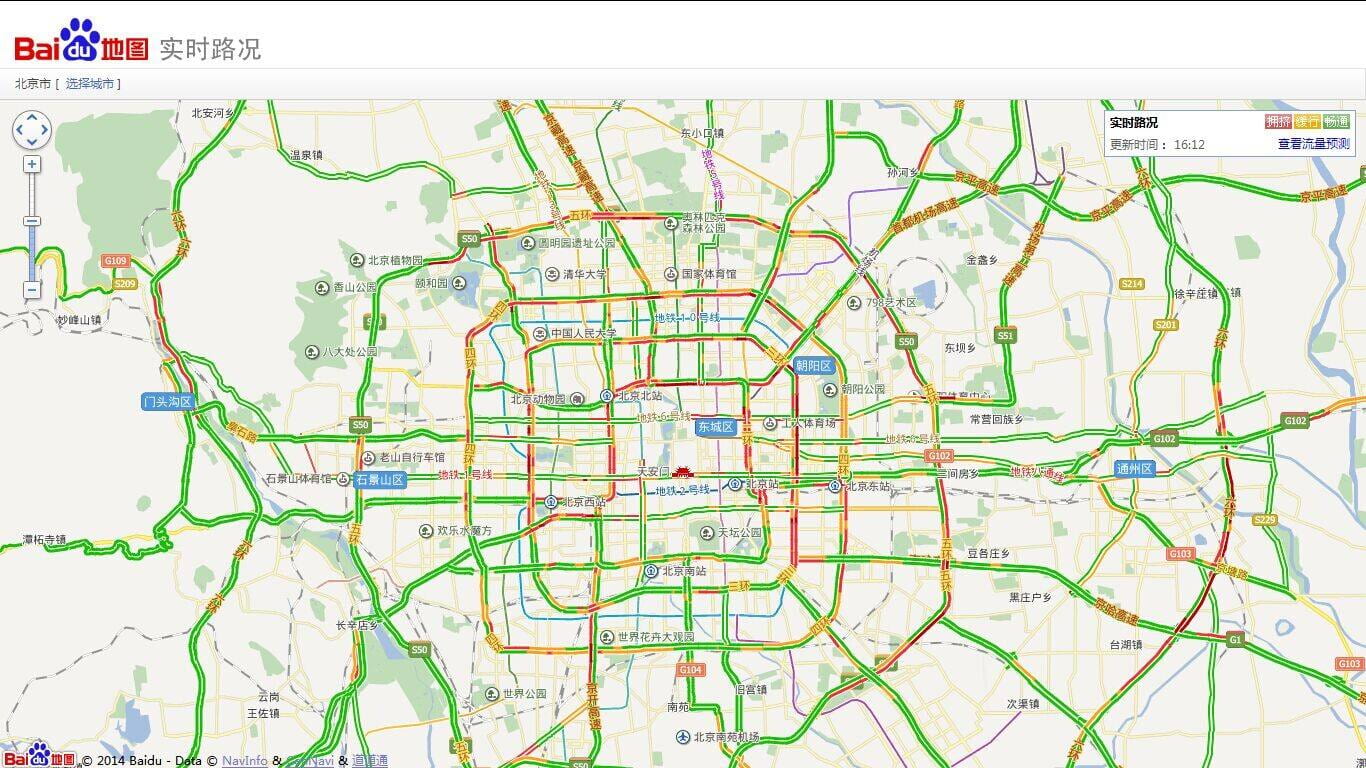
In the map app, we can usually get real-time road conditions by turning on “road condition information”. Even if we do not use the navigation function, the traffic information can instantly cover the roads of the city with a colorful route map.
However, how is this data integrated? Is it because there are staff members watching the congestion on the side of the road? Of course, this cannot be the case.
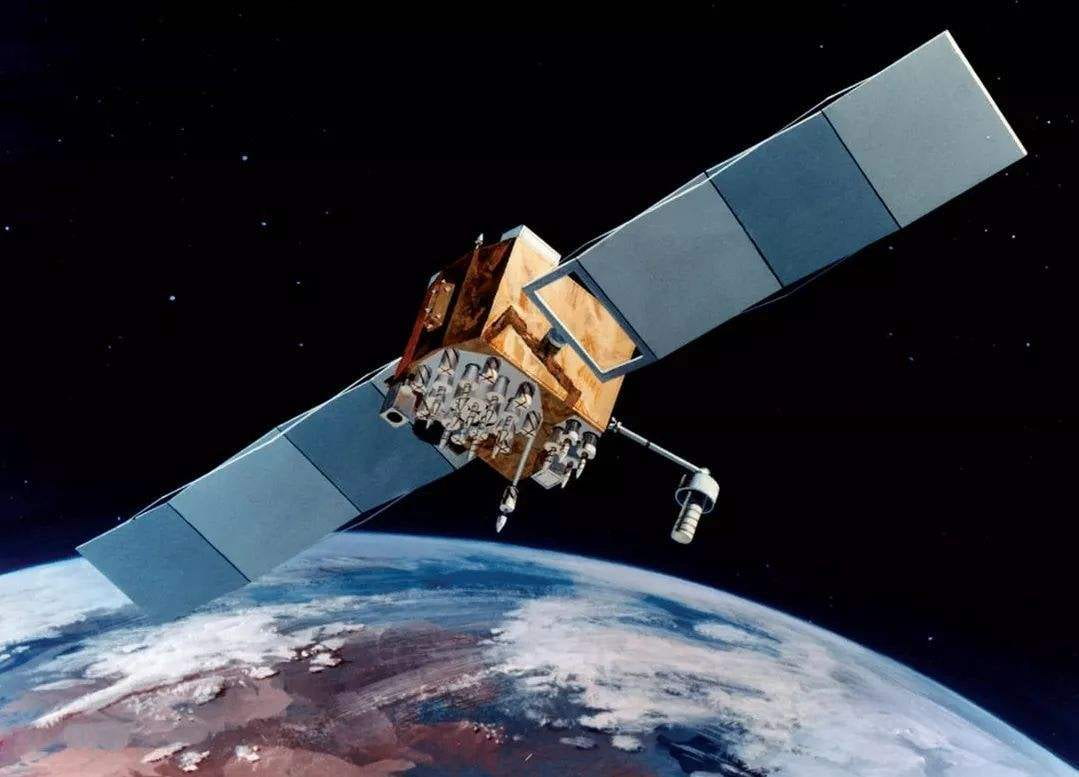
In fact, most of the traffic information does not come from monitoring and third-party calculations, but from ourselves. When we use GPS and navigation software, our location information will be uploaded to the cloud server, not only the location information but also our speed, our direction of travel. If on a road, 20 drivers turn on GPS, and their driving speed is very slow-then it is obvious that there is a congestion incident on this road, which will mark the road “red”.
Therefore, it is your “driving partner” who passes road condition information to you while driving.
Here, we can see a kind of spreading process. I prefer to call this process a transition from “consumer” to “producer”, that is, a relatively new concept-“prosumer”. Everyone who uses traffic information, while understanding the traffic conditions, also becomes part of the information uploaded. This is exactly the trend of big data under the rapid development of the Internet.
Not only on road conditions but also on current public places and public transportation, there will be real-time information on the degree of congestion. Everyone is the one who outputs information while obtaining information. In fact, this is a bit like Elema, the public comment mode, and the feedback output by the public will then influence the next wave of the public.
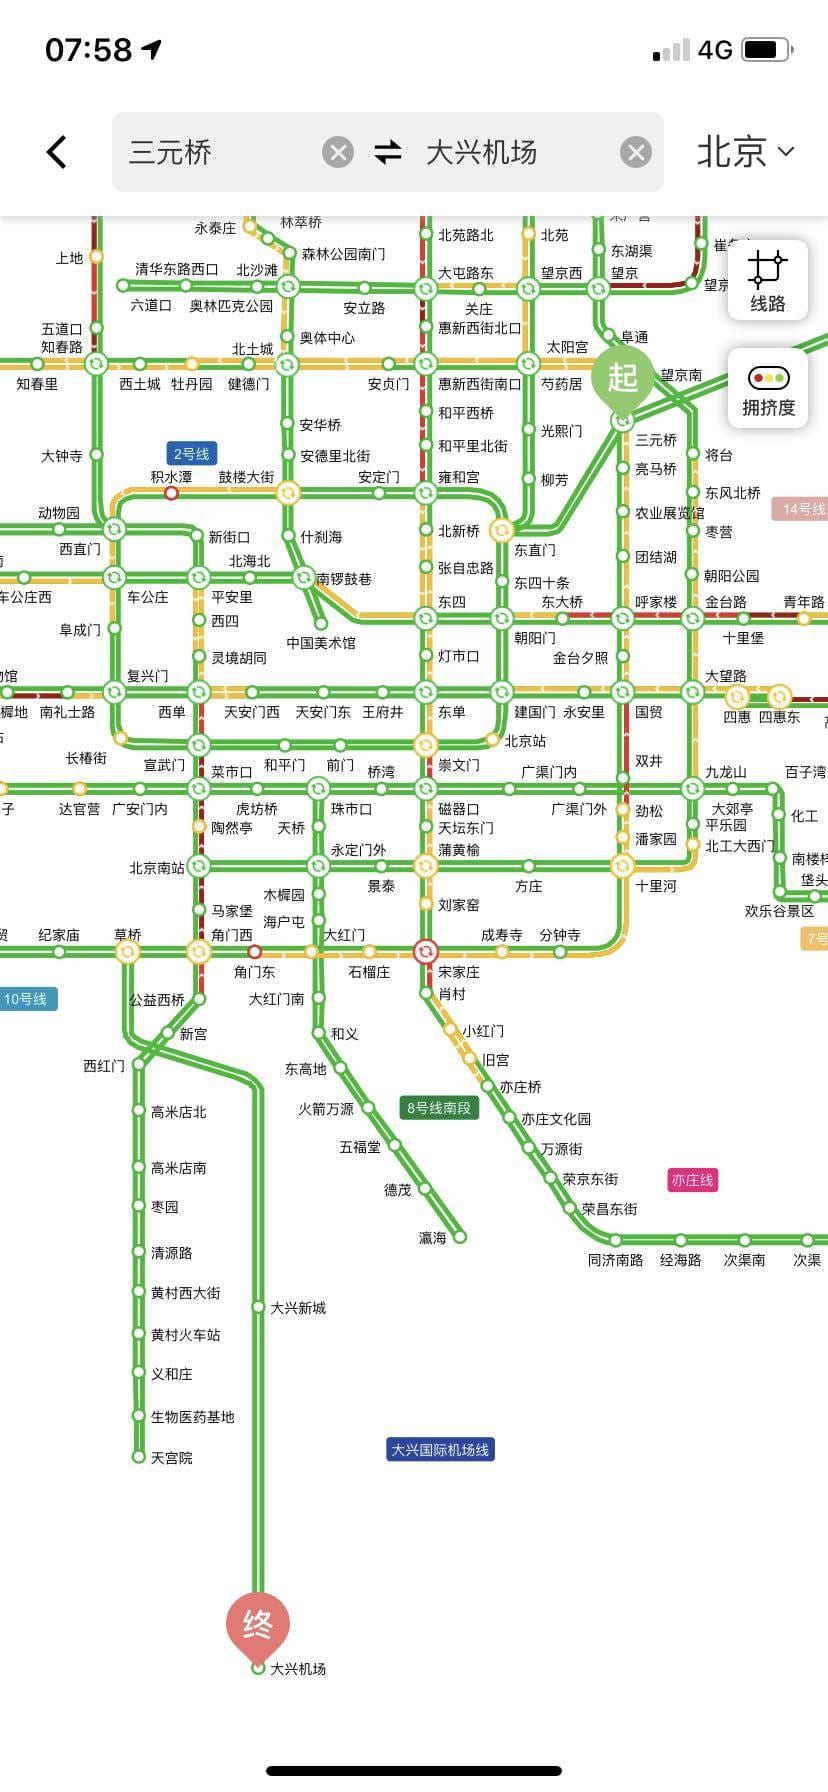
Everyone has become a point on the map.
In the past, we needed to obliterate some traces of people on the map. For example, the appearance of people on the real map can make people feel awkward. But now, people, or the flow of people, have become an indispensable layer on the map. People are also part of the map, the kind of information we want to see.
The concept of using people as part of the map is also widely used on takeaway maps. Click on your takeaway software and you can see where your deliveryman is now. Sometimes he walks in the opposite direction from where you are or walks over, which will make you panic.
This topic can be a good link to the mapping project that our group will do. We will make a certain analysis by observing and recording the location and agglomeration of mobile vendors in a cycle. In this process, what we need to mark on the map is not just the shop, but individual people, and a combination of time and space.
I am thinking about whether we can combine the flow of mobile vendors with the flow of their customers to make a more contrastive map model.
Leave a Reply