Movement exploration: wearable control prototype

The wearable is co-created with Zoe Margolis

Dance of the Perlins (an Exploration of Movement)

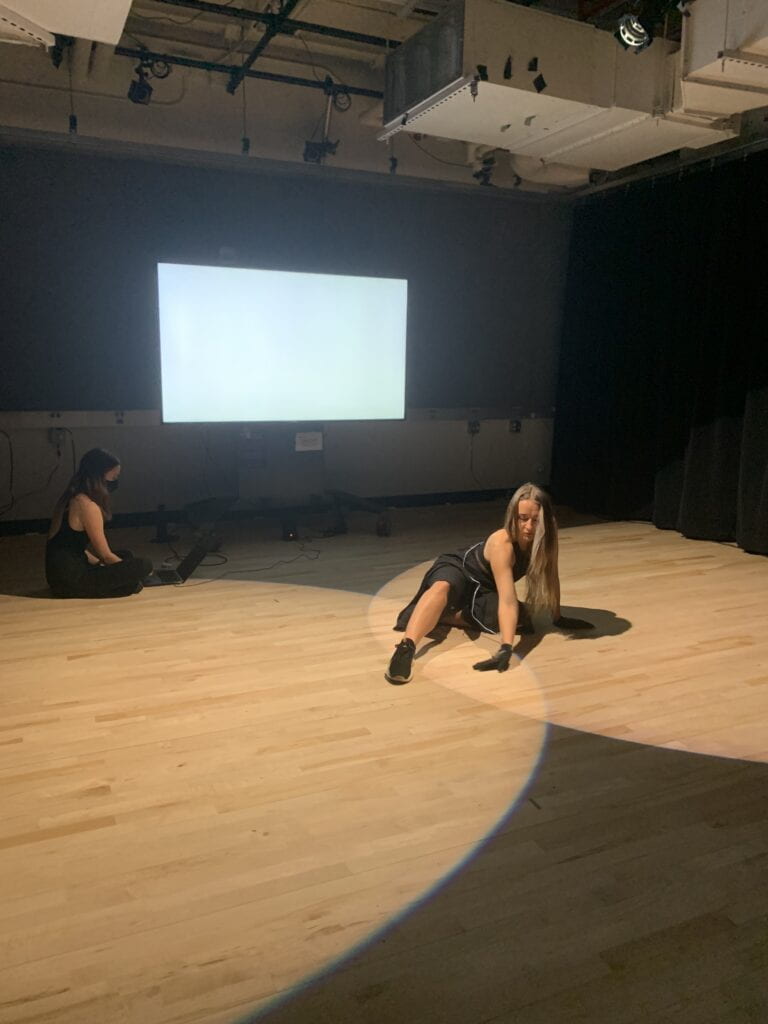
Dance of the Perlins is a performance that explores the interaction of movement,  choreography and dancer triggered particle flow. In the performance, a dancer wears a custom made wearable comprised of two gloves with built-in sensors. The movement data is wirelessly transmitted to a p5 particle flow visualizer triggering different visuals that evolve as the choreography progresses, thereby creating the Dance of the Perlins (in reference to the perlin noise that is used as the basis for the particle movement). The first live performance with the wearable prototype took place at the ITP winter show 2022, where the visuals were projected onto the screen behind the dancer:

Music credit: PROBASS ∆ HARDI – Good Evening (Where Are You From?)

Project details 

Prototype development

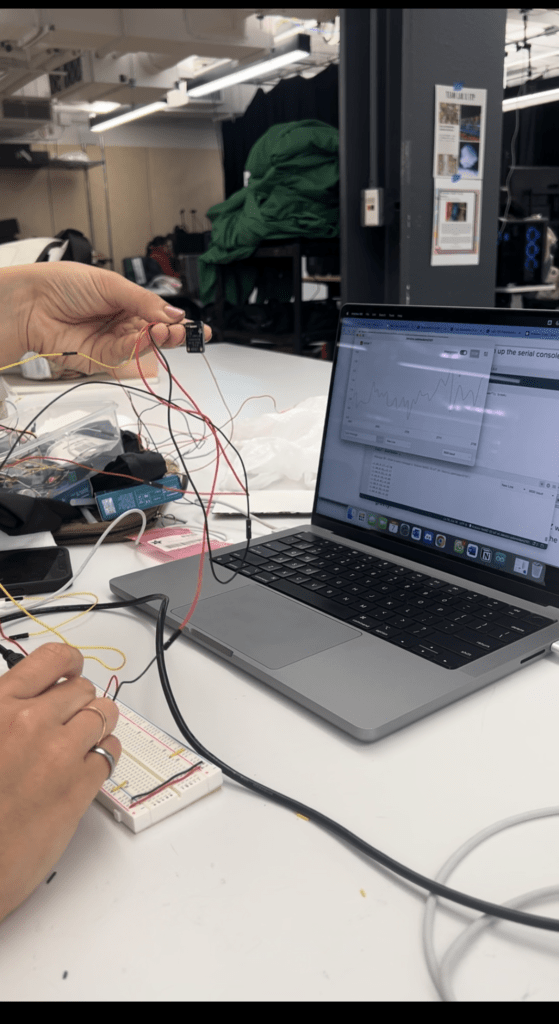
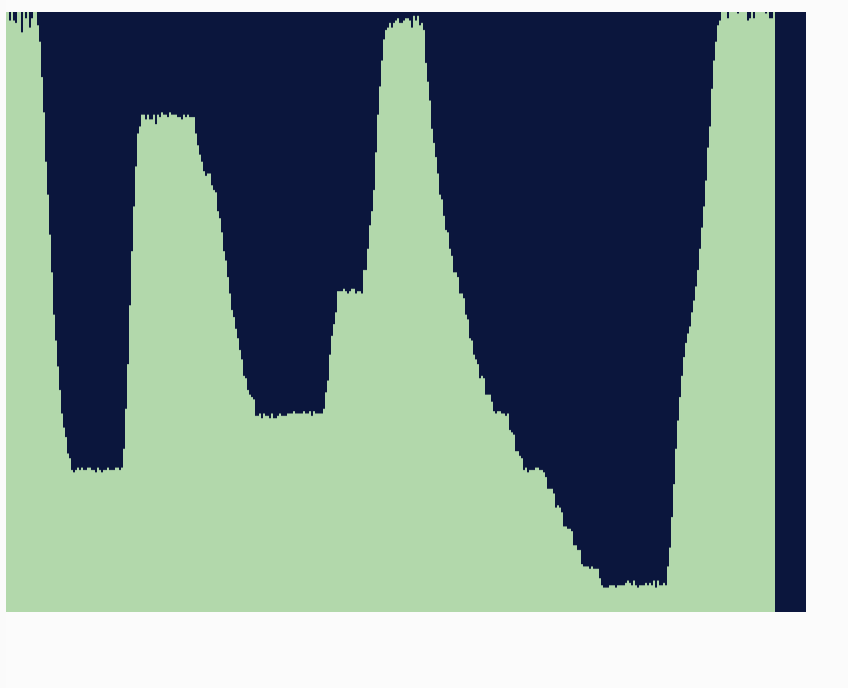
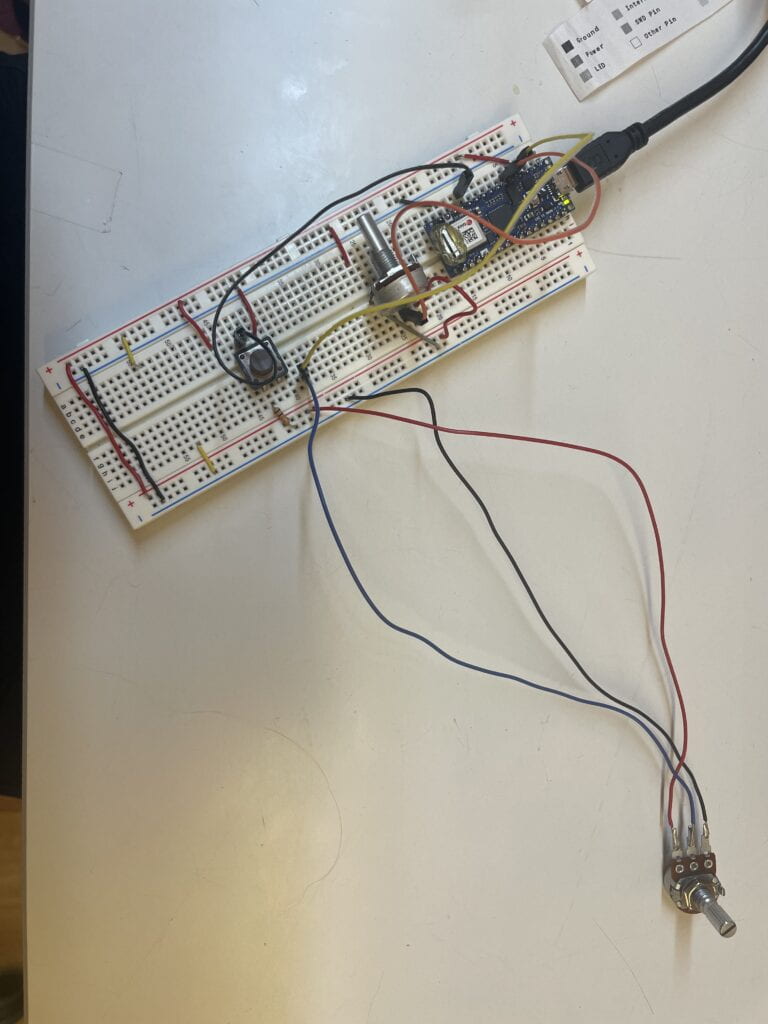
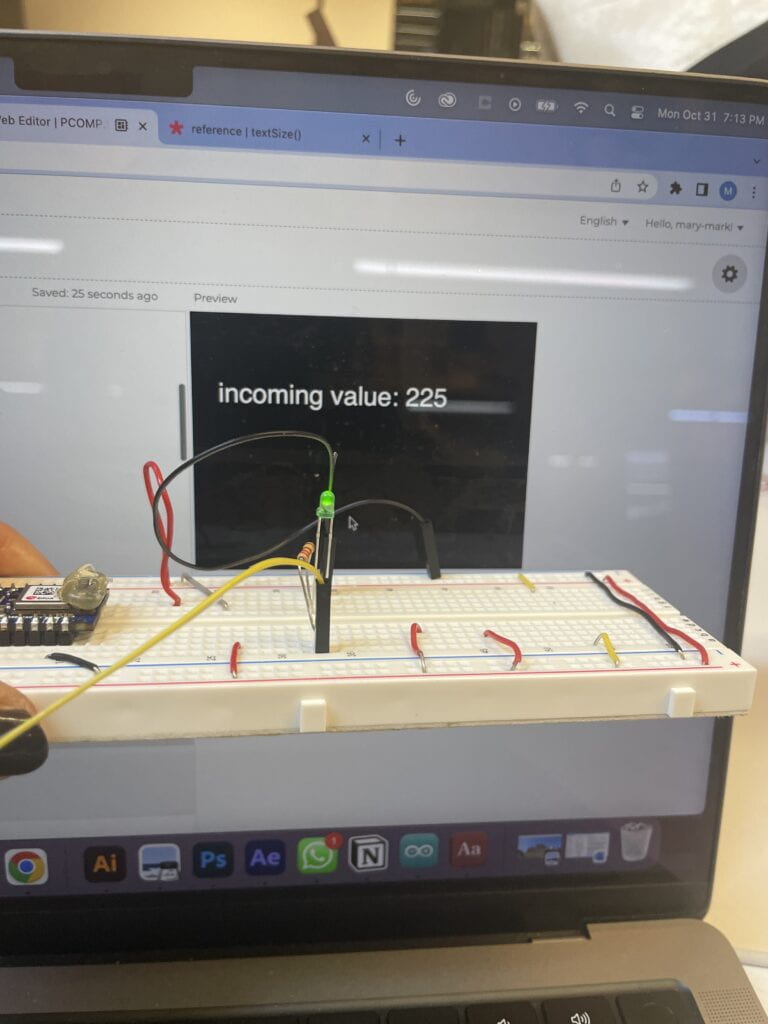
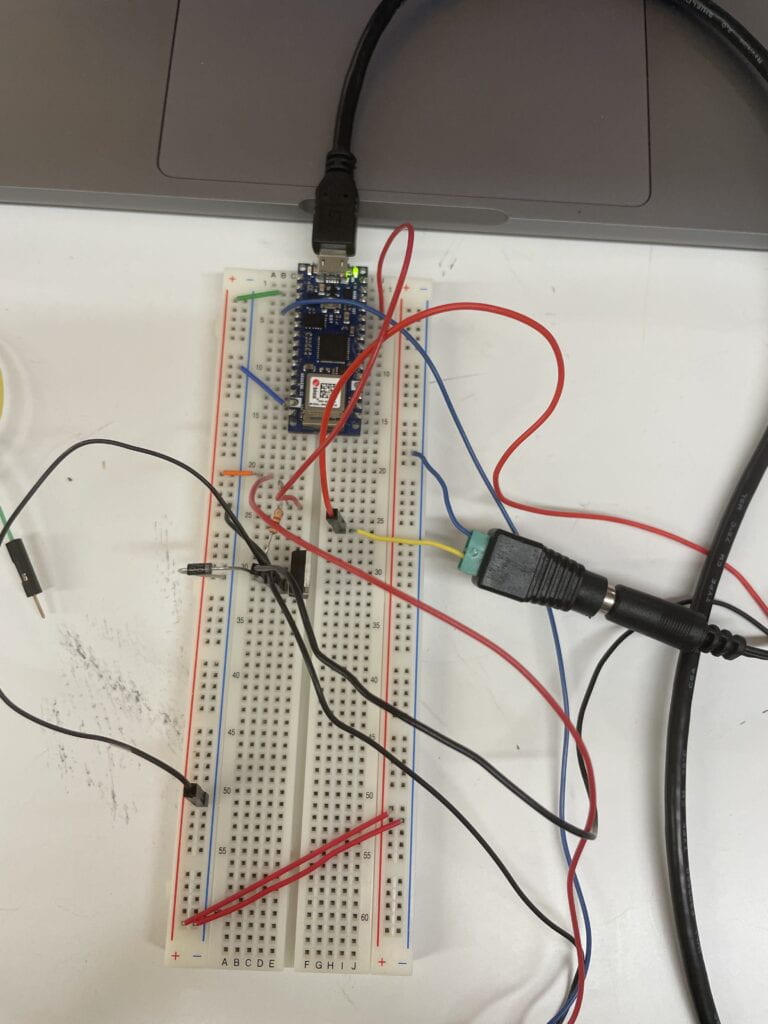
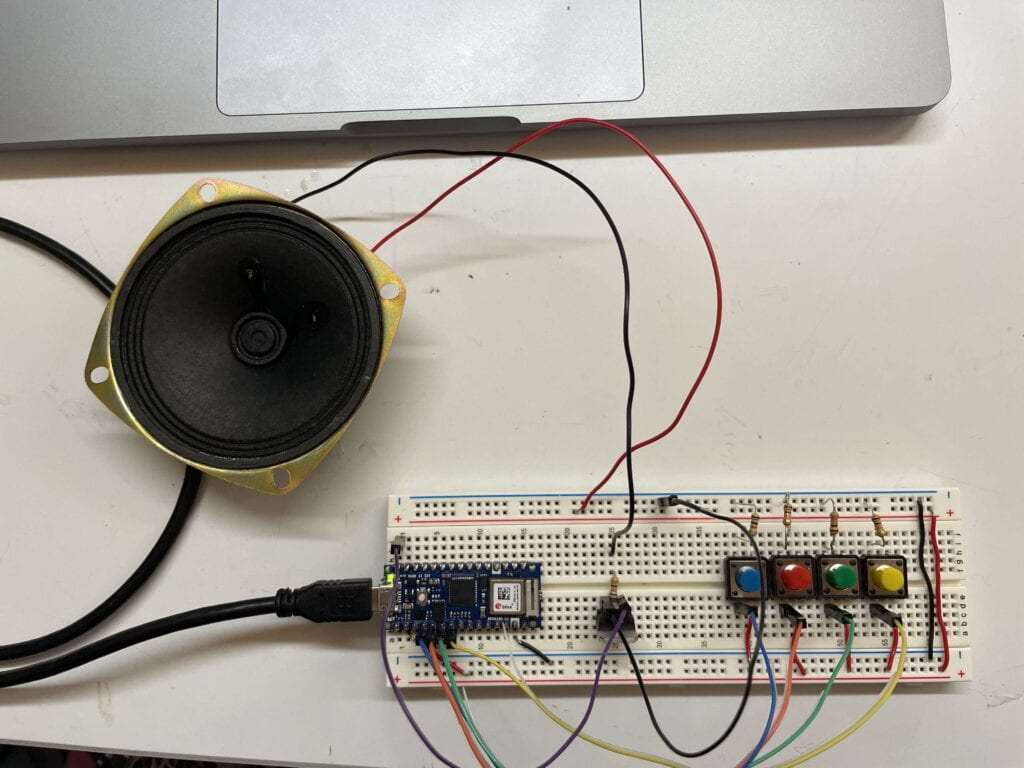
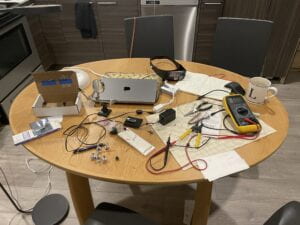
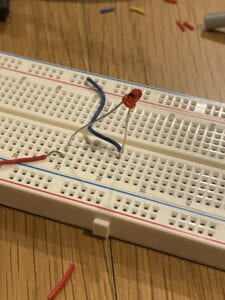
The first prototype consisted of one Adafruit LIS3DH triaxial accelerometer that was taped to the dancer’s wrist, with wires extending to a breadboard with an Arduino Nano 33 IoT (shown below).

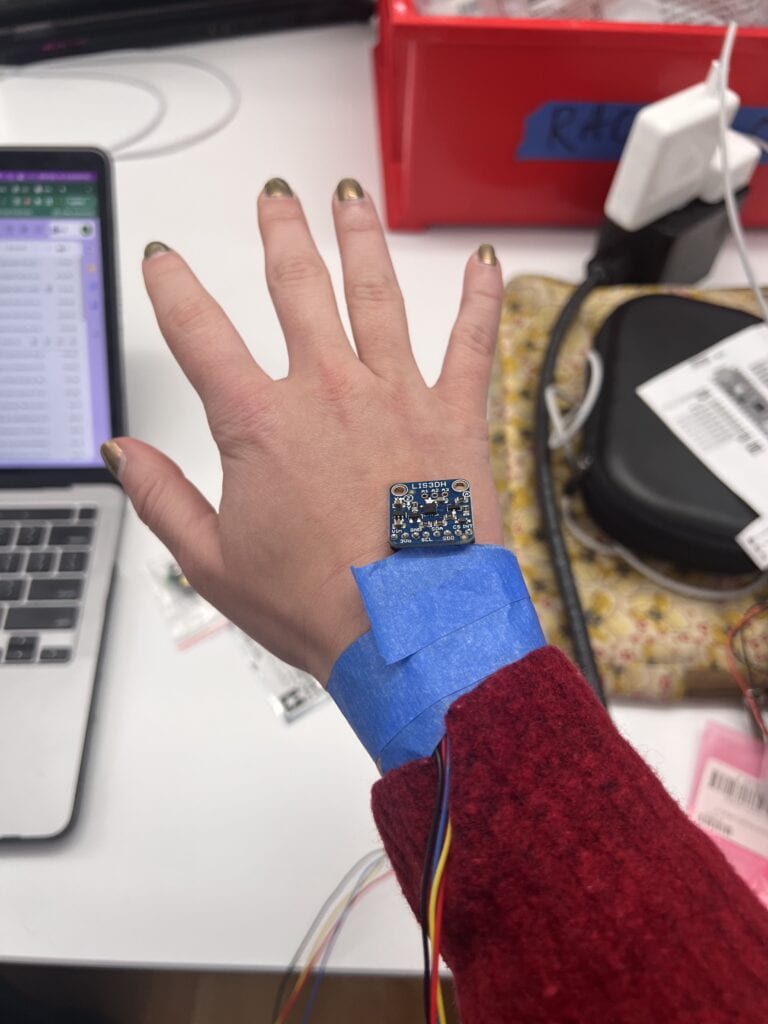
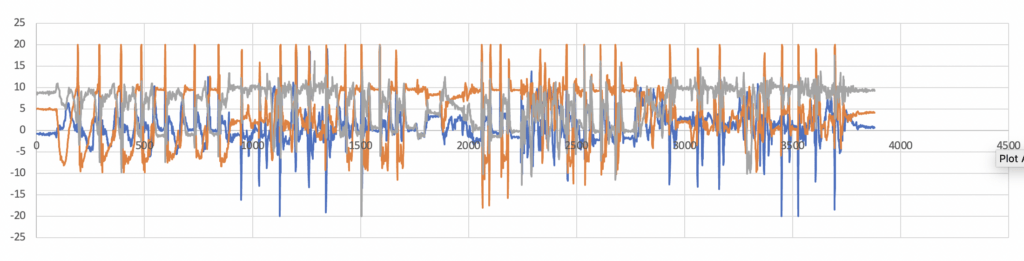
This prototype was used for gathering acceleration and movement data to understand recognizable patterns associated with specific movements. 

 After gathering the data, I started training a Long Short Term Memory (LSTM) network using tensorflow to detect the moves and trigger controls in real-time. The preliminary results were promising showing that the algorithm can clearly recognize two of the moves which we gathered data for. However, due to project deadlines I left the full development of the ML algorithm for later. Ultimately, we ended up hard-coding the triggers corresponding to specific accelerations or changes in acceleration.

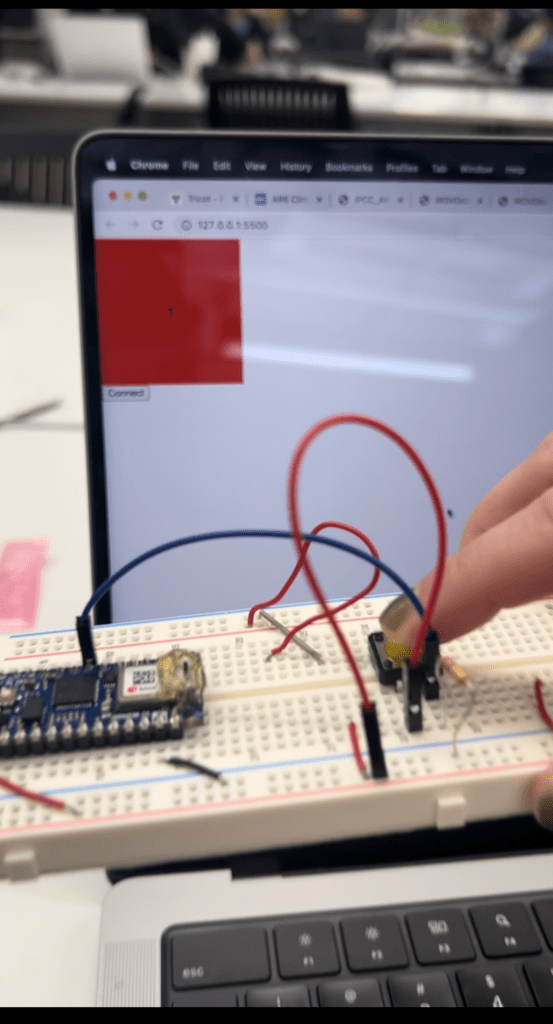
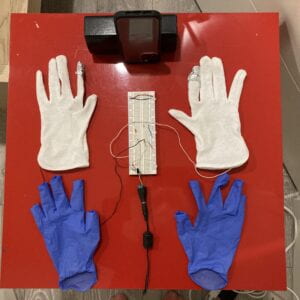
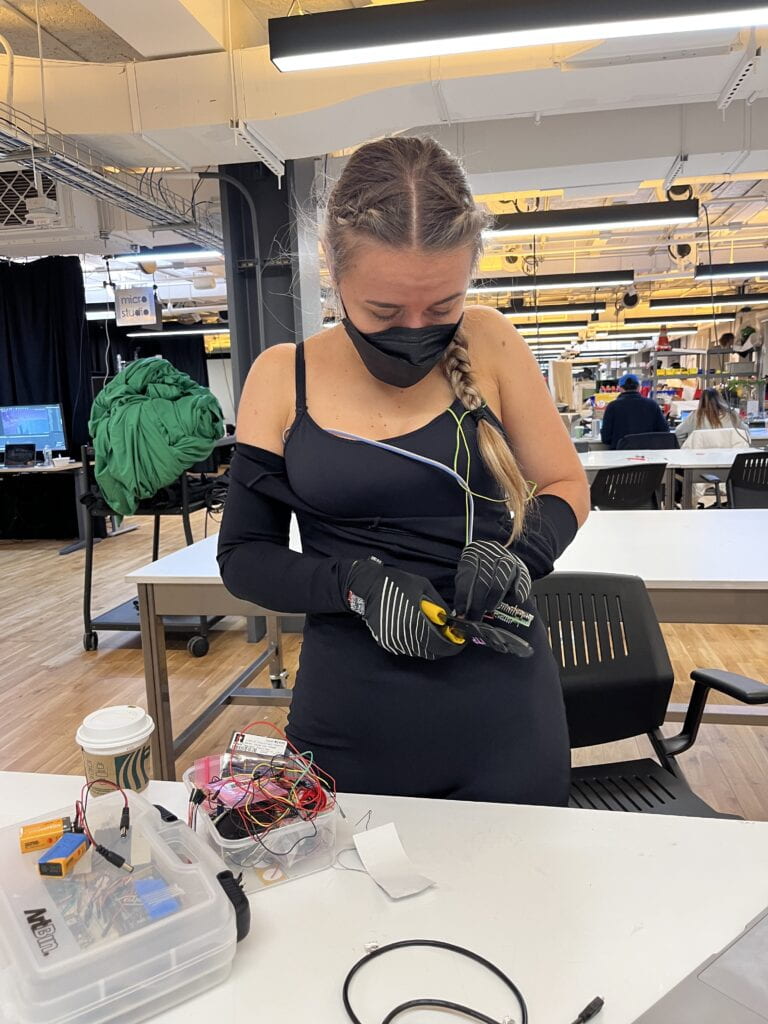
Following the initial user-testing, we decided to add more controls independent of the accelerations. Inspired by one of our classmates’, Dre’s project we added two capacitive resistors on the left hand using stripped wires. Finally, we soldered the wires extending from the sensors on the two gloves to a protoboard and connected it with a 9V battery, such that the device could fit in a pouch situated on the dancer’s lower back. And voila, the final prototype :

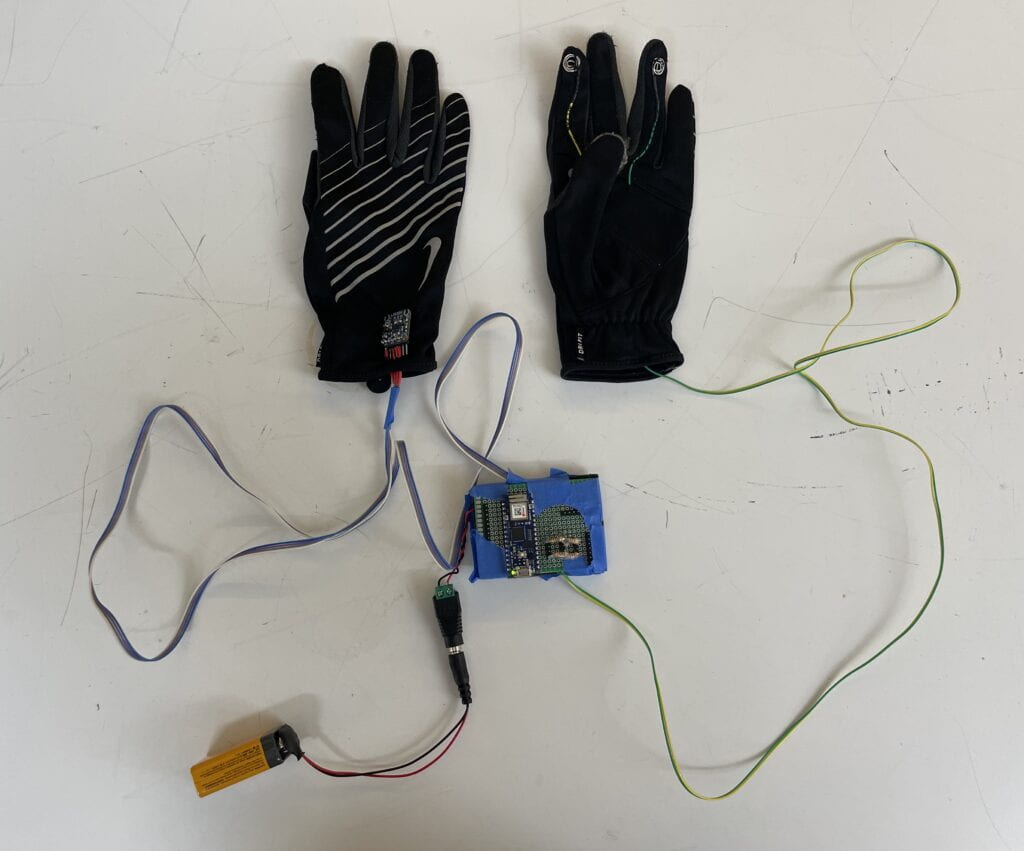
The prototype worked quite well, although it was difficult to adjust on the fly :).

The Arduino Code used in this project can be found on my GitHub.

Visualization

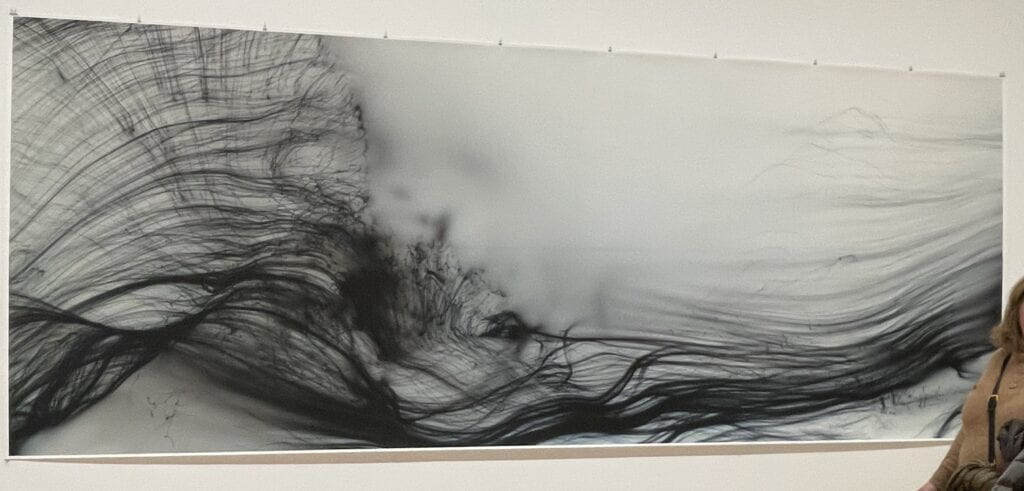
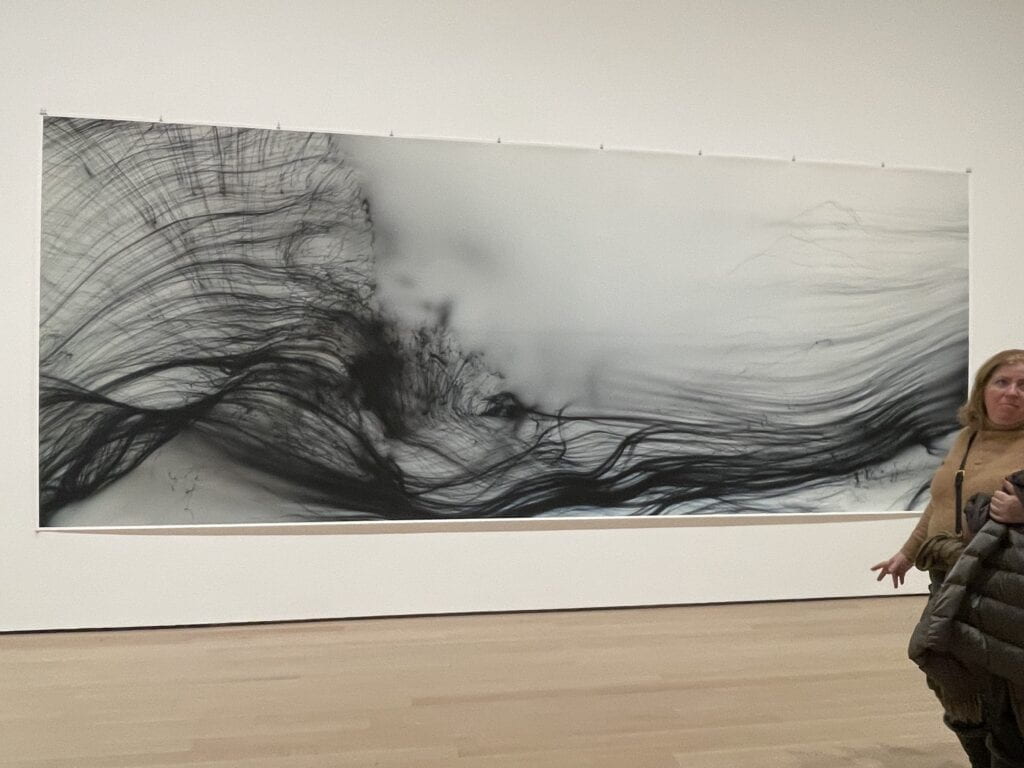
Sometime in November 2022, I visited Wolfgang Tillmans’ exhibit at the MoMA and was mesmerized by his work from the Freischwimmer series (below). This series is comprised  of camera-less pictures that he created by shining flashlights at photographic paper in the darkroom. This work really resonated with me since I wanted to create visuals that captured the feeling of effortless movement and abstract flow.

The ultimate visualization engine that I created was largely inspired by Dan Schiffman’s tutorial on Perlin Noise Flow Field and was originally written in p5 web editor. The original sketch (link) is controlled by 10 keys on the keyboard, each corresponding to a change in ‘perlins’ movement. The following 10 commands were used:

      • “-”/”=”: remove/add particles to the sketch (200 at a time)
      • “a”/”d”: decrease/increase speed of the particles
      • “s”/”w”: downward/upward movement of the particles
      • “p”: all directional flow field (default vectors)
      • “r”: random direction of the particle movement
      • “c”: chaotic movement (rapidly changing vector field direction)
      • “q”: color scheme change from white to black background and vice versa

The snapshot below is one of the visualizations created using the control keys.

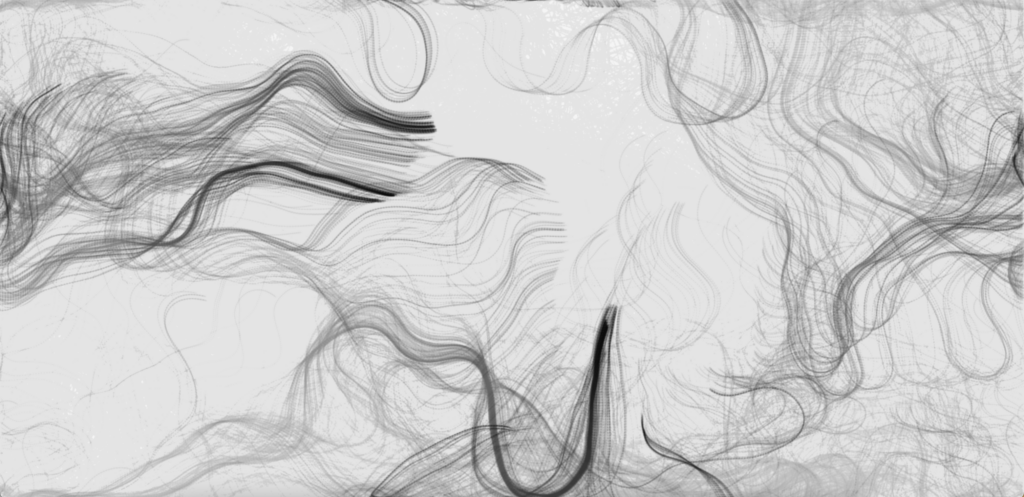
You can try the visualizer by clicking the interface below, adding particles with the “+” key, and using other keys for control:

The wearable prototype was connected to the p5 sketch via bluetooth, where acceleration and resistive capacitor data triggered different controls . The final files for the p5 sketch can be found on my GitHub.

Choreography and performance

The final puzzle piece was to test the prototype with the visualization engine using movement. Ultimately, I wanted to create a choreography that existed in harmony with the visuals and their evolution.

Choreographing with the wearable was an interesting experience to say the least… The prototype felt like a separate intelligent entity, often misbehaving and not reacting to the moves in the way I wanted. I had to be patient and also adapt my moves so that the visuals behaved and worked with me. I also noticed that many of my moves didn’t work with the visuals and it really constrained my dancing freedom which I did not expect. The following video is a compilation of footage from testing and the choreography process.

Finally, after spending some hours with the device I was able to choreograph a piece in which the gloves worked with me and the visuals felt in harmony with the movement. As per Tom Igoe’s advice, I also had Zoe, my project partner,  use the manual keyboard controls in case my movements did not trigger certain visuals. 

All-in-all, I performed the piece 8 times during the ITP winter show 2022. Certain times the wearable behaved better than others but regardless I loved each of the performances and developed a very special relationship with the wearable.

Takeaways and future development

Many questions came up during the project development, especially as related to the interaction between the dancer and the wearable. While we designed the wearable to control the visuals, in a way the dancer was controlled and in a way constrained by the wearable. So a question rises: does the dancer control the visuals or do the visuals control the dancer? This power dynamic also changes depending on if the dancer is able to see the visuals or not.

The process of choreography also felt different — I did not feel like I was choreographing by myself but that a had a moody and often constraining partner. The Perlin visualizer ended up dictating the choice of music, moves and performance style.

There were also some unresolved technical issues, primarily the ongoing interruption of the bluetooth signal that sometimes disrupted the performance, in which case the stage manager would take over the controls (thank you Zoe!). 

I would like to continue developing this project in several directions. First, I want to finish incorporating machine learning for movement recognition. I hope to introduce controls that are based not only on the dancer’s movement but also experiment with the recognition of the quality, rhythm and emotion of the movement. Another direction that I would like to pursue is to further explore the question of control between the algorithm and the human, through improvisation by both the dancer and the algorithm. 

week 10 – final project development

Co-created with Zoe Margolis

For our final project, Zoe and I would like to create a device that helps dancers control visualizations that accompany their performance with movement. One of the inspirations that we explored was the work of Lisa Jamhoury. When we started thinking about such a control device we first considered using tracking sensors and software such as PoseNet or Kinect, but we decided to go a simpler way and use accelerometers. There is something very beautiful about having the piece of technology directly on your body so that you can physically feel connection to the control device. I also personally love signal processing and time series analysis, and the seeming anonymity that comes with it, i.e. no camera tracking, no body posture or face recognition recognition, just acceleration. Maybe it’s something about having worked with earthquakes for almost 10 years that draws me into accelerometers; after all, earthquake records are produced using triaxial accelerometers.

The user of this device is a performer, and they will have two accelerometers attached to their wrist. At later points we might consider introducing more sensors, but for now we start simple. The wires will run underneath a tight bodysuit to the Arduino and a battery that will be housed in a mic belt. The signal in the Arduino will be sent via Bluetooth to a computer which will create visuals using processed signal in either p5 or Touch Designer.

Our workplan for building a prototype and the progress so far is as follows:

  1. Fabricate the circuit using accelerometers, Arduino, and a battery.
    So far we were able to set up one LIS3DH triple-axis accelerometer with an Arduino and read the x, y, z accelerations using I2C synchronous communication. We have not been able to figure out how to connect the second accelerometer yet. The data is currently being output as a string for each reading. For example for the two accelerometers the output will be a time stamp and accelerations for each accelerometer:  “t, x1,y1,z1,x2,y2,z2” or “1,-0.84,4.92,8.67,-0.84,4.92,8.67”.
  2. Send the data from accelerometers over Bluetooth to p5.
    We have been able to set up Arduino as a peripheral device, and receive one string via Bluetooth on p5. However, at the moment we are having trouble receiving updated data from the Bluetooth.
  3. Gather accelerometer data along with movement ‘labels’ to build a ML algorithm to identify moves.
    We have been able to gather the data for two simple and distinct moves for the right hand as a start. The moves are arm raise and circular ‘door opening’. To produce a labeled time series data that has both accelerations and move ‘labels’ we added two buttons to the circuit each representing a move. The following video documents some of the data gathering process.

    The output file is a .csv file that contain the following data: “t, x1,y1,z1, acc1 move1, acc1 move2, x2, y2, z2, acc2 move1, acc2 move2” or “1129,-9.32,19.58,9.92,0,1,-9.32,19.58,9.92,0,0”. So far we gathered nearly ~4000 data points of the right wrist, which is enough to start experimenting with an ML model. The triple-axis accelerometer data is shown below where you can see clear peaks when the moves were made.

    records of triaxis accelerometer

  4. Train a machine learning model to recognize the moves in real-time.
    This will be one of the main focus areas over the next two weeks. We are going to try to build a Long Short Term Memory (LSTM) network using tensorflow, because LTSM tends to work well with sequential data.
  5. Create a p5 or Touch Designer visualization, where certain moves trigger changes.
    This part of the project hasn’t been started but we did find some visuals inspiration from MoMA’s Wolfgang Tillmans exhibit below. I think we can recreate a similar flowing feeling using Perlin noise in p5.
    picture by Wolfgang Tillmans in MoMA
  6. Create a more permanent version of the prototype to be worn for a Winter Show performance.
    This part of the project hasn’t been started yet.

week 9 – bluetooth and accelerometer lab

This week our ultimate goal was to connect an external accelerometer to the Arduino and transmit the X, Y, Z accelerations through bluetooth. We were not able to do it but we had partial success in both tasks. 

Accelerometer

For the accelerometer we used the LIS3DH Triple-Axis accelerometer and followed an online tutorial and an example in the Adafruit LIS3DH library (link). We were successful in getting and plotting the signal but a few questions remain: 

!questions/comments!

  • What are I2C vs. SPI wiring? Which one is better for our application?
  • Is this the right accelerometer for us to use or are there better ones?
  • How many accelerometers can we use with one Arduino? Is it possible to use multiple accelerometers with I2C wiring?

Bluetooth

Bluetooth was certainly more of a struggle, even following the bluetooth lab. We didn’t quite understand how to send three float numbers (x,y,z accelerations) using characteristics. I was also confused about how to select UUID and alsoset characteristics.

We were able to turn on the Arduino LED using p5.ble.js library and also read a button output from a pin. However, we stopped short of sending accelerometer readings via bluetooth since we didn’t know how. There are many questions remaining.

!questions/comments!

  • a very important note was that bluetooth does not connect using p5.js editor. We learned that the hard way. We were only able to connect when we made a local server with Visual Studio Code.
  • The Arduino code from p5.ble.js website was not working (we could find the peripheral Arduino). But when we tried the example Arduino BLE codes form the Arduino library, they worked.
  • What characteristic would the LIS3DH readings be?
  • What is the difference between read, write and notify?


week 8 – asynchronous communication

This week the lab was a review of serial communication, since we had a lot of asynchronous communication in the midterm (extended blog coming soon).  There were still a few useful things that I picked up in this lab:

    • When we were doing two-way communication for the midterm we implemented the ‘handshake’ communication protocol. However,  it was very difficult to debug what Arduino was seeing since we couldn’t use the Serial Monitor.  In this lab I learned a useful trick, where you send the read Byte directly back to p5 and print it using either console.log or canvas. This is where command byte() was very useful. In Arduino, as soon as you read the byte, you can send it back:
      int inByte = Serial.read();
      Serial.write(inByte); Question: in p5 reference for byte() it says “Converts a number, string representation of a number, or boolean to its byte representation. A byte can be only a whole number between -128 and 127”. However, we were printing 255 on the screen using byte(). How does that work?
    • The graphing function was pretty cool and useful to monitor the signal. I will save that for later. Below is an example of potentiometer output:

Here are some of the pictures of the circuits I built in this lab.

week 5 lab – DC motors

This week I was only able to get through one lab, since we were actively working on the midterm. I successfully powered-up a DC motor using a 9V power supply and controlled it with a potentiometer. Here is the set up:

set up for a DC motor controlled by a potentiometer

The video shows the variable speed of the motor: 

 ! remaining questions!

Most of my questions from this week are about diodes:

  • What do the numbers on the diode mean and what is the difference between  different diodes?
  • How to we know the direction of the diode and which way should it be pointing when connected to collector and emitter?
  • Which was does the electricity flow, or more specifically, how does the diode prevent the wrong flow of electricity?

week 3 lab – can you guess the tune?

This week we played with analog input and output (or Pulse Width Modulation), testing the concepts on a speaker and a Servo motor. I also tried to do something ‘more creative’ with the speaker, so I created a little game called:

Can you guess the song in less than 10 notes?

With the help of Henry’s composition skills and Alexandra’s, Dre’s and Alfonsette’s song guessing abilities I was able to test out the game:

Hurray! Collectively the team guessed all the songs. Although I wonder how do I prompt the users to just press the button once, as opposed to continuing to hold it. Oh, and here is the set up of the circuit:

guess the tune game circuit

I was able to complete this week’s labs, although many questions remain. And my microcontroller broke at the end :(. Here is a lab highlight: potentiometer controlling the Servo motor..


!remaining questions!

  1. What does a transistor actually do and how does it work? What do the different pins mean?
     
  2. What is the speaker set up below? Which direction does the electricity flow in the speaker?
  3. How does one connect an audio jack?
  4. What does a capacitor do and when do we need to use it?
  5. A potentiometer doesn’t have a pulldown resistor even though it is a variable resistor. Why not?
  6. sizeOf(melody)/sizeOf(melody[0]) didn’t work when I used it to determine the length of the notes array. Why not?

week 2

This week I started developing circuits with the microcontroller using Arduino IDE. I also learned how to solder, which was new and exciting. Overall the labs went smoothly with a few hick-ups like figuring out that:

    1. I need to use ~D ports for analogWrite().
    2. I need to introduce delay() after the tone() to make sure the sound plays since the loop() goes too fast relative to the frequency.

Some questions following the lab remain:

      • When combining an LED with a resistor in series does it matter if the resistor goes before the LED or after?
      • Why choose the same order of magnitude resistor as the variable resistor?
      • What does ‘9600’ in Series.begin() mean?
      • What does the following mean: When you take a reading with the ADC using the analogRead() command, the microcontroller stores the result in memory. It takes an int  type variable to store this, because a byte  is not big enough to store the 10 bits of an ADC reading. A byte can hold only 8 bits, or a range from 0 to 255′

A few fun circuits that I constructed using potentiometer and a speaker:

and two Force-Sensitive Resistors (FSR’s) and two LED’s:

  •  

My first circuit, breadboard smoke, and the Jackson Switch

The Jackson Switch

I cannot believe how much I learned about circuits in just two days. All my life I was intimidated by the amount of different parts that go on the breadboard, but alas, this week I started my journey into taming the beast.  Over the last few days I created a short circuit, blew up an LED, and created a glove switch in tribute to the electric pop star, Michael Jackson. Here is a prototype of the Jackson Switch:

To create this switch, I used one of the circuit set-ups from the Labs with a 12V power source,  a 5V voltage regulator, a 220 kOhms resistor and a white LED light. My father consulted me on my circuit and was my assistant in filming and doing the lighting for the video.

Below is the filming and circuit set-up:

Image shows the electric circuit set-up for the Jackson switch

Even when using latex gloves under the white gloves, my body still conducted electricity (albeit with low current and high resistance)! The LED would light up slightly when I put the gloves on, even though the ‘switch’ fingers weren’t touching. How would I prevent that?

Week 1 Lab Reflection

Using the breadboard turned out to be much harder than I thought. The good news is that it got easier with practice. First of all, the working table became a mess very quickly:

There are a few important things that I learned:

  • using pliers to insert things into the breadboard would’ve saved me a lot of time.
  • nails and physical computing do not go well together.
  • making sure your wires are in the holes fully IS KEY. Most of the time if something didn’t work it was because of a connection problem.
  • I originally had a question as to why we have a resistor in front of an LED, but then it got answered when my red LED blew up (evidence below):
  • Short circuits are real and will start smoking and burning the breadboard 🙂
  • I need to invest in many  tools (duct tape, scissors, pliers, etc.)

Questions (and failures):

  • When I put two LED’s in parallel (or series) only the one red lit up even though the voltage was the same. Why?
  • I was unsuccessful in measuring current (mutli-meter read 0.0 all the time)
  • What do the numbers on the potentiometer mean?
  • I did not fully understand two concepts: what is a voltage divider and why do we need a constant resistor to pair with a variable one?


And finally, my first working circuit: