Apr 18, 2023
Basic Idea:
I want to use tide changes from the NOAA API.
My desire to make an art piece shows these data, but my physical outlook could relate to the female period abstractly.
Life on Earth depends on tidal rhythms, and tides depend on the moon.
Female menstruation is a miniature of the rhythmic movement of life on Earth.
The tidal changes are shown in the numbers and colors of LEDs and the direction shown by a servo. I still think about what the exterior should look like; it’s supposed to be a kinetic piece right now.
This week I explored more on how to physically show the pretty analogy of tides for the ocean, just like menstruation for women. I make a sketch and think about the mechanical issues. I met Tom to discuss my whole idea and the possible solution for the wiring problem with the continuous servo. And then I gave up. It’s still a good idea that Servo gives a sense of growth, but truly, it’s too hard for me, at least right now, whatever the gear system or the audio jack stuff. But it still should rotate; the posited servo is not bad.
The installation is supposed to be made with acrylic sheets and wood, the LEDs attach on discs to show the tide changes, and servo rotation is driven by the current direction I also try to add the data on the moon phase, which would be more helpful for visitors to think about the analogy between the tide and menstruation. But something changes after this week.
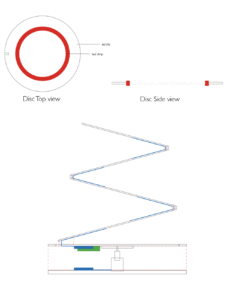
I explored lots of stuff this week.
@ HTTP delay
I get the tide data quite smoothly from NOAA, and I add the LEDs as output to test. However, the animation is not good because of the delay in the HTTP request. Tom told me a good library [scheduler] to make multiple loops together, one for HTTP requests and another for the output, but running locally. I can set the frequency of requests; during the interval time, the animation will work pretty smoothly and have a bit of delay when the data refreshes, but it’s not a big deal.
@ LED strip animation
In the beginning, I thought that making an LED animation would not take me a long time since there are lots of LED strip effect tutorials on YouTube, but I was wrong. The effects look cool, but not the feeling I want—the peaceful and gentle one. Then I dove myself into the world of LED animation; it took me hours to figure out the effects I wanted. I will upload the code later.
Better in this video:
@ Using Data drives the servo? or just run locally?
Tom suggested that I only use the tide down from the highest water level and the tide up from the lowest water level to trigger the change of the servo’s direction. Same theory to use when I get the direction data. But it takes 6 hours and 12 minutes to change direction once, the servo just moves so slowly that people cannot even notice it. The main reason I want to use the servo is for the sense of growth by rotating, so I decided to run the servo locally without any real-time data.
@ Jitter of servo
Since I plan to use about 160 LEDs, which need high currents and 5 voltages, the servo is just super jitter when all of them work at the same time. I tried to add capacitors and a servo driver but the jitter still be there. But the jitter has been solved by the API issues.
@ Moon phase Data:
I found a website named Stormglass that can provide astronomy data. Even though the free account can only make requests 10 times a day, it’s enough for me. But the data is a little strange; it only shows 4 phases in one data object. The closest data shows the New moon, First quarter, Full moon or Third quarter. Current data shows the Waxing crescent, Waxing gibbous, Vaning gibbous, Vaning crescent.The documentation wrote that there may be 8 phases in the current data, but not…
![]()
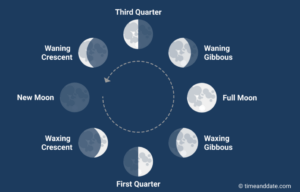
I still want to get the data for 8 phases, and I am trying to learn the moon data. The website [https://www.moongiant.com/] is really good, and it is easy to learn some basic moon-related knowledge. The moon’s illumination also gives hints of the moon’s phase; the only problem is that it has the same value between waxing and waning. Thus, I request the current position and moon illumination to make sure that I can get 8 phases.
@ Two APIs in One Sketch
Since I make requests to two servers I code them separately at the beginning and works well, and it still works well after I put them together. But something goes wrong after I add all of my physical output, nearly 160 LEDs, and a high-torque 35kg servo. The NOAA still gives me data, but the Stormglass is just waiting for a long time and getting the status code, -3, timeout. But I think multiple APIs in one sketch should be fine; I just wonder about the reason…
The interval setting for each API is also annoying; make a request to NOAA every 6 minutes; make a request to Stormglass once a day. And for the interval, I simply add a delay. It will not work in the same sketch. I think it should have another way to fix it…
Right now, I found the solution is to use two Arduinos and separately make requests to two APIs, and with the servo included in the moon phase code, the jitter problem just solved itself naturally. Maybe using two Arduino is stupid but it did solve something😂 At least right now, everything is going well…
Next week I will work on the mechanical parts since the acrylic sheet with 1/4 thickness is quite heavy and the sketch I am drawing right now has requirements on the structure. I need to test and adjust, and finding a material for the base that is heavy enough to stabilize the whole installation is also important.
I made a mistake last week in figuring out the API, I hadn’t used Tom’s demo, which gives a straightforward demo of how to set the interval time. I just noticed it after this week’s class and immediately removed the stupid delay. Here is my code.
Collecting all the API data I need via the server and getting the data to Arduino is super helpful since the moon phase API only has 10 requests per day, so there are not many chances to let me try the server code. I plan to continue using 2 Arduino Nanos this time, if I can find a better API, I will change to the server way.
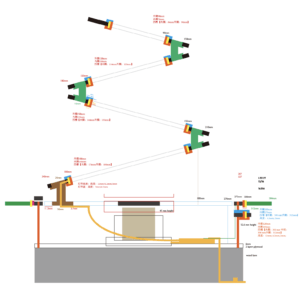
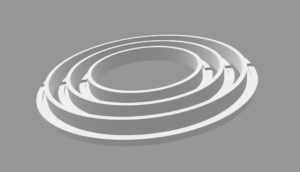
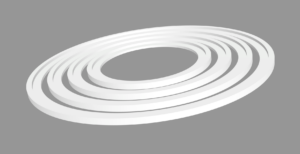
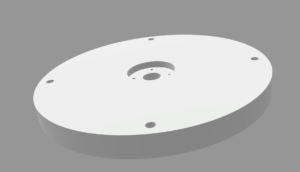
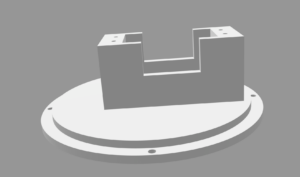
This week, I worked on the structure of the installation. I tried to 3D print some stuff as the fixations of LED strips and servos and engrave some patterns on acrylic to see what it looks like when the light goes through.
♠♠♠♠♠♠♠♠♠♠♠♠♠♠♠♠♠♠♠♠♠♠♠♠♠♠♠♠♠♠♠♠♠♠♠♠♠♠♠♠♠♠♠♠♠♠♠♠♠♠♠♠♠♠♠♠♠♠♠♠♠♠♠♠♠♠♠♠♠♠♠♠♠♠♠♠♠♠♠♠♠♠♠♠♠♠♠♠♠♠♠♠♠♠♠♠♠♠♠♠♠♠♠♠♠♠♠♠♠♠♠♠♠♠♠♠♠♠♠♠♠♠♠♠♠♠♠♠♠
Apr 25, 2023
I made a mistake last week in figuring out the API, I hadn’t used Tom’s demo, which gives a straightforward demo of how to set the interval time. I just noticed it after this week’s class and immediately removed the stupid delay. Here is my code.
Collecting all the API data I need via the server and getting the data to Arduino is super helpful since the moon phase API only has 10 requests per day, so there are not many chances to let me try the server code. I plan to continue using 2 Arduino Nanos this time; if I can find a better API, I will change to the server way.
This week, I worked on the structure of the installation. I tried to 3D print some stuff as the fixations of LED strips and servos and engrave some patterns on acrylic to see what it looks like when the light goes through.


♠♠♠♠♠♠♠♠♠♠♠♠♠♠♠♠♠♠♠♠♠♠♠♠♠♠♠♠♠♠♠♠♠♠♠♠♠♠♠♠♠♠♠♠♠♠♠♠♠♠♠♠♠♠♠♠♠♠♠♠♠♠♠♠♠♠♠♠♠♠♠♠♠♠♠♠♠♠♠♠♠♠♠♠♠♠♠♠♠♠♠♠♠♠♠♠♠♠♠♠♠♠♠♠♠♠♠♠♠♠♠♠♠♠♠♠♠♠♠♠♠♠♠♠♠♠♠♠♠
May 4, 2023
I checked the astronomical data and found that the interval between each moon phase is not constant, even though we use the same interval to calculate the date. Since this piece is more important to relate to nature, I stick with the moon phase API.
The user experience is always the part I keep in mind. Compared with a product, subjective expression should be the priority for the art piece rather than the UX, but that doesn’t mean the UX is not important. Conversely, the UX becomes much harder in this way. I have the desire to let viewers know what the piece talks about, but instead of trying to please viewers and seek viewers’ approval, I hope they might be able to move from confusion to enlightenment. Naturally, the UX design has to be different with various pieces, and the common user research methodologies might not apply.
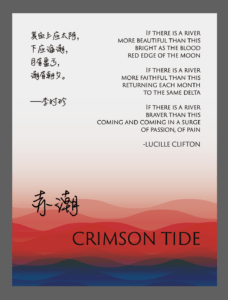
For this piece, I gave the name “Crimson Tide,” and I prepared a poster to “explain” the analogy relationship between tide and menstruation. I choose to use the excerpts from poetry and literature as a reference rather than the direct inspiration description. Even though both the text and the installation are relatively abstract, they can explain each other. I assume this is an effective way, but let’s see what happened in the spring show.
Final Demo: