
-Text as Data
8 / Th 21 Feb “Text Analytics Basics” | Exploring Voyant Tools | tapor.ca
9 / Tu 26 Feb
Reading: Rockwell/Sinclair “The Measured Words: How Computers Analyze Texts” ch 2 of Hermeneutica | creating a Google Alert to help you with your Zotero | Project Gutenberg (for open, plain text)
Browse:
Try the Harry Potter and fan fiction corpus (in Drive) with Voyant Tools. Experiment with some of the different visualizations (using the drop down menu from the windows looking icon.)
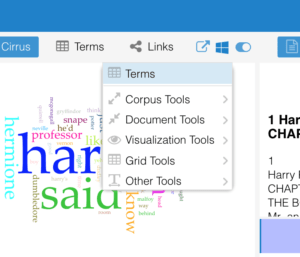
Instead of cutting and pasting the text into the window, use the upload button to upload all 6 texts. Try it and see what happens.
10 / Th 28 Feb Practicum: tidytext package – text mining and building a word cloud in R | gutenbergr package | Discussion of “The Measured Words”
A more in-depth treatment of the Tidy package can be found here.
Blog 1: Build a small corpus of texts that interest you from Project Gutenberg, repeat the practicum to see what it is that you can discover. In your response, please comment on the process, whatever you did to manipulate the texts or change the settings of Voyant or the provided R script. Also, describe why you chose these texts and what looking at them with the help of a computer taught you about them. What happens to text when it is turned into lists, numbers? Read about more complex forms of text analysis like here or here. What do they do differently? (due 12 March, 11:59pm).
11 / Tu 5 Mar Textual forensics: trying out the stylo package for R
A user manual for the Stylo package can be found here.

-Dataset
12 / Th 7 Mar Exploring humanities datasets:
Titanic dataset
Barber shops of Abu Dhabi (2nd link therein)
data.world “public” repository
Wikidata
Zenodo (Literary Geographies of Christine de Pizan, Linguistic Landscape of Leipzig)
data.gov
CodeCamp
French Enlightenment Correspondents
Reading: Hayles, Narrative and Database
What is a dataset? What elements might it contain? What structure can it have? What could a dataset about the humanities exhibit?
13 / Tu 12 Mar Project planning: Creating a Structured Narrative Dataset for visualization
Search for a table in Wikipedia/Eurostat/Kaggle on a topic of interest to you. How can you “enrich” the data contained therein. We are going to practice some very basic data enrichment or carpentry. Not all datasets can be extended, but many can. We will discuss today some ways that you might achieve this. Enrichment of a dataset allows you to correlate one set of information with another.
Look for a dataset like the Titanic that allows you to plot the relationship between one set of numerical variables and another, and that also has bounded set of types (e.g. Male/Female ; no / yes / maybe; children, adolescents, adults).You will choose a topic and get to work on it. Next class we will practice visualizing that data using R.
Look at the following Wikipedia pages:
https://en.wikipedia.org/wiki/United_Nations
https://en.wikipedia.org/wiki/FIFA_World_Cup
Take a look at Eurostat or Kaggle for lots of datasets:
https://ec.europa.eu/eurostat/data/database
https://www.kaggle.com/datasets
14 / Th 14 Mar Practicum: the dyplr / ggplot packages in R
US Supreme Court Justices | Global Murder rates | Inter-state War Data
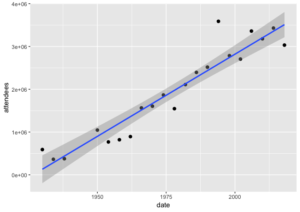
Blog 2: Find a topic that interests you where there are tables with string and numerical values that would lend themselves to a simple scatterplot visualization. Look for an existing medium size dataset in Wikipedia, Eurostat or Kaggle as we did in class 13. Extract the data into a csv file and clean/normalize it. Visualize the dataset in R using the basic scripts we have in the GitHub repository for class 14 from different angles. Add on one or two other columns that “enrich” the data. Comment on the process in your blog posting. What goes into a dataset? Who do you think brought together the basic information of yours? When you visualized a dataset, did anything become apparent that was not when you examined it in tabular form? Do you like to explore data visually? do you feel it is potentially deceptive? What kinds of other visualization would you like to do? (due 4 April. 11:59pm)
Zotero progress: make sure that you have 10 articles on your topic and a google alert made by 1 April.