Let’s first cover a few more Pd basics.
CONTROL
2.1 lists, packing and unpacking
We have learnt about numbers so far. As you may remember, numbers in Pd are referred to as “floats” or “f”s as you often see them in your trigger objects. In pd it is possible to create lists by packing two numbers together using an object called “pack”. The object pack takes two incoming floats and outputs a list. Pack as a hot inlet and one or more cold inlets as shown in the previous section for the “+” object. Therefore, if you send a number to its right inlet it will store it in memory, and if you send a number to its hot inlet it will store it in memory and then pack the numbers stored in memory and output them as a space-separated list of floats.
In contrast, unpack will receive a list in its input and will output it through its outlets in right-to-left order. Thus, if the list you send in is “23 34” to the object “unpack”, it will first output 34 through the rightmost outlet and then 23 through its left-most outlet.

pack and unpack assume you have two floats always, but you can modify this by creating more outlets with creation arguments. You can pack things that are not numbers, but we’ll see that later.
2.2 counting bangs
Let’s introduce another object. This one is called “float” or just “f” and it allows you to store a number in its cold inlet which you can then retrieve with a bang in its hot inlet. If we take the output of the “float”, add 1 to it, and feed the output to the cold inlet of the same “float” object then we have a bang counter. In essence, a counter is a feedback loop; the cold inlet prevents the software from feeding back infinitely.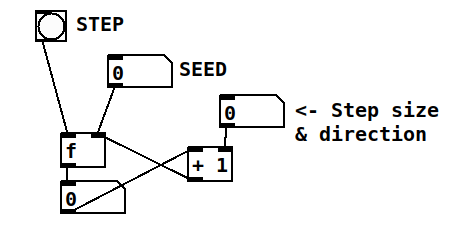
Let’s now move to audio.
AUDIO
2.3 Sound waves
Sounds are changes in pressure over time across a medium. The usual way we experience sounds are through vibrations that produce changes in air pressure. When using Pd in this class, we will be producing signals that are fed to speakers to generate sounds. As seen in the image below, speaker diaphragms move back and forth to create pressure changes. As it moves forward it compresses air molecules and when it moves back it decompresses or rarefies air molecules. These patterns of air pressure travel across distances when molecules push each other in the direction of the pressure, traveling through space at a speed of approximately 340 meters per second depending on temperature and humidity. Sound waves are longitudinal waves.
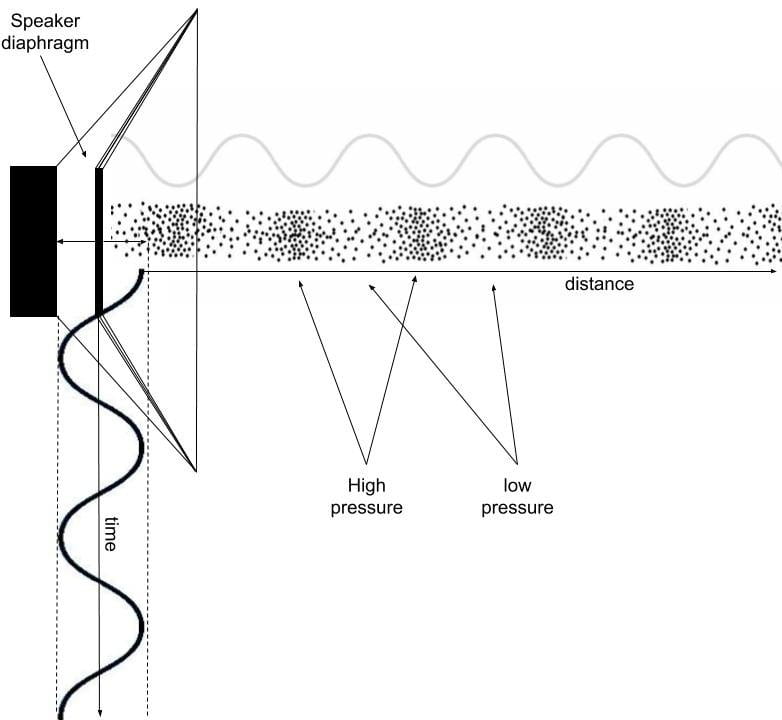
However, sound waves are often modeled as transverse waves, that is as waves that move up and down over time, perpendicular to the direction of the wave. In the diagram above, you can see how a transverse wave moves from left to right over time diving the speaker diaphragm to create areas of high and low pressure that travel through space.
In the coming sections, we’ll use the transverse representation and focus on particular kinds of waves: those that produce pitches.
2.4 periodic sound waves
Let us try the following experiment. Open the patch shown below, or copy it to a new patch. The download link for patches is in the NYU Brightspace site if you are a student here, or you can use the link the main page for this course to download all patches. If you use Github, then you will notice these patches are updated frequently.
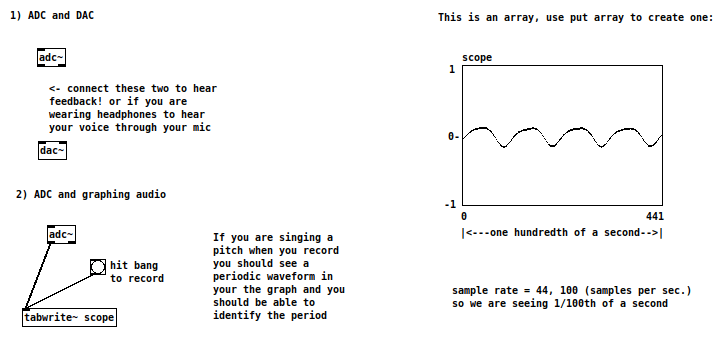
Before we get into the theory of things, I’ll just say that adc~ is a way to connect to our microphones, so assuming you’re on a laptop computer, when you switch DSP on, you should have a signal going in. You can test it by connecting adc~ to dac~ and experiencing some amplification and feedback by sending the signal coming in from your mic directly to your speakers. if you don’t get a feedback squeal, hit your mic to make sure it is working. If it is not working check the help page. Disconnect it when you’re done.
Now switch to run mode and sing to your mic. While singing, click on the bang labeled “hit bang to record”. If you make noise saying “shhhhhhhhhhhhh” or “fffffffffff” you should see an aperiodic waveform, but if you sing “ahhhh” or some other vowel at a fixed pitch, you should see a periodic waveform as shown above where it says scope.
Whenever we perceive pitch in a sound, we have a periodic wave, that is, a waveform that repeats over and over at some frequency or rate of repetition. In the picture below, we can see the waveform produced by a guitar playing a note. Sounds in the real world aren’t exactly periodic, but quasi-periodic because there are minute variations on each iteration. The wave pattern that you see repeating is called “the period”; in the image below I can count 5 periods.
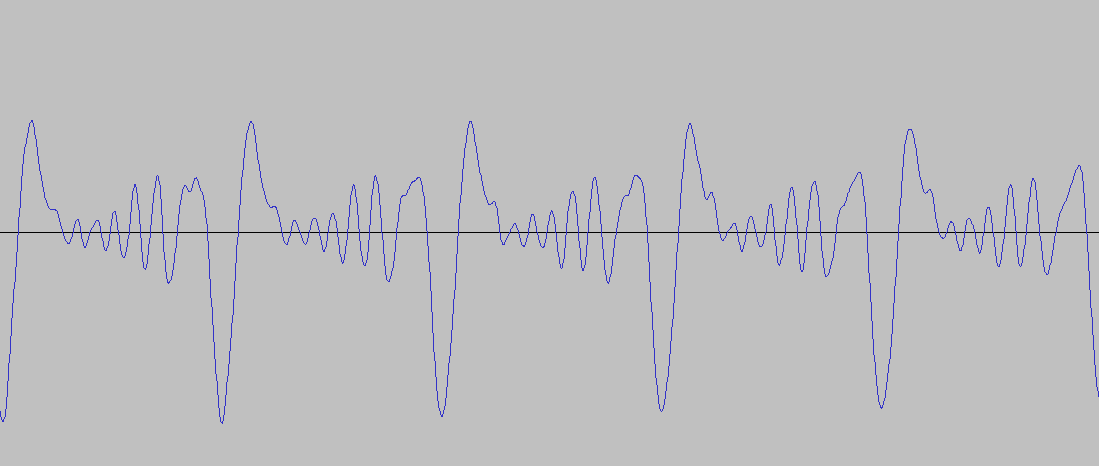
A period has a duration, that is, it is measure in units of time. Frequency is defined as the number of periods repeated per unit of time. Thus the relationship between frequency (f) and period (T) is defined in the following way:
f = 1/T
Therefore if a wave has a period T = 20 milliseconds or 0.02 seconds, the frequency will be:
f = 1/.02 = 50 Hz
Hertz or Hz means cycles or periods per second an it is the unit used to measure frequency. As shown in the previous session, Pd’s sine wave oscillator “osc~” receives frequency in hertz over its hot inlet.
2.5 Sampling and Sample Rate
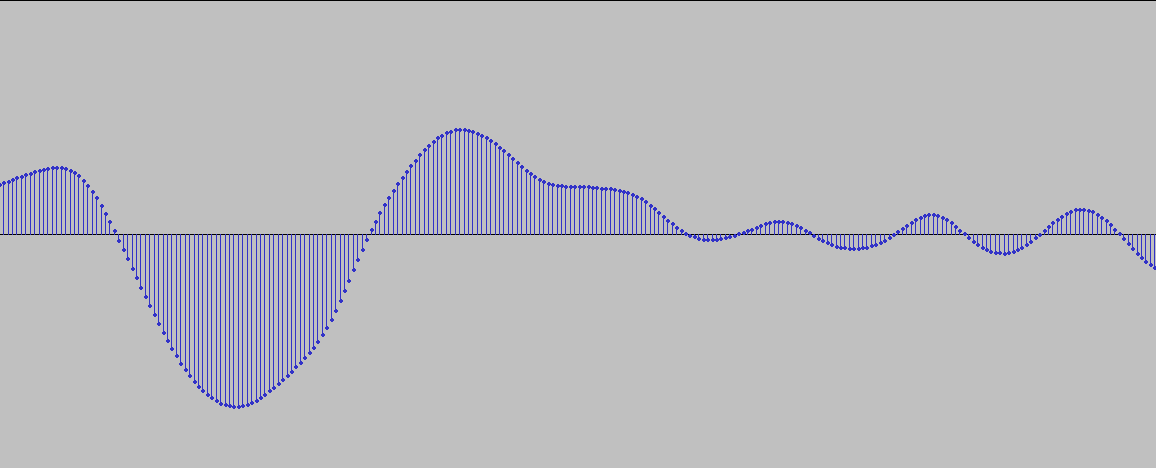
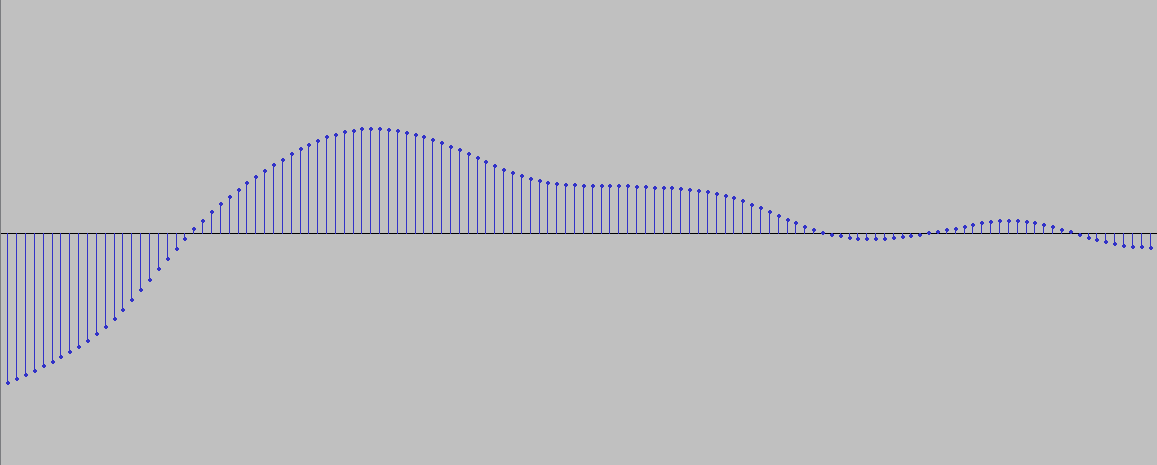
All sounds that are generated, modified, or stored in a computer, phone, or any other digital device are “sampled”, that is they are represented as digital measurements of sound pressure level taken at regular time intervals. In the images below you can see detailed representations of the same wave shown above, except this time we can see how the continuous wave is sampled at regular intervals. When we talk about samples then, at least for this part of the course, we are talking about individual measurements in a digital waveform, rather than of recorded sound snippets we play back in a sampler or a similar device.
So how does this work in Pd? As we saw in our setting up Pd, in the menu “media/audio settings/” you can set up the “sample rate” or “sampling frequency” for Pd. The minimum sample rate (of all the standardized rates) to cover the human hearing range is 44,100 Hz or 44.1KHz, as one needs at least twice the sampling frequency than the frequency that is being recording, according to the Nyquist or Sampling Theorem. Thus, at a sampling rate of 44,100Hz, the highest frequency we can sample is 22,500Hz. The reason this is true is that above certain frequencies the sampling rate might be insufficient and thus it will return the wrong frequency. We will see this shortly.
So let’s patch a little.
At a sample rate of 44,100Hz, create the patch below. You don’t need to copy the text and more information is given below the figure.
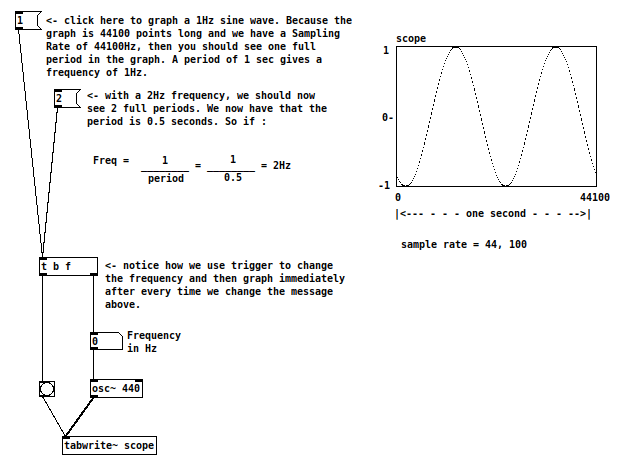
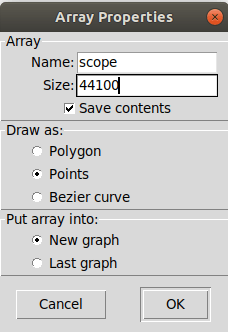 Check the helpfile for the object tabwrite~. To create the table on the right, go to the menu put/array and a properties menu window will pop up. Be sure to name it something and use that same name in tabwrite~. I chose “scope”. Let’s choose a size of 44100. Let’s leave the rest of options at their default value.
As you can imagine, if the table has a size of 44100 and our sample rate is 44100 Hz or samples per second, then our table will display one second of time.
So let’s graph a sine wave of 1Hz, and we should see a full sine period. What should you see with a frequency of 2Hz? two full periods! If you can’t graph remember to check if DSP is on!
2.6 Frequency and Pitch
Let’s now patch and listen for a second.
Create a patch with a number box connected to an oscillator connected to a dac~. Let’s create six message boxes to send the following values to our number box: 55, 110, 220, 440, 880, 1760. Switch to run mode and test your hearing. Can you tell what the interval you’re hearing is? The pitch you’re hearing is an “A”, which is standardized at 440Hz as evidenced by the term A440 and immortalized by the famous merengue band “La 440“. To hear another A at an octave below or above that one, you need to half or double the frequency respectively. Octaves are thus of different values in Hz. Because to obtain an octave we need to double the frequency, we can think of the frequency scale as an exponential or logarithmic function depending on how we look at things.
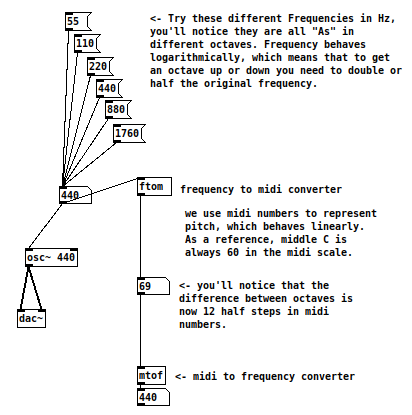 Pitch is not another word for frequency. In the pitch space, Octaves are the same size. In the tempered tuning system, an octave is divided into 12 equal steps called half-steps or semitones. In the arbitrary MIDI scale, A440 has the MIDI value of 69 and middle C is 60. Each semitone or halfstep has a value of 1.
Octaves then are 12 semitones long, so if A is 69, to go an octave lower, we need to subtract 12 semitones to get 57, and to move an octave up, we add 12 semitones to get 81. As shown in the right hand patch, it is possible to convert from Frequency to Midi pitch using the object “ftom” (or frequency to midi) and you can convert midi pitch to frequency using its complementary object “mtof” (or midi to frequency).
2.7 counters, pitches and oscillators
It is thus possible to edit our counter created earlier to generate pitches, to convert the output of our counter to frequencies that an oscillator can understand using the object “mtof”, and to hear them using an osc~ and dac~.
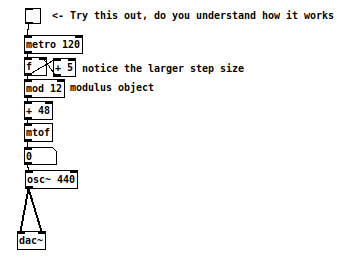
If we use our initial counter with “float” and “+ 1”, we are going to hear an ascending chromatic scale. You can control the range and ambitus by adding a minimum pitch and the “mod” object. Furthermore, you can also modify the counter itself to create descending intervals or intervals larger than a semitone. Check out the patch to the right and edit it to hear the changes.