10.1 env~ and measuring loudness
Today we start with the object [env~], which is an envelope follower. To follow an envelope in this case means to monitor de loudness or power of a signal at any given time. Earlier in the semester we distinguished between peak amplitude (the maximum absolute amplitude in a period of time). However, peak amplitude is not a good measure of loudness. To measure loudness we need to find out how much energy is a signal pushing in a given window of time.
A common technique is to square the values of a signal, so that all values become positive, then add them up and get the square root. In this way we get the root mean square or RMS amplitude.
env~ outputs loudness in dB, so your scale is both logarithmic and from 0 to 100. Anything above a hundred is going to clip.
10.2 Vocoding and the BARK scale
Vocoder is a name given to several different devices. All of these devices have in common that they try to reduce and encode information from the voice into smaller chunks of information or “critical bands”. For example, you can reduce the amount of information in a voice by using scales that take into account how we perceive frequencies as we tend to hear with more detail between 100-1000Hz than in the whole 10k to 20kHz range. These scales are not composed of notes, but of ranges or critical bands. Two well know “perceptual” or “psychoacoustic” scales are the BARK and MEL scales. We will use the BARK scale for our vocoder, as shown below and extracted from Wikipedia, but you can also go and find the frequencies used by your favorite vocoder, generally by looking the manual or other documentation that might have this information.
| Number | Center frequency (Hz) | Cut-off frequency (Hz) | Bandwidth ([Hz) |
|---|---|---|---|
| 20 | |||
| 1 | 50 | 100 | 80 |
| 2 | 150 | 200 | 100 |
| 3 | 250 | 300 | 100 |
| 4 | 350 | 400 | 100 |
| 5 | 450 | 510 | 110 |
| 6 | 570 | 630 | 120 |
| 7 | 700 | 770 | 140 |
| 8 | 840 | 920 | 150 |
| 9 | 1000 | 1080 | 160 |
| 10 | 1170 | 1270 | 190 |
| 11 | 1370 | 1480 | 210 |
| 12 | 1600 | 1720 | 240 |
| 13 | 1850 | 2000 | 280 |
| 14 | 2150 | 2320 | 320 |
| 15 | 2500 | 2700 | 380 |
| 16 | 2900 | 3150 | 450 |
| 17 | 3400 | 3700 | 550 |
| 18 | 4000 | 4400 | 700 |
| 19 | 4800 | 5300 | 900 |
| 20 | 5800 | 6400 | 1100 |
| 21 | 7000 | 7700 | 1300 |
| 22 | 8500 | 9500 | 1800 |
| 23 | 10500 | 12000 | 2500 |
| 24 | 13500 | 15500 | 3500 |
10.3 Energy in each critical band

To find out how much energy there is in each critical band, we need to filter a sound with a band pass filter and then use an amplitude follower. In this case, we will use vcf~ and we will make each filter into an abstraction. I saved this abstraction as “fi”; I recommend you use a very short filename.
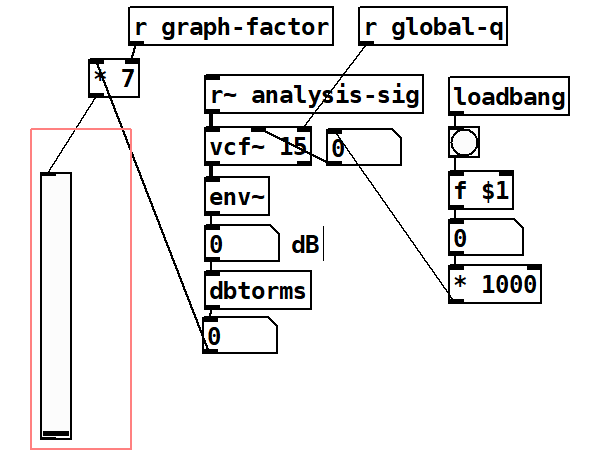
You can see an implementation of the analysis filter in Figure 10.1. In this case, we use an incoming signal (adc~ in this case), send it to a vcf~ (with a default q of 15, and connected to a global parameter called “global-q”) into an env~. As env~ is RMS in dB, we convert to our linear 0-1 scale with dbtorms. Only for the purpose of graphing, we use a multiplication factor called “graph-factor” (default of 7 in this case).
Finally, since this is an abstraction, we will make the center frequency of the filter the first and only argument of this abstraction. To obtain this value, we bang an object [f $1]. In order to write the argument in Kilohertz, we then multiply by 1000 before sending the frequency to the filter.
10.4 main program and analysis
To load the filters, we create a “main” or upper level patch. We create 24 filters, one for each critical band, and use the center frequency values of each critical band shown above in Khz as shown in Figure 10.2. As you can see, it is strategic to use a short filename for the filter abstraction and kilohertz as a unit.

A collection of filters like this one is called a filter bank. In this case, I am singing the vowel A and I am getting that energy distribution along the critical bands. We have thus reduced the amount of information of the voice to 24 critical bands.
10.5 subtractive synthesis stage

The filter vocoder we are using here is used to give the amplitude envelopes of one signal’s critical bands to those of another signal. The first signal we are using is the voice (adc~) and the second signal, is a complex wave of some kind (sawtooth, triangle, square, etc). Thus this is a kind of voice controlled subtractive synthesis.
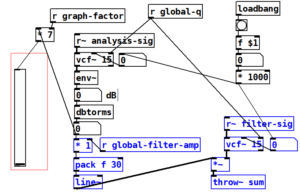
In order to achieve this we must modify our filter to apply the information obtained from the voice to our synthetic signal. An implementation is shown in figure 10.3, with the modifications shown in blue. After we analyze the voice signal as shown in Figure 10.1, we filter our synth signal using the same frequency and q. We then multiply the output of the vcf~ by the amplitude obtained in the analysis stage. In this case I added a global amplitude called “global-filter-amp”, but you can also add it as a main volume control after catch~ sum, which is now sending directly to the dac~.
10.6 your synth signal

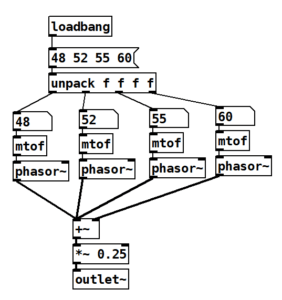
As I mentioned earlier, your synth signal is generally controlled by a keyboard. The challenge for you is to implement a quick “complex wave” polyphonic synth. For testing purposes though, you can use the little synth I made and is shown in figure 10.4.
10.7 vocoder sensitivity
You may find that your vocoder is not reacting as fast as you expected. As I mentioned earlier, the env~ object performs analyses on windows of time, so you can change the size of the time window. The default size is 1024 samples and window sizes are usually powers of two, so you can improve by trying window sizes of 32 and 64 by adding an argument to env~. Try it!
Finally, you may also want to try different values for q and listen to what value you prefer.