Categories
6. Final

Final Project – The Sound of Topography

The Sound of Topography

Overview

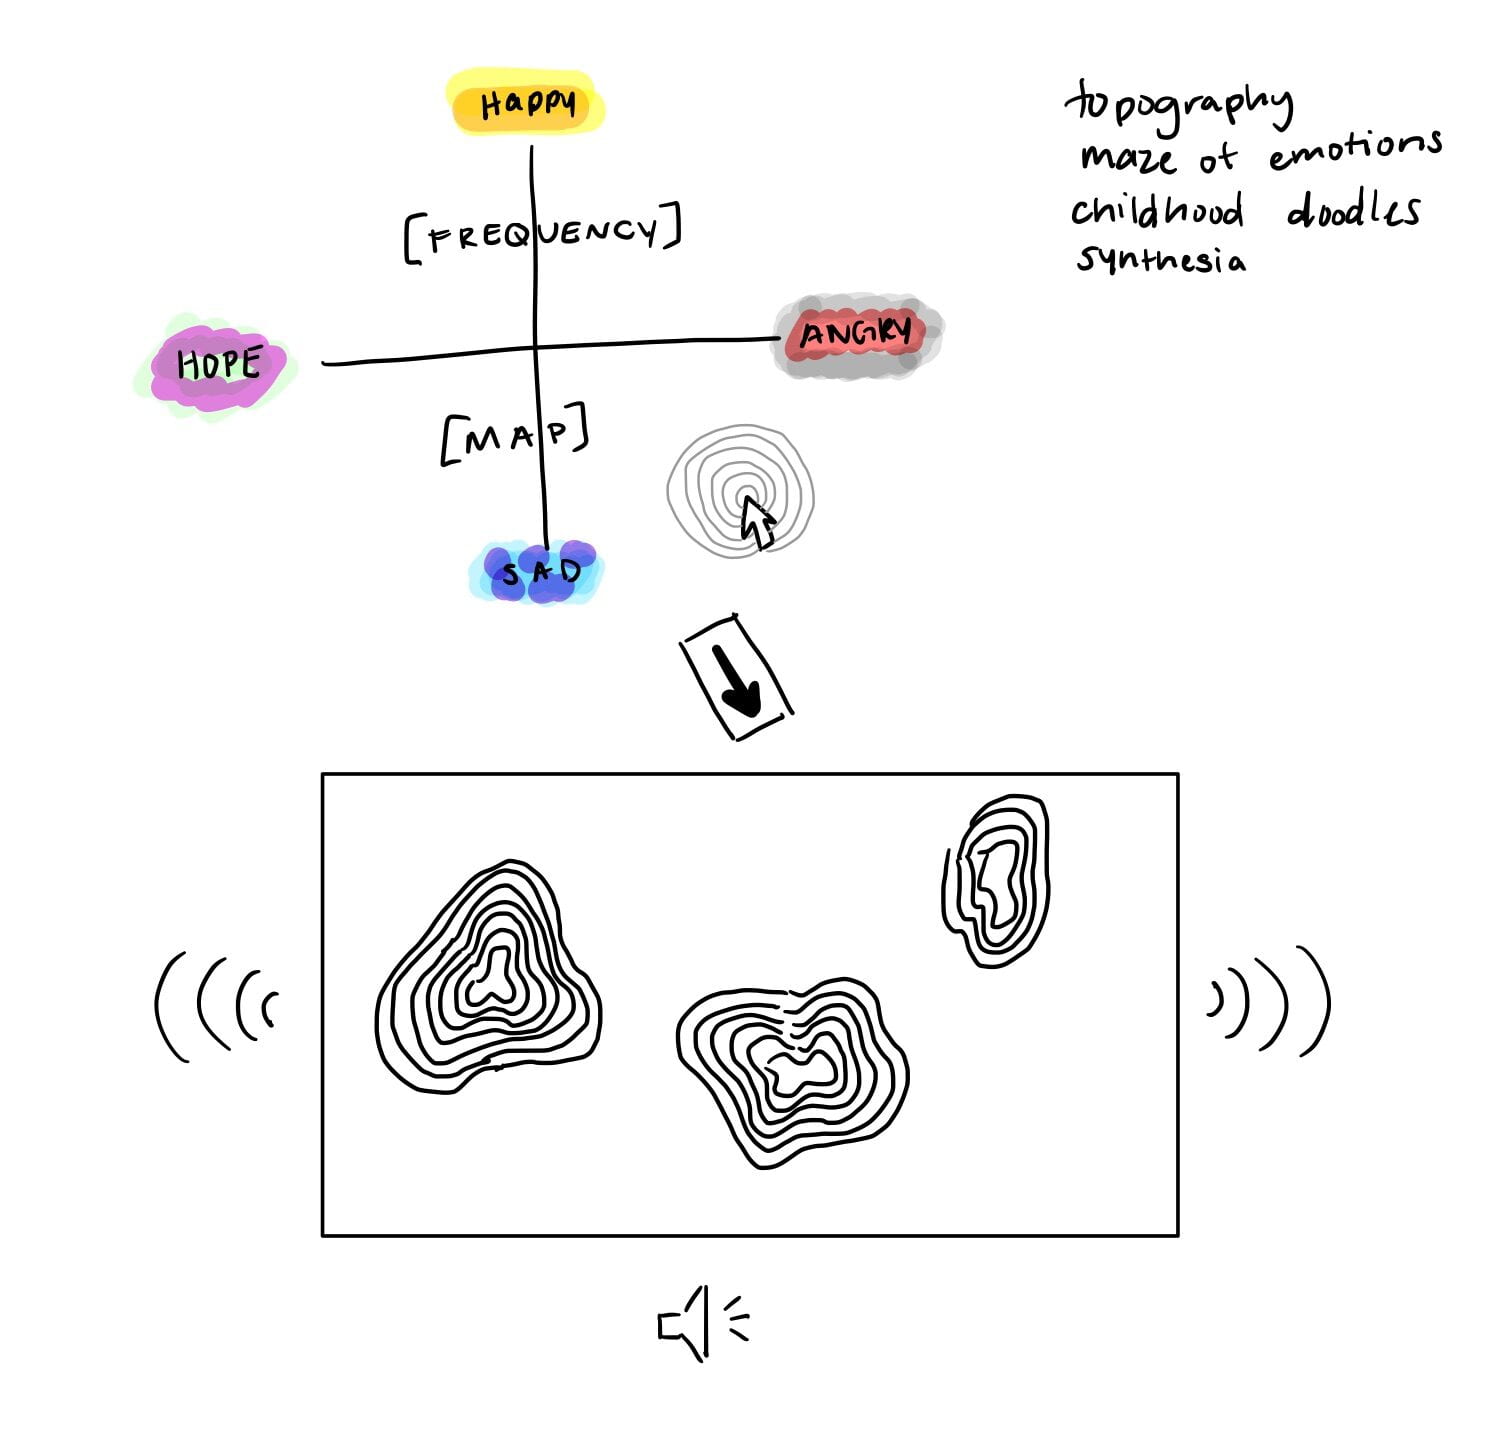
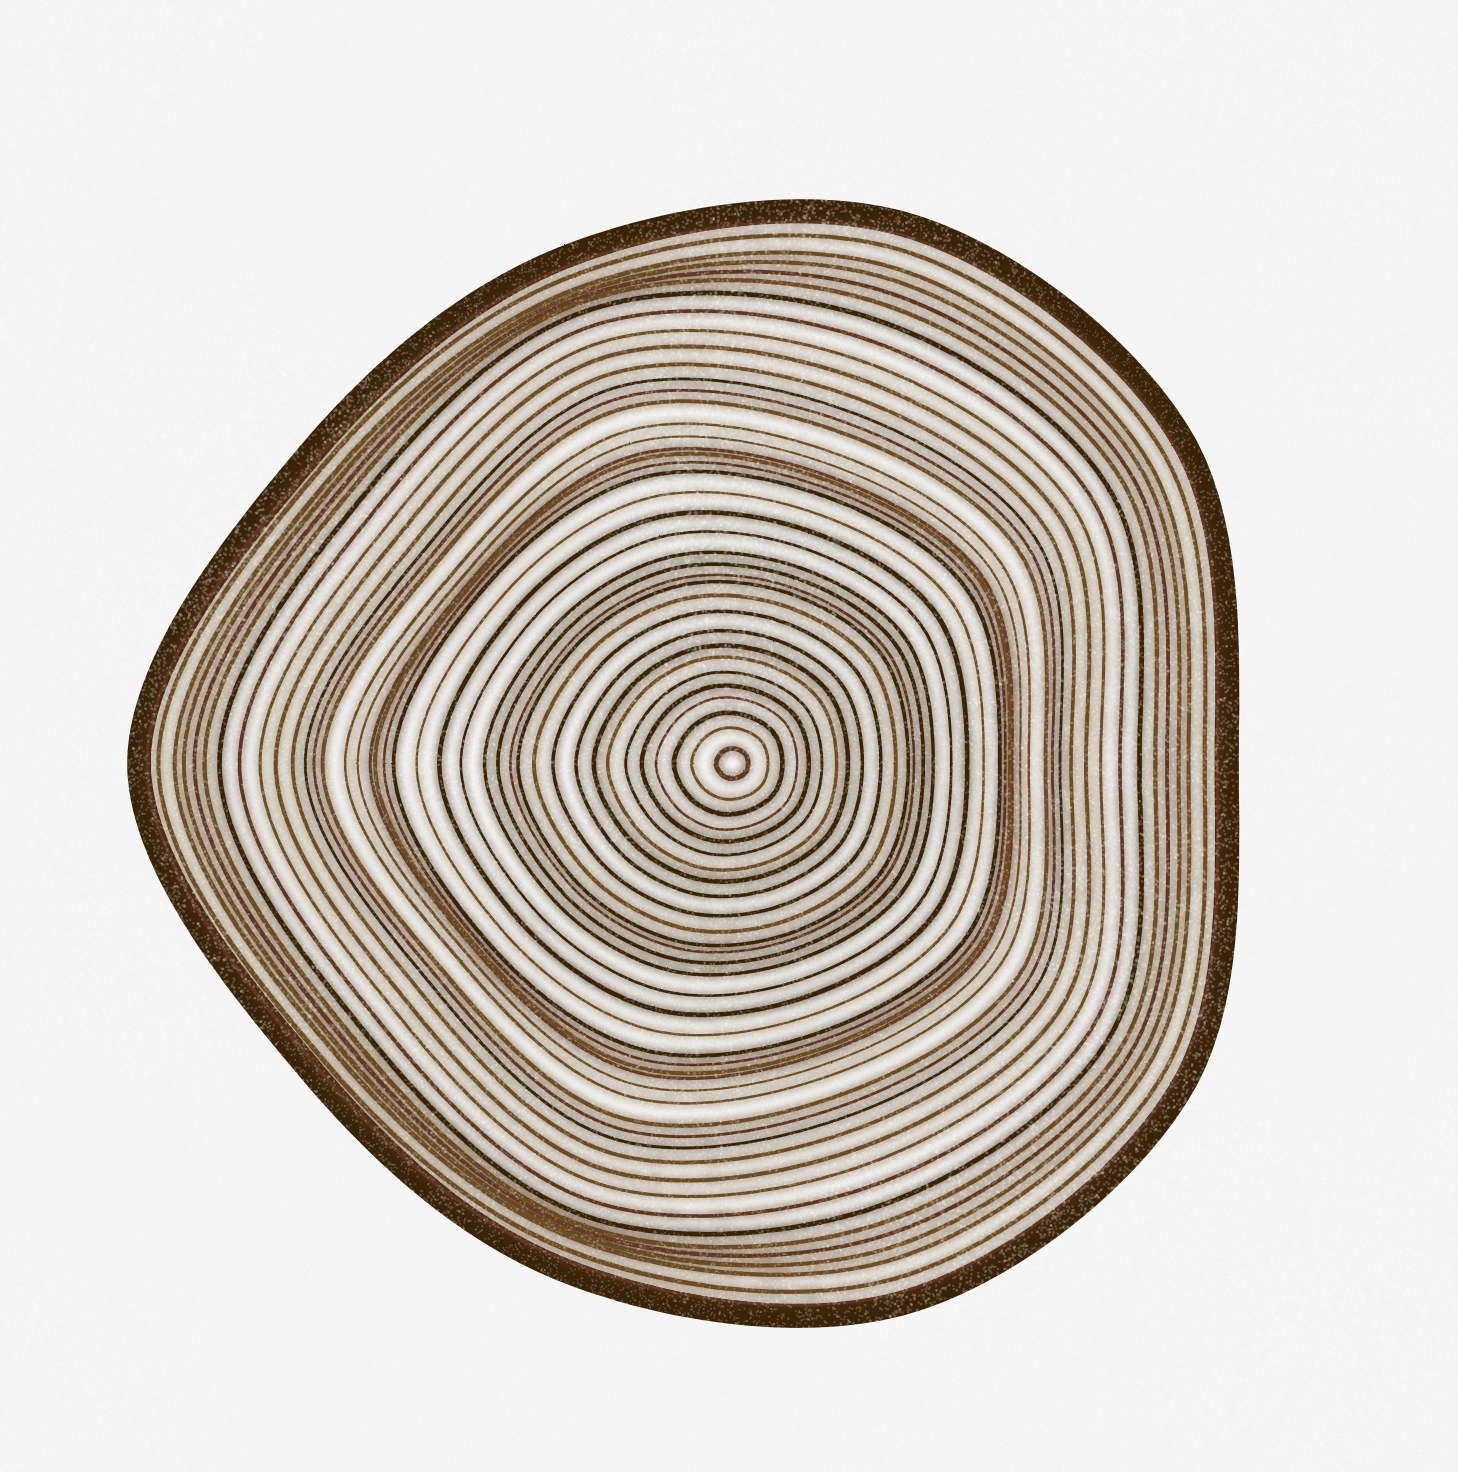
Throughout my time in middle an high school, my attention often drifted in class and I would find myself creating doodles in the margins of my notebooks. One of my favorite things to sketch were circular squiggly lines that repeated themselves growing further outward over and over and over again. It wasn’t until recently that I discovered that those doodles closely resemble topographic maps. Topographic maps are great visualizers of geographic terrain. Lines, line thickness and proximity, and color are used to convey real places two dimensionally.

Initial Sketch + Inspiration

200730 by Sayama: https://openprocessing.org/sketch/939229
Marble Lake Series by andreadiotalleviart: https://www.instagram.com/p/CW0LsVetI1e/

For the project I wanted to create three dimensions from two, and add sound and color to create a complete three dimensional audio-visual experience. I loaded 10 images of topographic maps and have the program randomly choose three images at a time when the user clicks the canvas to display with varying transparency values controlled by the lerp function. Then, based on the RGB value located at the current mouse position, a three-note chord is  generated using p5JS oscillators that correspond to a frequency on a scale comprised of the middle notes ABCDEF. The sound can be toggled on or off using a controller in the bottom right of the canvas.


https://editor.p5js.org/ozioma/full/fDTKTxduH 


Bibliography

The Coding Train Sound Synthesis Tutorial: 17.6: Sound Synthesis – p5.js Sound Tutorial

Music Note Frequency Reference: https://pages.mtu.edu/~suits/notefreqs.html 

P5Js Sound Library: https://p5js.org/reference/#/libraries/p5.sound 

Categories
6. Final

Final Project

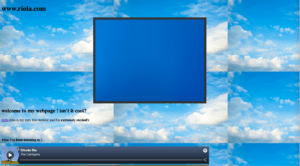
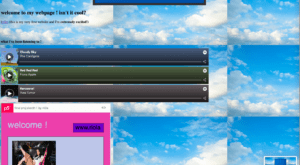
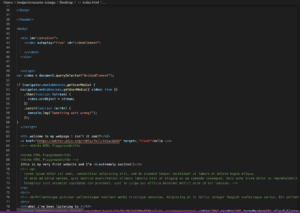
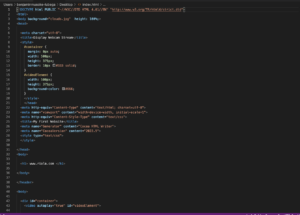
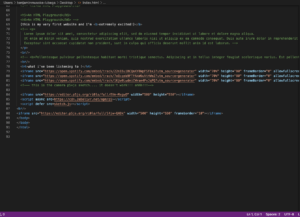
For the creative coding final, I sourced inspiration from early-internet aesthetics. I was really interested in the work of Olia Lialina and her research on geocities. I think that early-internet web pages are extremely interesting because the format is less formulaic. I was also interested in the musical aspect of personal blogs that was popular on Myspace. I really love the way that both geocities and Myspace pages looked like people were really trying to share a piece of themselves with the world. I wanted to properly embed my P5*JS camera sketch, but found myself running into trouble trying to upload it separately onto my own server. I ran my html website off of a local server so attached are the screenshots and my code, I am hoping to make this website public in the future!

https://editor.p5js.org/ri0la/sketches/I4jw-QADk

Categories
6. Final

Posture Corrector

My final project uses machine learning to create a posture corrector. It works as a monitor for your posture during working sessions or extended periods of time standing or sitting down. It should be set up on the user’s side, and based on whether the person using it is slouching or not, the sketch interacts with the user and the computer in different ways. Time also plays a role on the outputs of the sketch.

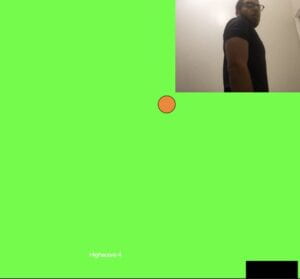
While a correct posture is detected, a game runs on the screen. Every 10 consecutive seconds increases the user’s high score by 1, causing the ball to get thrown in the hoop. If slouching or bad posture is detected, the game disappears and the high score is reset to zero.

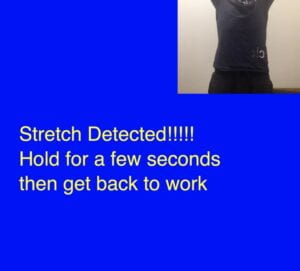
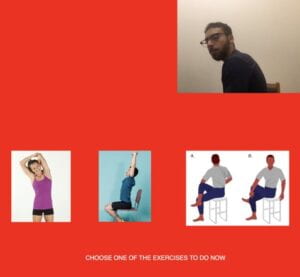
After a certain amount of time an alert is shown on the screen displaying three stretches to be done. If the user remains in the slouching position for a certain amount of time, a new tab will open to an image that takes over the screen. If a correct position is not detected after a long amount of time, then the tab will continuously open up causing the window to crash. The sketch can also detect when the user stretches and encourages them to hold it for a longer period.

Process sketches 

Images:

Output after 50 detections of slouching:

Output after 200 detections of slouching:

Output after 600 detections of slouching:

Output after 4500 detections of slouching:

Sketch:

https://editor.p5js.org/zme209/sketches/GELPE9NpR


Categories
6. Final

Final Project – Five Variations on a single Dataset

The Project

For my final project, I wanted to create a project that raises awareness about environmental issues that are otherwise overlooked. My goal with this project was to portray the data in a creative way that does not intimidate people from learning more about these issues.

I chose to use a JSON file containing data about indoor environmental complaints to 311 found on NYC open data. Inspired by Max Bill’s Fifteen Variations on a Single Theme v. 9, I displayed different environmental complaints for each Borough as bubbles on multiple circles. I also looked into the science of colors when choosing a color scheme to make sure that the data looks appealing. Users can interact with the project using their voices. When they say a name of a borough in New York City (Manhattan, Brooklyn, Bronx, Queens, and Staten Island) its respective data is displayed on the screen. 

The sketch goes through the first thousand complaints and adds a small color coordinated bubble on the circle outlines. It also displays the number of each complaint type in the borough being displayed, as well as the total number of complaints out of the first thousand.

Process Sketch Images

Embedded Sketch


Sketch Link: https://editor.p5js.org/ym1820/sketches/nOu-LQknH 

Bibliography: 

Aho, T., Niittyvirta, P. (2020). “Coastline Paradox”. Experiments with Google. https://experiments.withgoogle.com/coastline-paradox 

Bill, M., (1935-38). “quinze variations sur un même thème”.  Dalmier Art Collection. https://art.daimler.com/en/artwork/quinze-variations-sur-un-meme-theme-15-variations-on-one-theme-max-bill-1935-38-2/ 

Department of Health and Mental Hygiene. (2021). DOHMH Indoor Environmental Complaints [Data set]. NYC Open Data. https://data.cityofnewyork.us/Health/DOHMH-Indoor-Environmental-Complaints/9jgj-bmct

Google. (2019). “Teachable Machine.” Teachable Machine. https://teachablemachine.withgoogle.com.

Lupi, G., & Posavec, S. (2016). Dear Data. Princeton Architectural Press. http://www.dear-data.com/theproject

Shiffman, Daniel. (2019). “Teachable Machine 3: Sound Classification,” The Coding Train.  https://editor.p5js.org/codingtrain/sketches/e3nrNMG7A

Thomaskjellberg. (2010, September 8). Fifteen variations on a single theme. Rules Based Design. Retrieved December 10, 2021, from https://rulesbased.wordpress.com/2010/09/08/fifteen-variations-on-a-single-theme/

 
Categories
6. Final

[FINAL] Falling Bird – Ama


Falling Bird 

My final project is an educational game surrounding air pollution. I wanted to bring more awareness towards it because it is one of the less talked about environmental issues. 

I took inspiration from a high school competition surrounding the pollution of our oceans. The program hosting the competition is a foundation called Bow Seat, an Ocean Awareness Program. I took their concept and mission for communicating through art for the oceans, I wanted to do the same for our air. Moreover, I took inspiration from the widely popular fun game flappy bird. I wanted to draw people into the game not one for the concept, but the aesthetic as well. 

 

Figure 1   The Bow Seat Foundation logo

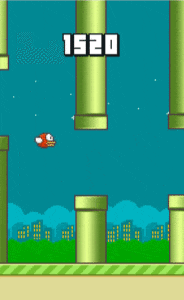
Figure 2   An image of the popular game, Flappy Bird, in progress

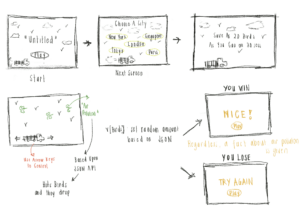
The graphics for my game came out to be the image that can be seen below in the demo. I made an initial sketch for my game. I made an option for the user to choose one of the five given cities, New York, Paris, Delhi, Shanghai, and Tokyo. The goal of the game so far is to save twenty birds in thirty seconds. Afterward, whether the player wins or loses, they are given a fact surrounding air pollution. 

I created the game’s background using a program called Inkscape. I learned it was a great program to design vector art that fit into the aesthetic I had in mind. 


Figure 3   My initial sketch for my game 

Based on Figure 3, my game is split into five scenes. The first scene is the title scene; introduces the game to the player. The second scene is called cities. This is where the player chooses one of five cities. The third scene is where the player gets to play the game. The player is to catch twenty birds in thirty seconds. Afterward, the player reaches the end of the game. This scene is split into two based on whether the player wins or loses. Regardless of whether the player wins or loses, a fun fact is displayed for them to read and sound effects will play. Each scene was easily made using p5.Scene Manager. It made the process of creating the game much easier compared to the initial way I approached coding the game manually. 

As proceeded to code my game into fruition, I realized, I did not include instructions on how to play, creating the Title and Cities scene (Video 1). My initial plan was to include it under each individual city sketch, but I realized it would be easier to show it once, so I included the instructions as an additional scene (Video 2). 

Moreover, in Video 2, getting to the end, I was able to add a scoreboard, timer, and the moving truck used to catch the birds as they fall. The birds that went across the screen are from the title screen were eventually removed and left the truck movement on the title screen. 

First and foremost, I tried working under one city to make coding easier. Once, I was able to get it working for one, I can get it working for the rest. With this in mind, the next step was adding the birds, the air pollutants, and collision recognition were next on the list. This was my greatest challenge, especially since some parts of the p5.play library and examples did not have many helpful examples. The air pollutants I drew in Procreate and named them based on some of the components forming air pollution. The bird animation I found on Google was perfect because of its pixelated design and fit the aesthetic of the game. Initially, I made a for loop to create a group of birds but did not know how to go about checking to see if there was an overlap between the bird and the pollutants and the bird and the truck. Here, my professor helped in writing this part of the code. A group was created in the form of an array and the sprite was added to the array. This way, the array can be used in a for loop and each bird can be individually checked. 

If the bird and air pollutants overlapped each other, then the bird y-position increased and its velocity in the y-direction depended on the JSON API data added for each city. 

An example of the JSON API can be seen below. 
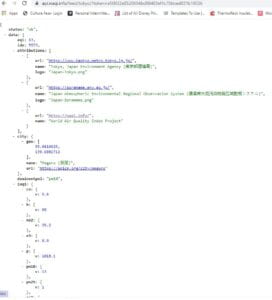
Figure 4  & 5  JSON API
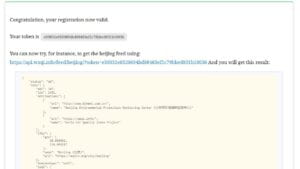


The following videos demonstrate the progress of my work based on my concept and sketch.

The velocity was set to a variable using the map function, so it convert the AQI of the city. Afterward, the next step was the end of the game. I had to display whether the player either won or lost based on their score once the time was up. Displaying the fun fact was a bit of a challenge than I anticipated. The fun facts were stored in an array, and I used a variable, index, and set it to a random integer, but since it was under draw or a function under draw it was collected and modified continuously. I attempted at adding a boolean to prevent it from continuing, but to no prevail. 

In order to get a stable number, I added a variable to store the number of birds collected. Based on that number, it was divided by 2.75; this allowed for the facts to be displayed. 

My last problem was the play again and try again option. As a player, you can successfully click on it, but to transition backward, the previous scene would go onto the next. To solve this dilemma, I have to ‘reset’ the game, so at the end, the score, and time had to be reset to the original numbers, and the group had to be cleared and sprites’ visibility from true to false and vice versa. 

In the end, the game finally came out smooth and nice. Enjoy the demo of the game at the bottom of this page, right before the references. 

Video 1: Shows the initial title and city scene

Video 2: Shows the title, instruction, and cities scene. 

Video 3: The group of pollutants and birds were added, but new problems arose, such as the fun fact section, and the previous scene playing in the next. 

Video 4: The game fully functions, but the play again button fails to go through. 

Video 5: Shows the play again/try again button working, but the air pollutants are not visible while playing again. Also, the number of birds saved is displayed here to help keep track.

FALLING BIRD DEMO

Sketch Link: https://editor.p5js.org/aatlove/full/GdH0QIqIO


References

“Ambient (Outdoor) Air Pollution.” World Health Organization, World Health Organization, https://www.who.int/news-room/fact-sheets/detail/ambient-(outdoor)-air-quality-and-health.

Pedercini , Paolo. p5.Play. https://molleindustria.github.io/p5.play/.

Purohit, Bhumi. “10 Facts about Air Pollution.” Smart Air, 15 Dec. 2020, https://smartairfilters.com/en/blog/10-facts-about-air-pollution/.

Veteanu, Marian. p5.SceneManager.https://github.com/mveteanu/p5.SceneManager

The World Air Quality Index project. “Chất Lượng Không Khí Trên Toàn Thế Giới: AirNet Sensor Network.” Aqicn.org, https://aqicn.org/api/.
 

Categories
6. Final

Final

code: https://editor.p5js.org/CaydenHorne/sketches/vCQSoJChp

presentation: https://docs.google.com/presentation/d/132apSh_ZsqQvZmVz6bFqSHdkqHZa2XckYao6_7EB7pI/edit#slide=id.g6c52a2e8d8_0_177

*i am unsure if it will all work due to the mix of my code and my reference

Categories
6. Final

Final Project – Song Frequency Analyzer

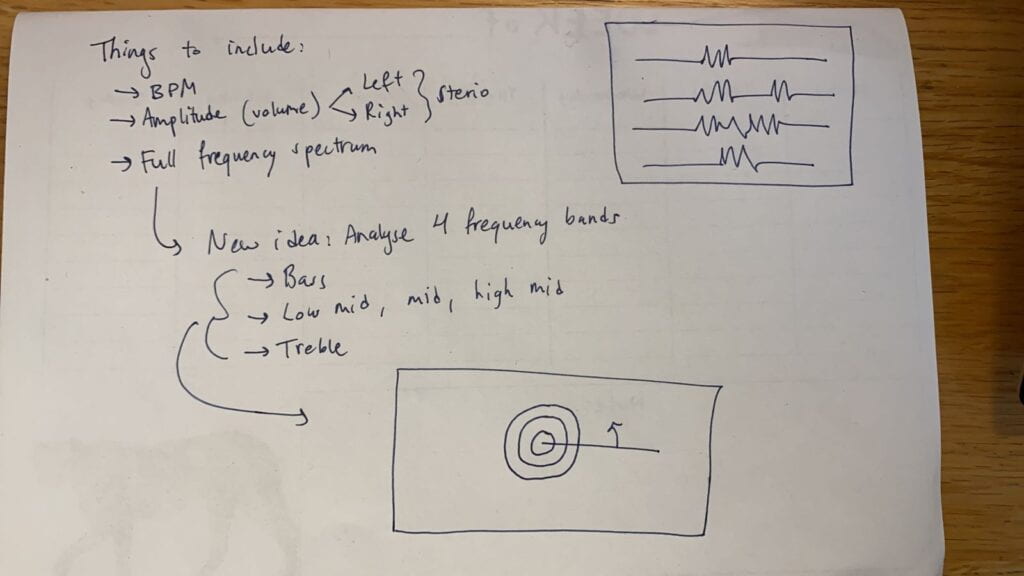
For the final project of the semester, I decided to create a frequency visualizer for a few songs. I also wanted to incorporate a JSON file, so I wrote songs.JSON, which includes the titles, artists and indices of 11 songs. Those same 11 songs are loaded onto the project as mp3 files under the folder songsaudio. My initial ideas included a more useful display for music producers with a linear display. The first ideas that I thought of displays were BPM, volume of stereo (left and right separately) and the volume across the entire frequency range. After understanding how important specific frequency bands are for music producers, I decided to display 5 frequency bands. In order to make my display more artistic (at the cost of usefulness to actual producers), I decided to change to a circular display. This made the result of the project aesthetically pleasing to look at.

The main sketch.js file basically picks one of the 11 songs at random to analyze every time it is run. There are 5 bands: Bass, Low Mid, Mid, High Mid and Treble. Each band is analyzed for an iteration and its history is stored in an array. In order to avoid any crashes of the browser with the size of the arrays growing indefinitely, I limited the array size for each band to be 360 indices and each index represents 1 degree in the circle.

Attached below is a sample run of the code where Save Your Tear by The Weeknd is picked out of the 11 songs:


Here is the link to the code


Bibliography:

  • “Reference.” Reference | p5.Js, https://p5js.org/reference/#/p5.FFT/analyze.
  • “Reference.” Reference | p5.Js, https://p5js.org/reference/#/p5.FFT/getEnergy. 
  • Shi, Ziyi. “Creative Coding Midterm assignment1.” Medium, Medium, 26 Oct. 2021, https://medium.com/@zs2414/creative-coding-midterm-assignment-5e5cc88c8c91. 
  • “Array.prototype.splice() – Javascript: MDN.” JavaScript | MDN, https://developer.mozilla.org/en-US/docs/Web/JavaScript/Reference/Global_Objects/Array/splice. 
  •  
  • Playground – Waves Gallery View | Playground. https://www.playground.ink/gallery/. 
  • “Chromie Squiggles Explorer.” Chromie Squiggle Explorer, https://chromie-squiggles.com/.
  • All the Shiffman videos under the Sound Library, only the first is cited:
    • shiffman. “17.1: Loading and Playing – p5.Js Sound Tutorial.” YouTube, YouTube, 7 June 2016, https://www.youtube.com/watch?v=Pn1g1wjxl_0&list=PLRqwX-V7Uu6aFcVjlDAkkGIixw70s7jpW. 


Categories
6. Final

Final Project Reflection Post


1. Link to The Code: 

https://editor.p5js.org/yl7799/sketches/VBzrDgGxx


2. Description: 

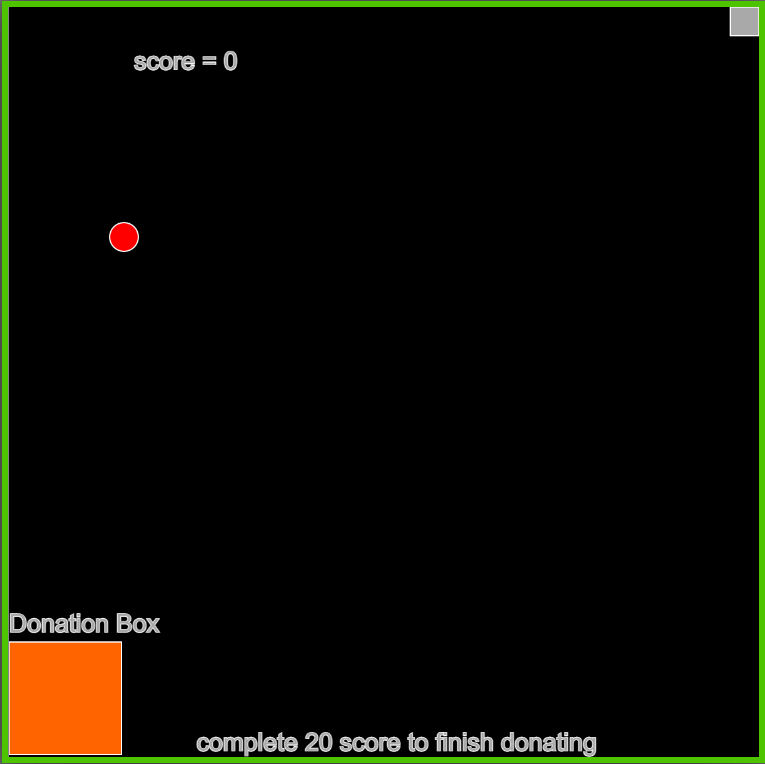
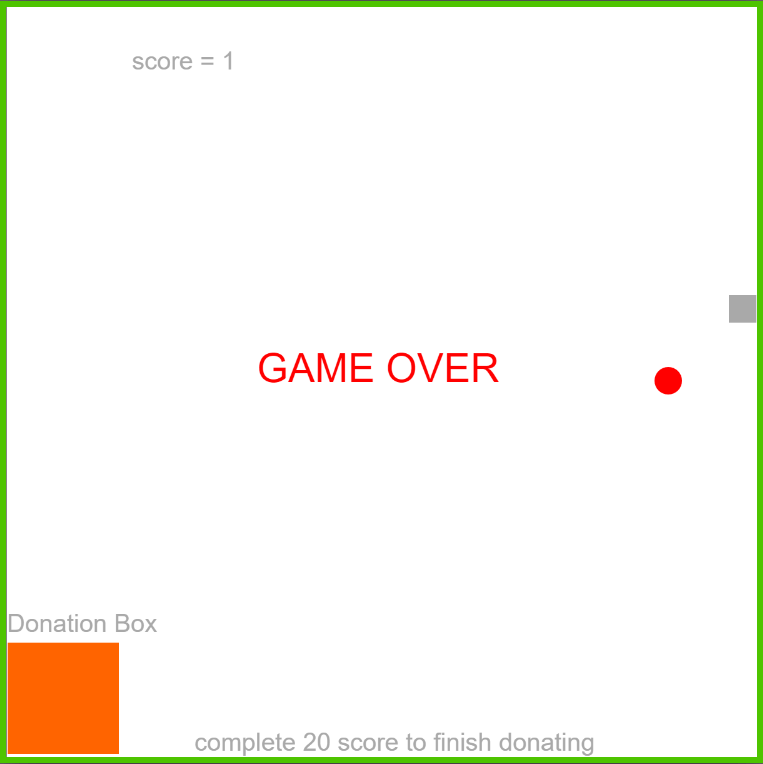
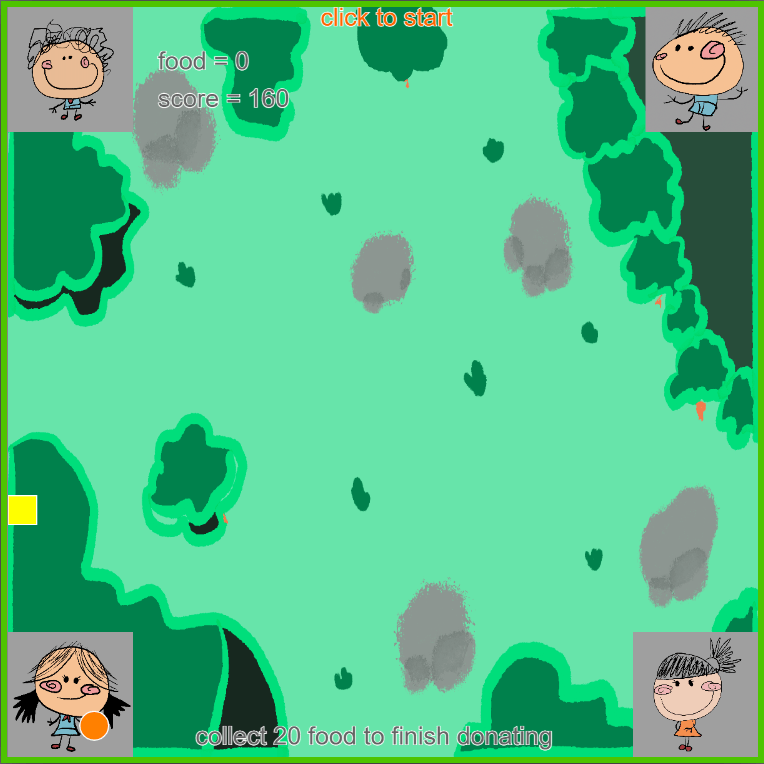
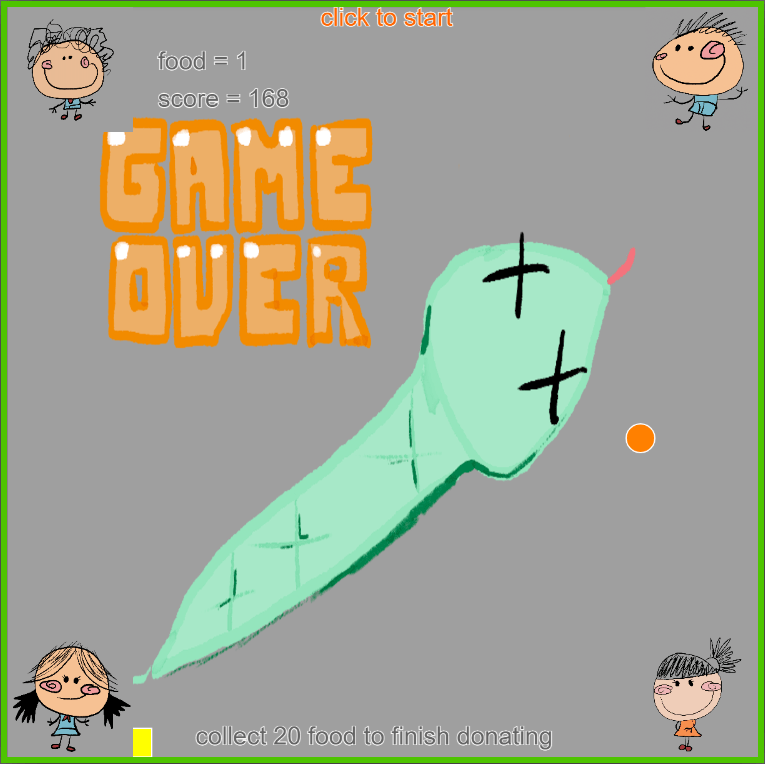
This game is made in JavaScript using p5js. It is a game controlled by the keyboard. The character controlled by the player is a snake. Like the Traditional Snake Game, the player needs to use the keyboard to control the snake’s direction and let it eat the food. When the snake is controlled by the player who eats food, the length of the snake will grow. What’s different from the Snake game is that the snake needs to donate food to the children. I got this idea from our classmates’ suggestions and learned this from the game Overcooked. Like this game, the player needs to press the keyboard to send the food picked up by the snake to the four children on the corners, just like in overcooked, the player needs to control the character to serve food to the customer. When the player successfully delivers the food to the children, the score on the game will increase, so the player wants to stay in the four children’s zones as long as possible to get a higher score. However, it is worth noting that players cannot let the snake touch the boundary of the canvas. Otherwise, it will be regarded as a failure of the game. I intentionally put the children on the corners, that if the player lets the snake stay in the children’s zone for too long, it will eventually let the snake to death, to remind players do not to be too greedy.


3. Process Sketches:


4. Final Work:


5. Bibliography:

Overcooked, Windows, PlayStation 4, Xbox One, Team 17, 2016

Snakes, Nokia, J. Dan Scott, IOMO, 2005


Categories
6. Final Uncategorized

Final Project – Paloma

Project

code


For my Final Project, I created a music note visualizer that can allow users to learn how to read music by playing the desired note and then seeing it appear on a stanza. 

Process: 

When I was creating this project, I first has to get an understanding on how I would want the music notes to appear on the stanzas. I imported photos of quarter notes and then I started playing around with the size and positioning of these notes. I wanted to make sure that every note was recently spaced out on the stanza well. I spent time trying to find the perfect amount of spacing for the x and y coordinates of each note. I knew that no matter what, the C note would always have the same y position, but the x position will change depending on when it was pressed. So After I found each of the notes y coordinates, I then figured out how many spaces I wanted between each note. I stored the x coordinates in an array. I also have a global variable that keeps track of the positon of the array, that way each time a button is pressed, the global variable is incremented, causing it to position the next note and the new location. 

When it came to creating the buttons, it wasn’t that challenging once I fixed some of the issues  I had with importing the library. I also created a play and clear button to allow users to play their current song and clear the entire song, and start over. 

Challenge: 

The one issue I’m having with my project is when I go to play the sound, it does not play each note individually. Although I have a for loop iterating through and playing each individual note, I believe the issue is the for loop is iterating too fast through the notes so maybe this is causing the notes to blend together. 

Categories
6. Final

Final Project – ASL Spell by Laura Lachin

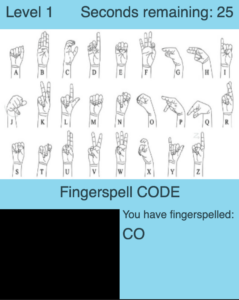
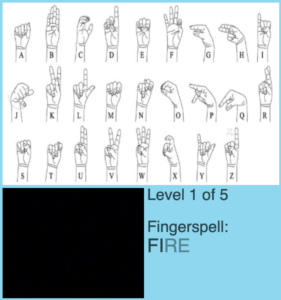
My final project is called ASL Spell. It is a game where, for each of the five levels, the player must fingerspell the randomly given word using the American Sign Language alphabet. To fingerspell a word means to spell a word by signing each individual letter. The first level has four letter words, the second level has five letter words, the third level has six letter words, the fourth level has seven letter words, and the fifth level has eight letter words. Each level has four possible random words.

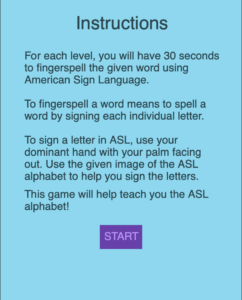
When the sketch is started, the player is shown the “Welcome” page which has instructions and information about what fingerspelling is and how to properly fingerspell. Once the player has read everything, they should click the “Start” button, which then brings them to level one. Each level has an image of the ASL alphabet. Once the player successfully signs the leftmost letter, the letter will turn a darker blue. After this occurs, the player should move onto the next letter. Once all the letters have been successfully signed, a “Next” button will appear. Once clicked, this will bring the player to the next level. After the fifth level, the player is presented with “Great Job!”

I decided to make this game because ASL is an amazing language and is one I think everyone should know the basics of. I believe it is important to be able to communicate with deaf and hard-of-hearing people without the need to use a different mode of communication, such as a pen and paper.


Initial Sketches:InstructionsGame screenFinal Sketches:

Welcome pageGame screen


Video Demonstration:

LINK TO VIDEO IF IT DOES NOT PLAY

LINK TO CODE


Bibliography:

Borgwardt, Jay. 2021. “The ASL Machine.” P5.Js Showcase. 2021. https://showcase.p5js.org/#/2021-All/The-ASL-Machine/.

Brain, Tega. 2021. “SceneManagerExample.” P5.Js Web Editor. December 2021. https://editor.p5js.org/brain/sketches/CeLmFJqD7.

Google. 2019. “Teachable Machine.” Teachable Machine. 2019. https://teachablemachine.withgoogle.com.

LiveChat, Inc. n.d. “LiveChat.” LiveChat. Accessed December 14, 2021. https://www.livechat.com/typing-speed-test/#/.