Categories
6. Final

Final Project Documentation

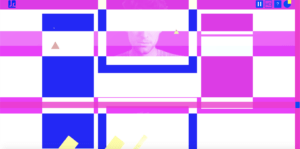
I used the sound library in p5js to create a keyboard instrument for my final project. The initial idea for my project is that the user can use both of the keyboard and the mouse to play a piece of music, and while the user is interacting with the keyboard or the mouse, a random geometric shape with different colors will be generated as well. However, throughout the process of making it, I realized that it could be more user friendly if I change the mouse interaction part on canvas into a grid, so that the user will know where to click for the sound that they want. 


Here is the code that I used in editor:

https://editor.p5js.org/ys4136/sketches/RIWpJhEHW

Here is the project in full screen:

https://editor.p5js.org/ys4136/full/RIWpJhEHW
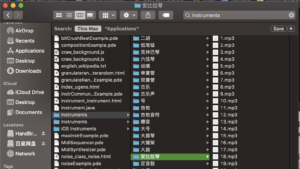
The first thing that I did was to find the appropriate soundtracks that suited my project. I found this video on bilibili.com, and downloaded the zip file of the soundtracks that the video uploader has shared. Then I uploaded the soundtracks that I decided to use in my project to p5js. I used the function called preload to load the sound files in my sketch and used them by using .play(). I also used the function of mousePressed and keyPressed to play the soundtracks. Inside of the draw function, I drew the grid for the percussion instrument. 

Bibliography 

jonobr1. “PATATAP.” Patatap. Accessed December 14, 2021. https://patatap.com/.

【后期必备】60大类乐器音效,无套路免费分享,爱乐器爱音乐人士必入不悔!. 【后期必备】60大类乐器音效,无套路免费分享,爱乐器爱音乐人士必入不悔!_哔哩哔哩_bilibili, 2021. https://www.bilibili.com/video/BV1jM4y137wj?spm_id_from=333.999.0.0.
 
 
Categories
Research Post

Research Post 4

The 3 major inspirational references that inspired my project were keyboard instrument patatap, dot piano, and jazz computer. Keyboard instrument patatap is a project where the computer is acting as an instrument, and different notes will be played when different keys are pressed. The reason for me finding this project interesting is that this project gives its users many freedom to compose unique music of their own, and this is the reason for me to decide to use keyboards and mouses for playing different notes/different instruments in my project.

Here is the link to keyboard instrument patatap: https://patatap.com/

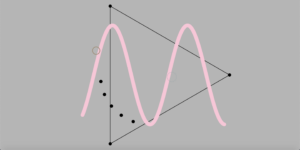
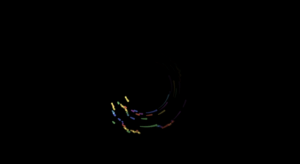
Another project that inspired me was the dot piano. I really like the visualization of this project. This dot piano was showing lines with different colors at different positions when the soundtrack that is being played has different notes. The reason for me finding this project interesting is that it provides a visualization of music, and this is the reason for me to decide to display random geometric shapes with different colors when different keys and mouse are pressed, so that the players are not only composing their special music, but also creating their own art work.

Here is the link to the dot piano: https://yotammann.info/dotpiano

The third project that I found inspiring was the jazz computer. This project allows the temple of playing jazz to  change based on the speed of scrolling down the screen. The one aspect that I really liked about this project was also the visualization, and that is also the reason for me to add random generated geometric shapes with different colors when pressing the keys.

Here is the link to the jazz computer: http://jazz.computer/ 

Categories
5. Classify This

Classify This

I used sound model as the input of my project. Based on the different sound that people make(whistle, talk, knock the laptop with finger nails), the stars will appear randomly inside of the canvas and light up with different sizes and different colors based on the different sound as the input.

Here is the link to my code: https://editor.p5js.org/ys4136/sketches/M1Grpw8p7

Here is the link to the sound model that I built:

https://teachablemachine.withgoogle.com/train/audio/1_L0eYw-h5oyC3WfCtXd_mg268FFfLPeA

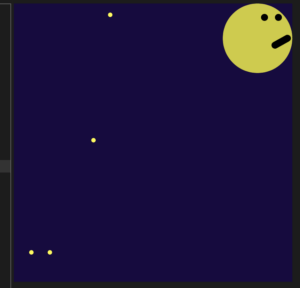
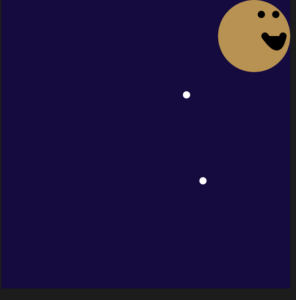
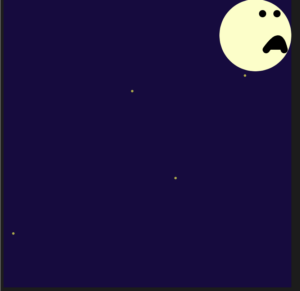
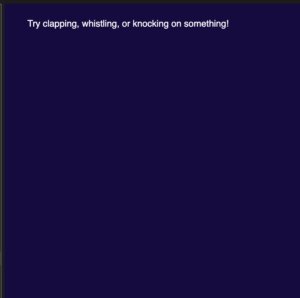
Based on the feedback that I got in class, I added in more stars and a moon with a face, so that people can understand the differences between the three sound classes that are used in my code better. I also added in a text message to tell people to clap, whistle, or knock on something, so that people would not be as confused about what to do when first seeing my code. 

Whistle:

Clap:

Knock:

Trying to give users instructions on how to interact with the program. 

Categories
Research Post

Research Blog 3

I think the development of face recognition techniques is interesting. The techniques involve three major sections: detection, recognition, and tracking, which allows the camera to recognize the existence of faces, distinguish the face between other faces, and keep track of the movement that is being made by that specific face. Although this technique is used in the security system for detecting the faces of the criminals, the cameras still contain some bugs, such as humans that have similar face features will be determined as the same person. According to Last Week Tonight, the police have used the face of a celebrity to detect the criminal successfully. 

One thing that brought my attention to was the incapability of detecting females who have darker skins. In Joy Buolamwini’s Ted Talk, she talked about how she found the problem of cameras being unable to recognize the faces of dark women’s faces as faces when she was in undergraduate school. Surprisingly, this problem is still not being solved after she was a graduate student in MIT, and this problem might not even be considered as an urgent problem that needs to be solved. During the talk, Buolamwini also talked about how the camera detected the appearance of a face after she put a white face mask on her face. I think that is ironic and discriminatory in some way, because the system has decided a face-like, light colored object looks more like an actual human face than a real human face. 

Categories
4. The Clock

Clock

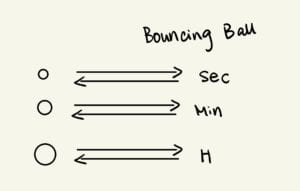
Initial sketch:

The clock that I generated was a clock that uses bouncing balls as its second, minute, and hour hand.  Here is the code to it:

https://editor.p5js.org/ys4136/sketches/Xm0MTYrKc


The smallest ball represents the second hand, and the medium size ball represents the minute hand, and the biggest ball represent the hour hand. I got my inspiration from pendulum clocks, so that when the ball finishing bouncing an entire loop, a unit time is past. The color of the ball will also change every time it bounces off from the screen, so that people will have a sense of how much time has past. 

For this project, I really like the use of the class function, because it saved a lot of my time and made the code looked more organized. While doing this project, I kept encountering a problem saying that color array is not a valid color representation, and this problem was solved by making a list of color and then use a if loop to make the color change based on the order in the list for each time it bounces. 


Categories
Research Post

Research Blog

Clock has been a time measuring machine that helps people to keep track of time. However as the time goes on, the physical appearance of the clock has also changed as well. The first clock was invented in Europe around the start of the 14th century, and it was working as the standard time keeping machine until the pendulum clock was invented in 1656. In the past, people have used sundials, water, and candles to keep track of time. Hourglasses were the first dependable, reusable, reasonably accurate and easily constructed time-measurement devices. The hourglasses were first being invented in the 15th century for the purpose of being capable of knowing the time while at sea, and hourglasses are still being used today. Then, the minute hand was being invented for the astronomers who needed an accurate clock for stargazing. In 1656, the pendulum clock made time keeping more accurate was invented. Then, the mechanical alarm clock was invented in 1787; however, at the time, the mechanical alarm clock was able to ring at 4am only. In 1878, standard time, which was the synchronization of clocks within a geographical area to a single time standard, was created. Finally in the start of the 20th century, more accurate clocks with battery powered clocks were invented. Other than clocks that have physical appearance, people even started to make clocks through computational programs. People have used different patterns and colors to represent different sections in time. 

Categories
Research Post

Research Post 2

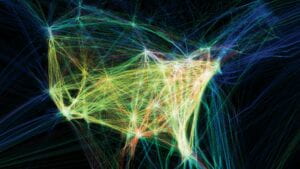
The information visualization that I chose was called “flight patterns” that was designed by Aaron Koblin. This visualization was also created by the computational programming language called Processing. “Flight patterns” was mainly to color and record the paths of air traffic over North America. The thing that I know about the algorithm of this project was about processing, because in the first research post the person that I did research about was Ben Fry, and he was one of the founders of this programming language. This language is an open source programming language and integrated development environment(IDE) built for the electronic arts and visual design committee. The aspects that I admire about this visualization are that this visualization is not only updating the air traffic path in real time but also shows the small turns in every flight as well. While watching the video that explains this visualization, I realized that this visualization not only has the paths of all flights in North America but also shows the numbers of planes that are flying at corresponding time. I thought this was admirable because I’m really curious how this program tracks the number of planes. For example, does every plane have a tracker that is being used to track the plane that is flying so that when the plane is in the air the program will automatically add one to the number of planes flying or is it the satellite tracking the number of planes in air then sending the data back to the program? Also, before looking at the video of “flight patterns” I thought this visualization program will just show the direction and the starting point and the ending point of each flight; however, I now realized that every small movement such as turns will all be captured and shown in this program. 

I think the creator’s artistic sensibilities are manifested in the way of turning the plain data being gathered into visual representations. Sometimes visual images will help people to understand concepts better and faster than reading a relevant textbook. In the case of this program, I think the visual representation of the paths of flights can easily help people to understand where part of North America is the place where most people travel a lot, and will have a better understanding of a general pattern for the flight paths. 

Here is a video of “flight patterns” program: http://www.aaronkoblin.com/project/flight-patterns/

Categories
3. Generative Thing

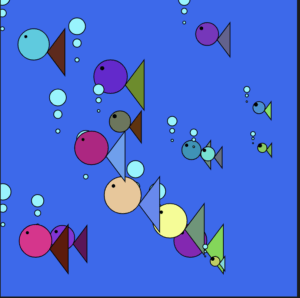
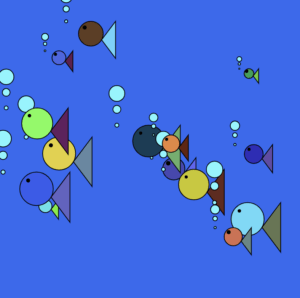
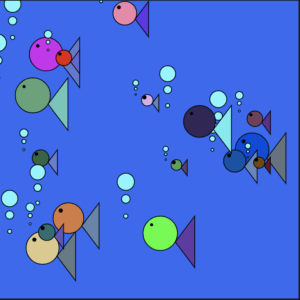
Fish Generator

code: https://editor.p5js.org/ys4136/sketches/NOw4a6WMq

This is the fish generator that I created. A fish will be generated each time people press the mouse. Throughout this project, I learned that the order among commands is very important, and subtle differences in the code will make the entire code does things that are completely different. 

This project also helped me to get to know loop functions and functions that run once only better. 

Categories
Research Post

Research Post – Ben Fry

The Eyeo talk that I watched was about the new computational language called Processing, and Ben Fry and Cassey Reas were the developers of this software. Ben Fry is an American expert in data visualization. In his Eyeo talk about Processing, I learned that Processing is an open source programming language and integrated development environment(IDE) built for the electronic arts and visual design committee with the purpose of teaching the basics of computer  programming in a visual context. I think this language is very similar to p5js that we are using in class, and indeed in the talk, Fry had said that Processing is a combination of Java and C++, but it is more forgiving than C++; meanwhile, Processing also contains many libraries, which provides an easier experience for its users when coding. Therefore, Processing is being used widely among schools and universities all over the world. In his demonstration, the processing software allowed him to write code that does the similar thing that p5js can do as well, such as making an ellipse and then making it track the path that the mouse was passing through. This language is also capable of turning the data being gathered from real life into visual representations. In the demonstration, Fry presented the code that can track the flight of planes than turned the data being gathered into a graph for examples.

Fry had also presented that by using Processing, people can even print things out on different materials directly from codes. In one of the examples, the knitting machines were printing the clothes with the specified pattern directly from codes.When illustrating the animation part that Processing can do, Fry also showed an example of flying birds and the “monster” generator, and I thought these two were sort of similar to the generator project that we are having in class now.

I especially liked the bird one better, because it looked very real, and I also really want to know how they made the bird look like it was flying while still having the right perspective such as having a bigger size when close to the screen, and a smaller size when further away from the screen. 

Categories
2. Lost and Found

Lost and Found

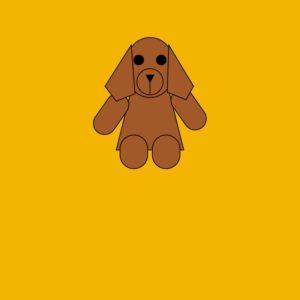
My name is Sarah Sun, and my partner is Yara. She lost a brown stuffed animal dog that was sitting and looked like a bear. I thought this project allowed me to discover more functions and command that can be used, and that was really interesting.

Here is the code to my project: 

https://editor.p5js.org/ys4136/sketches/PKu4RTg1u