Reflection:
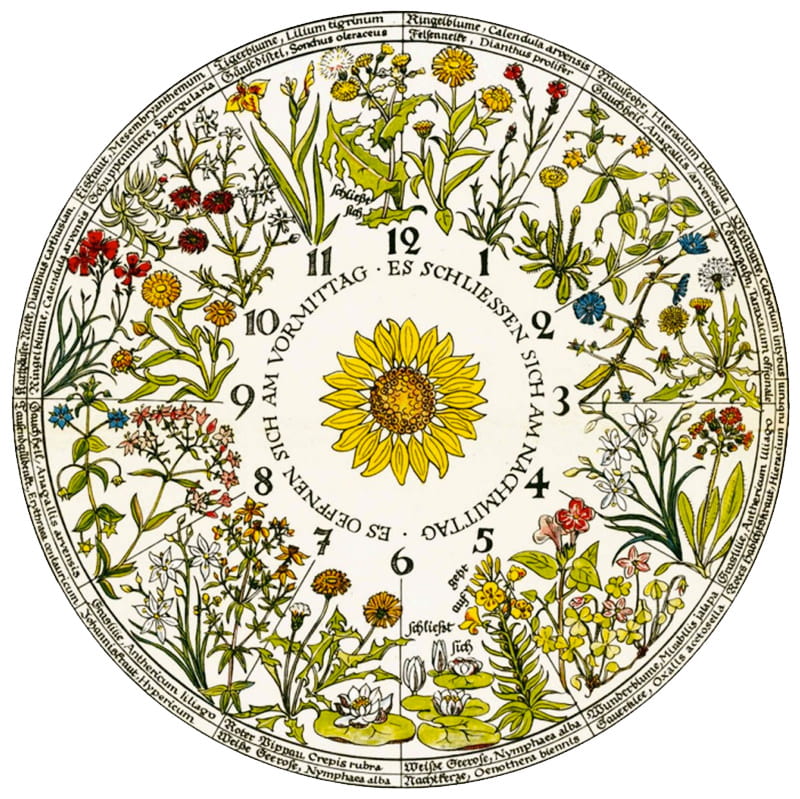
When researching about the many different ways time has been represented visually throughout history, Linnaeus’s flower clock stood out to me the most. Carl Linnaeus was a Swedish botanist who observed that several plants open or close their flowers at particular times of the day and can thus accurately indicate the time. His research and his data are specific to his geographical location (Uppsala) and weather conditions that were present; therefore, these same flowers will not open and close at the same times in different countries and seasons.
 Using a graph of his research results found online, I picked out 6 flowers and created a class for each flower in order to visually represent it.
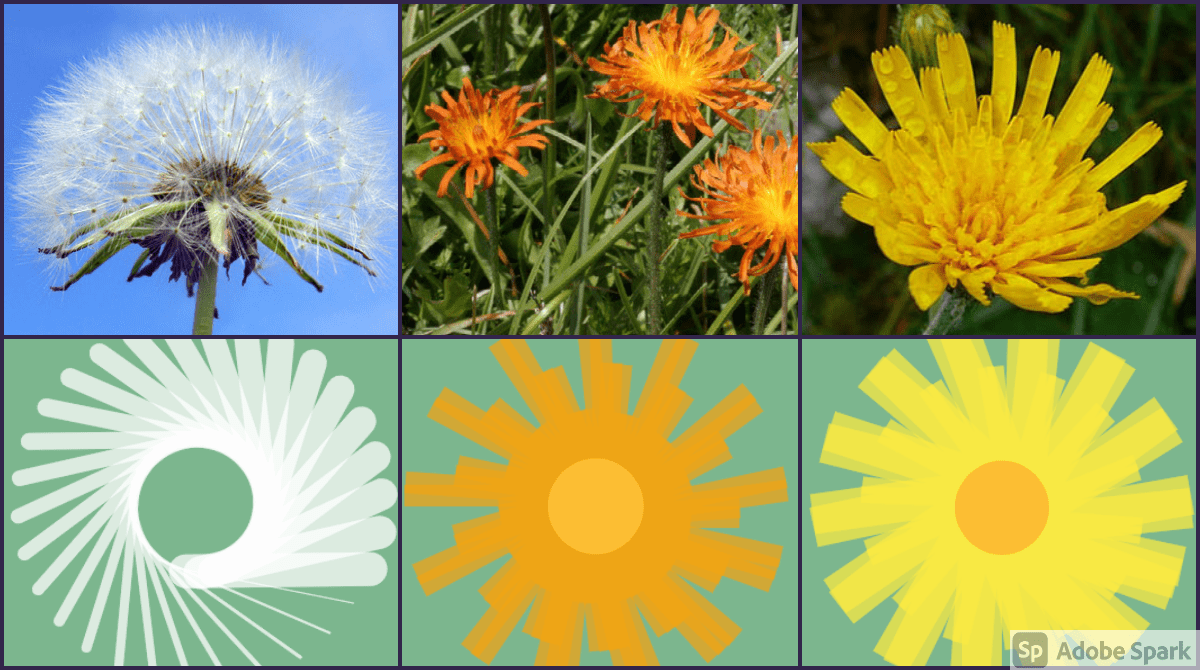
- Dandelion (Taraxacum officinale)
- Opens: 5 A.M.| Closes: 9 A.M.
- Hawk’s Beard (Crepis alpina L.)
- Opens: 6 A.M.| Closes: 11 A.M.
- Spotted cat’s ear (Hypochaeris maculata L.)
- Opens: 6 A.M | Closes: 4 P.M.
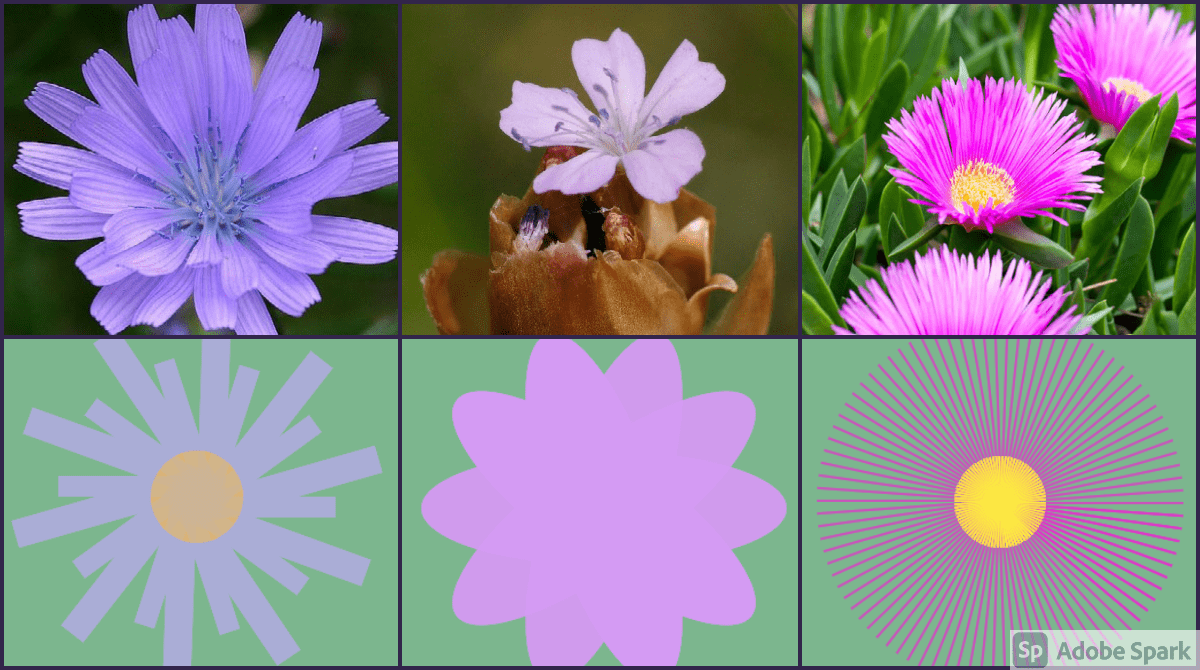
- Blue sow-thistle (Cicerbita alpina (L.) Wallr.)
- Opens 7 A.M. | Closes: 12 P.M.
- Proliferous Pink (Petrorhagia prolifera (L.) Ball & Heywood)
- Opens: 8 A.M. | Closes: 1 P.M.
- Ice-Plant (Cryophytum nodiflorum (L.) L. Bol.)
- Opens: 10 A.M. | Closes: 3 P.M.


After coding the separate flower classes that produced the images above, I combined them in a sketch and chose their positions for aesthetic reasons and their order in respect to when the flowers open.
 I then further developed the classes and created functions in which the flowers “open” and “close”. I achieved this by respectively increasing and decreasing their sizes. When the time for each flower to open comes, the flower’s size increases, enveloping the screen. When the flower closes, its size decreases until it completely closes. The pattern then repeats every 24 hours and the actual computer’s time can be seen on the bottom left on the screen.
Code: https://editor.p5js.org/ym1820/sketches/qUcpZfdCY
Screenshot of the sketch at 11:28 A.M.
Screenshot of the sketch at 08:22 A.M.
Screenshot of the sketch at 02:59 P.M.