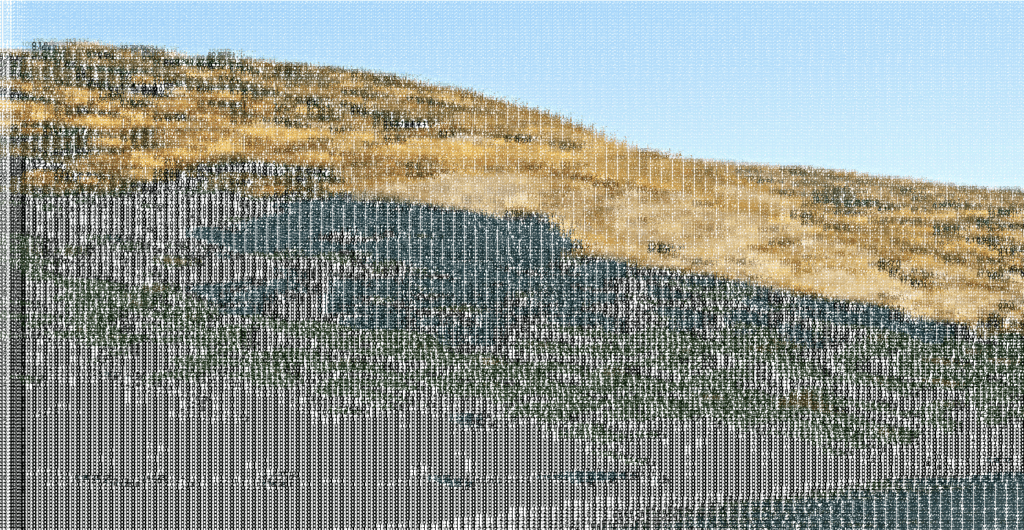
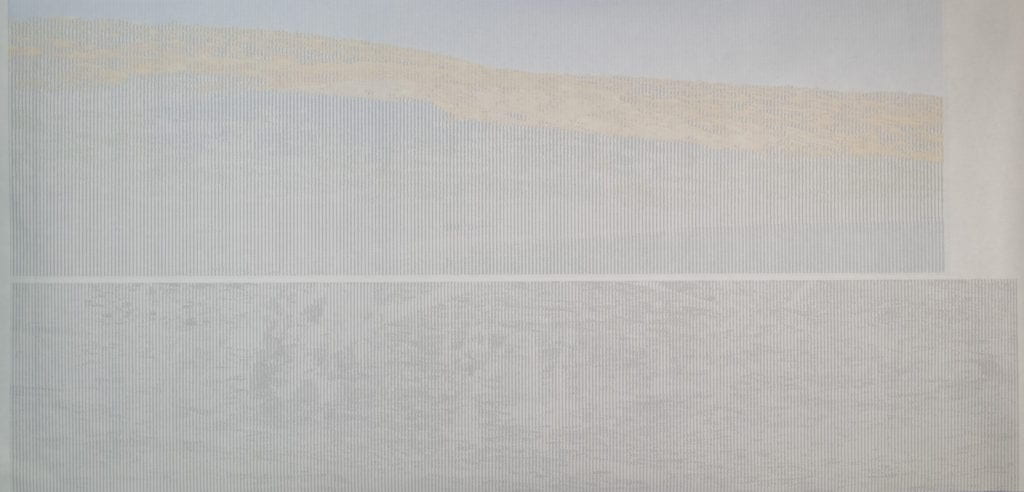
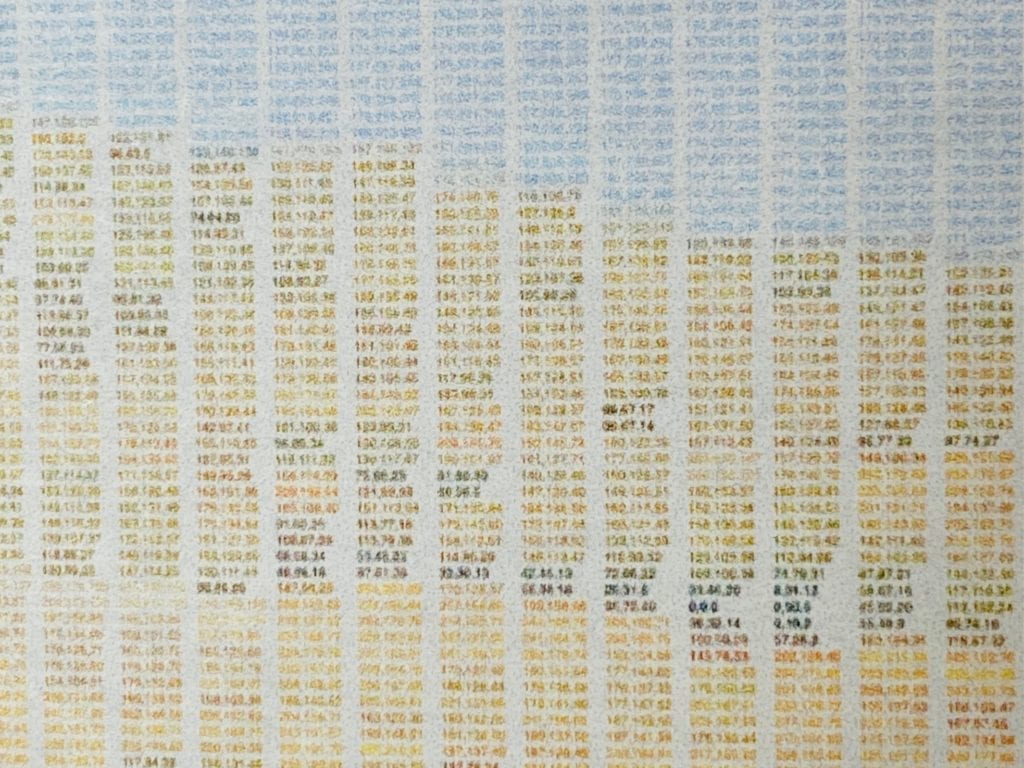
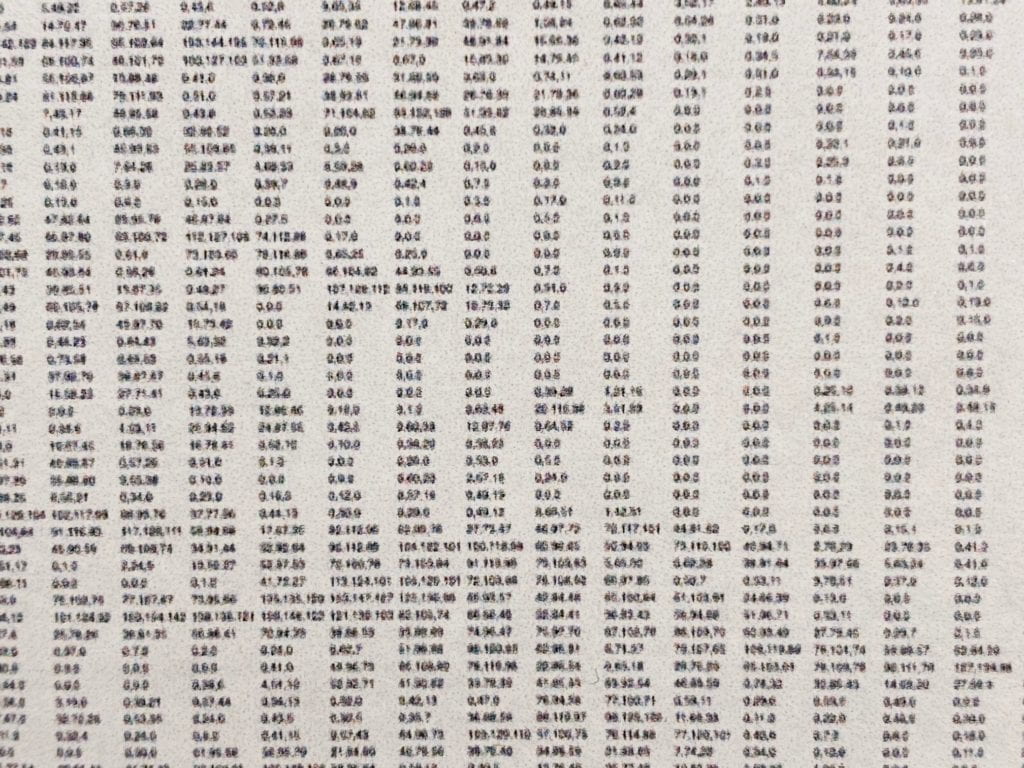
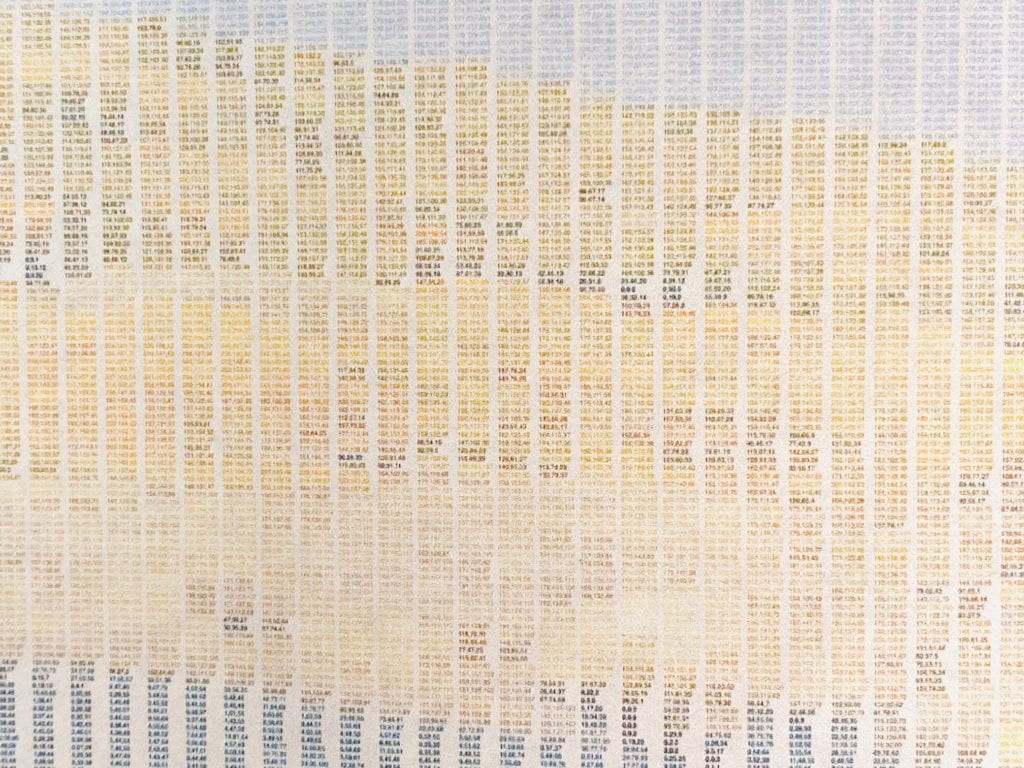
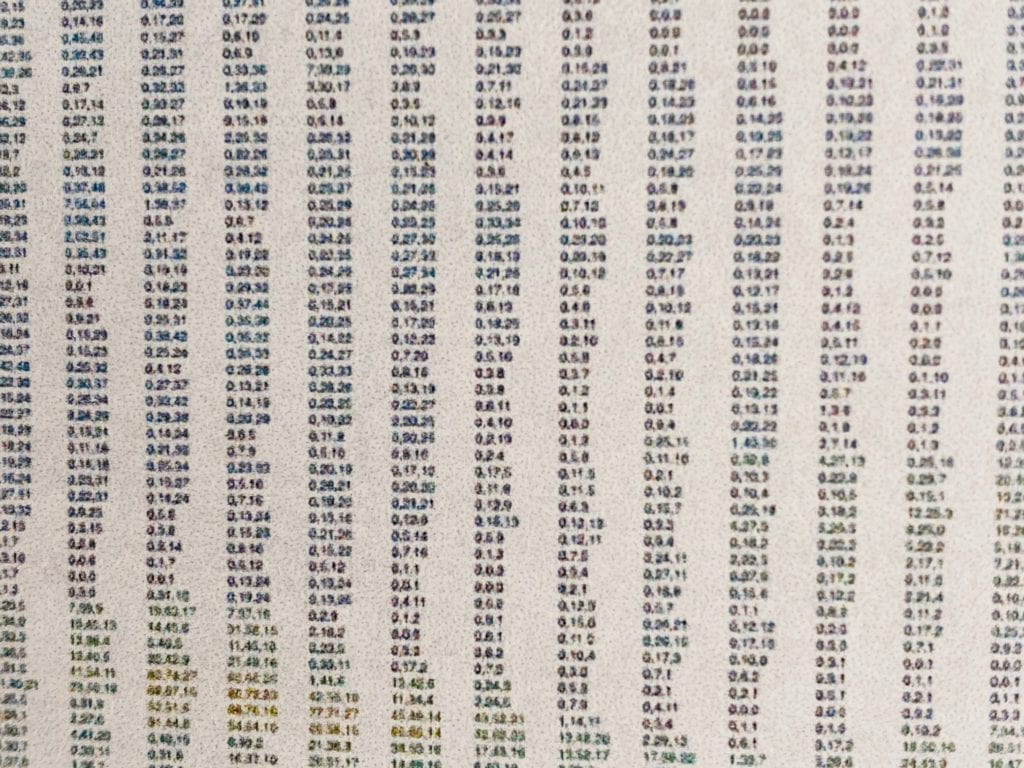
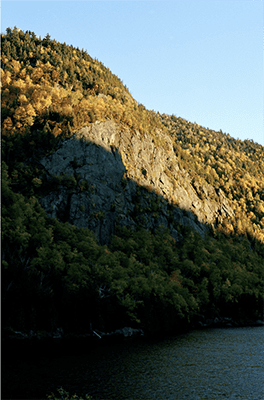
For this piece, I wanted to continue down the path of breaking down an image to the pixel level. I have been thinking about how society is inundated with imagery and wanted to find new beauty in scenes that I’ve seen over and over again.
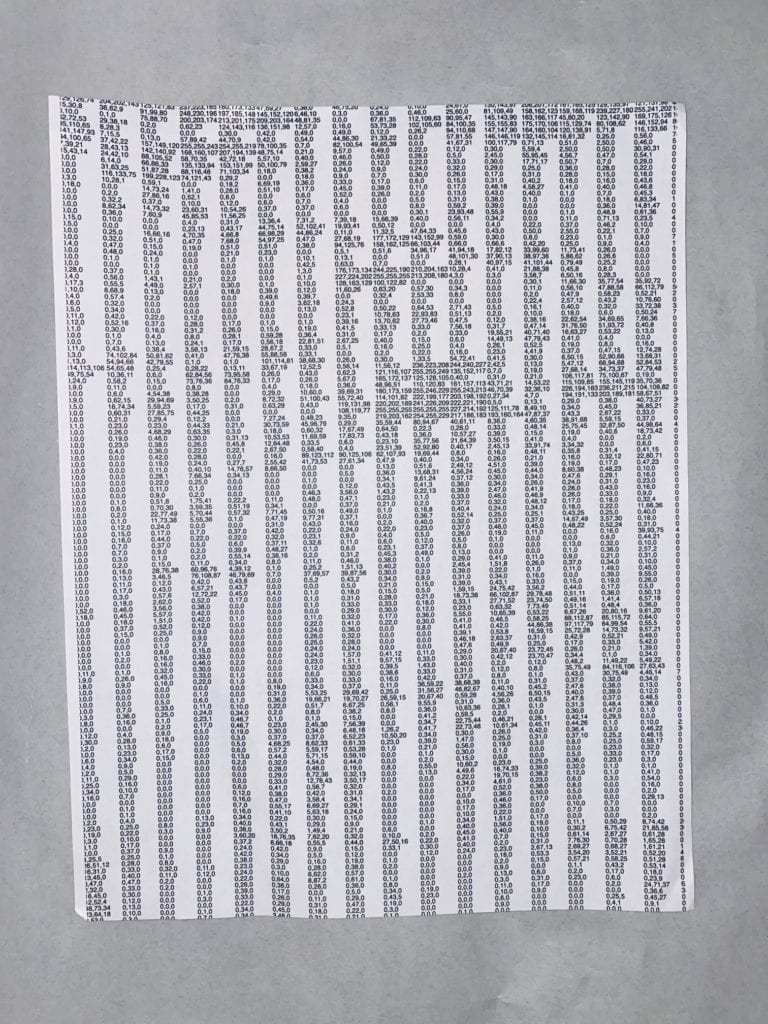
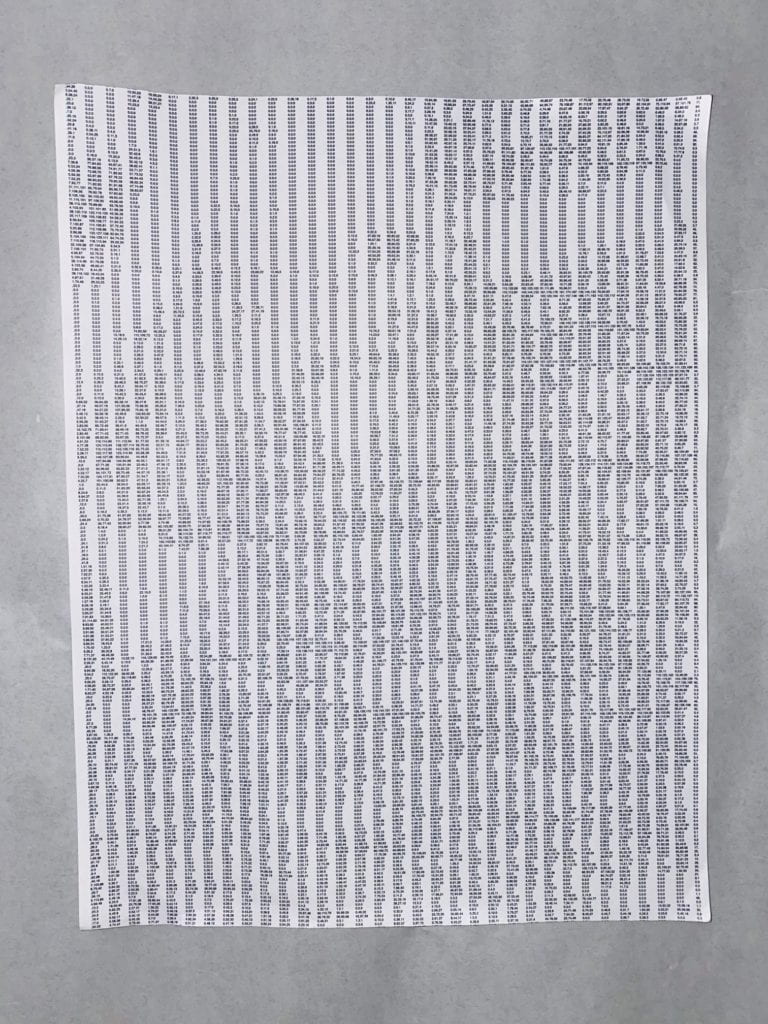
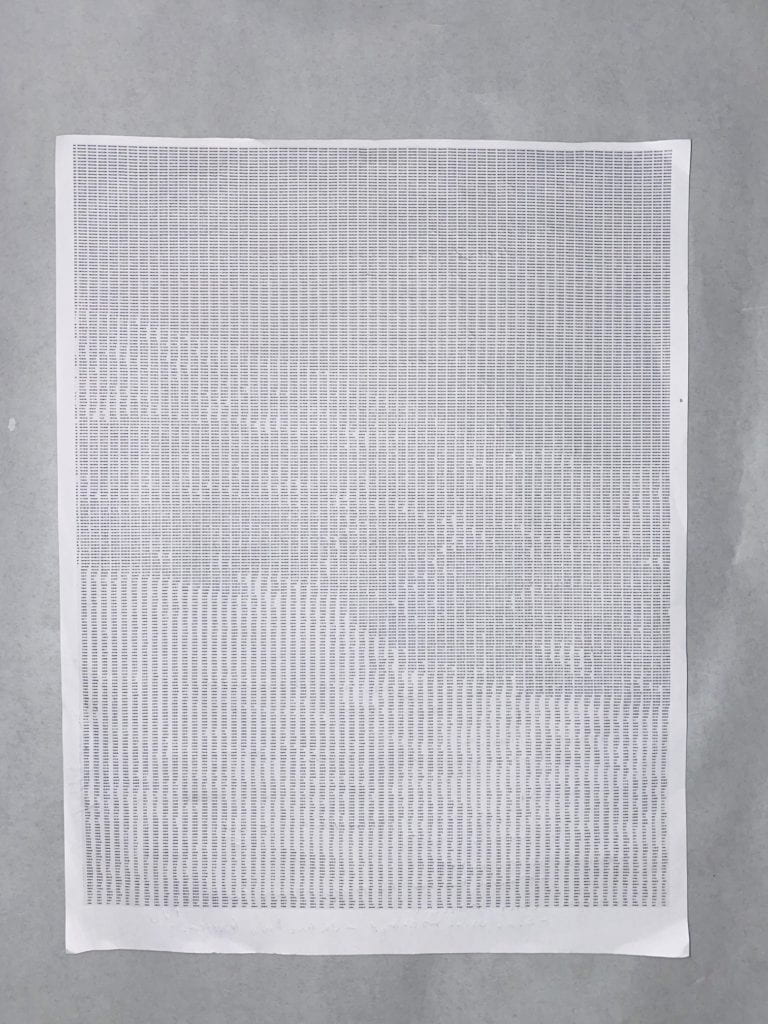
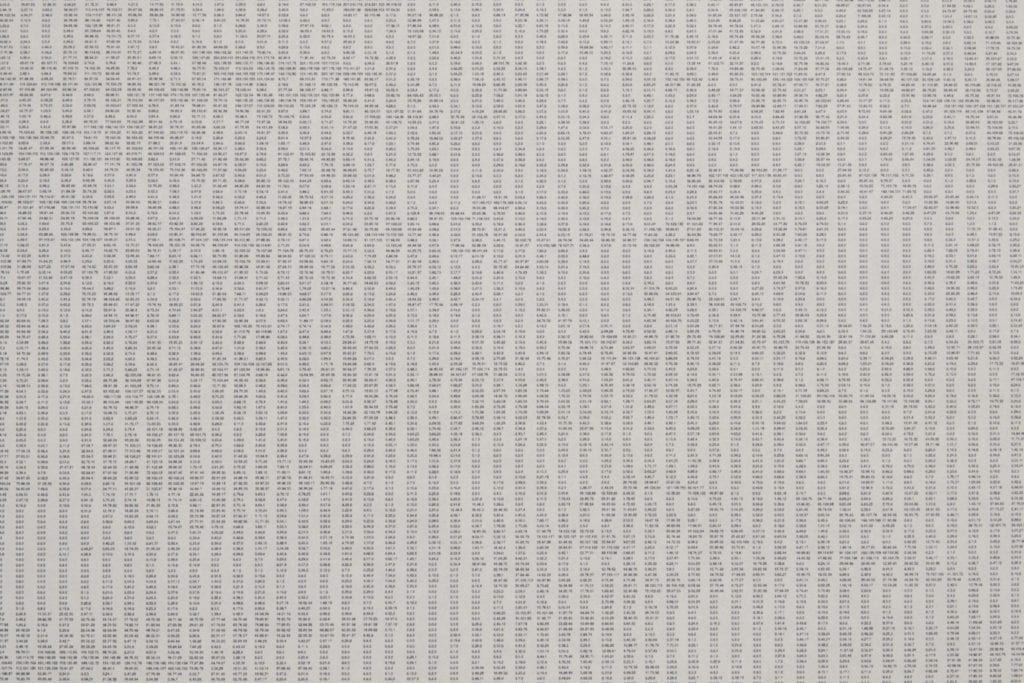
I import an image into the P5JS script that reads each pixel and prints its individual RGB color value, for example, 60,96, 76. The values will then be printed from left to right, top to bottom. The first iteration was in black and white and produced beautiful randomized patterns of data.
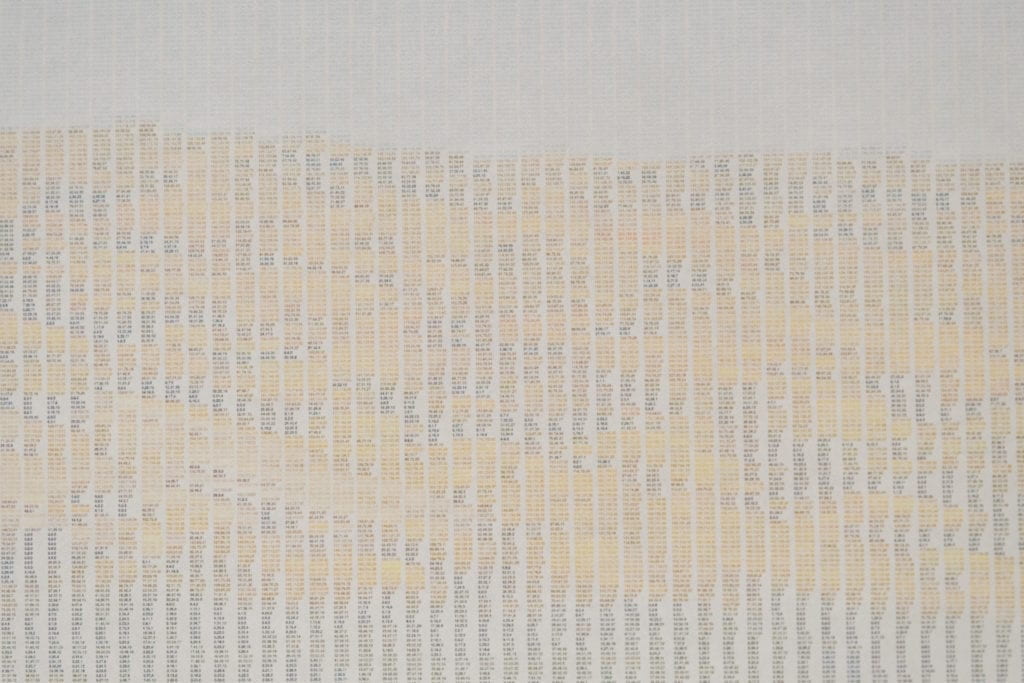
To take the piece a step further, I wanted to add color to each pixel by applying the referenced RGB value to the written outnumber.
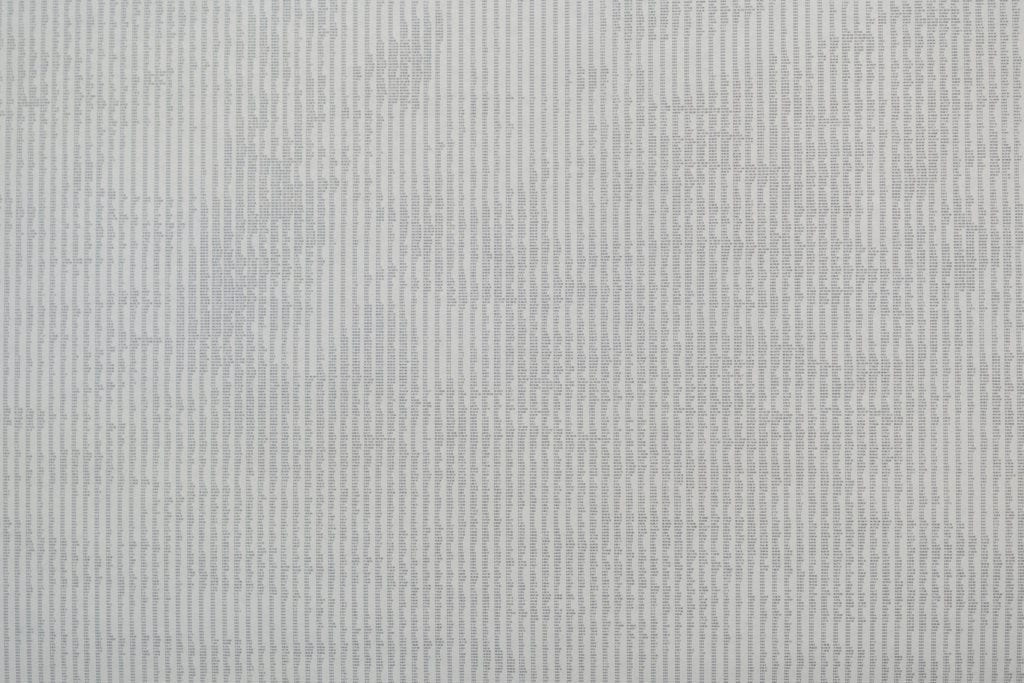
Finally, I wanted to take the piece to print. Making the text small enough to be invisible at normal viewing distances but legible at close up reminded me of grain in an image.
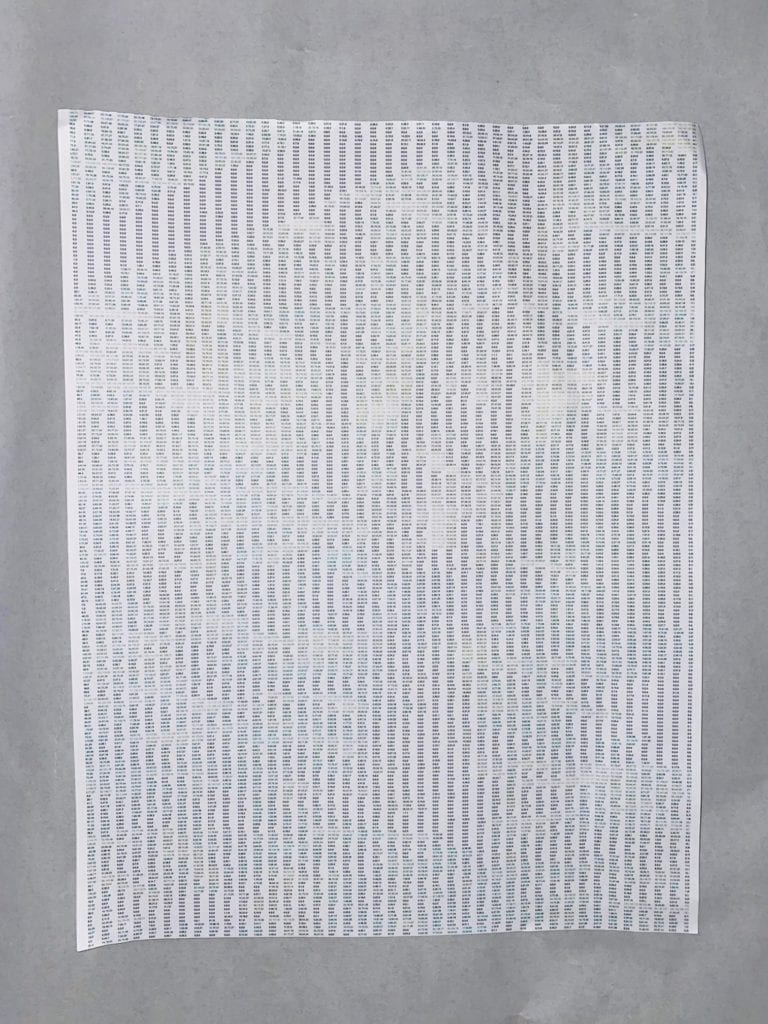 Introducing color into the print.
After I sent the script to print at full size, which shook out to be roughly 10 x 45.
Below are a series of tighter views of the data.
Below are the imported images.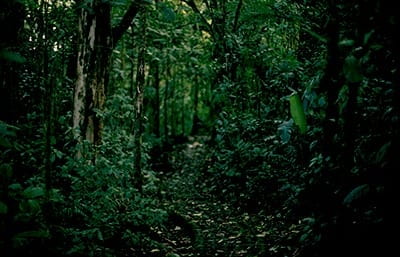
While experimenting with the text size, I noticed that if I did not adjust the canvas size, the pixel values’ blending would make an abstract image. To wrap this project up, I wanted to make a digital version that the viewer could make their own piece and save it. To do this, I added a slider that adjusts the text size and a save button that saves the current canvas and exports it.
To see this piece click here.

