RGB Visualization

For this piece, I wanted to continue down the path of breaking down an image to the pixel level. I have been thinking about how society is inundated with imagery and wanted to find new beauty in scenes that I’ve seen over and over again. 

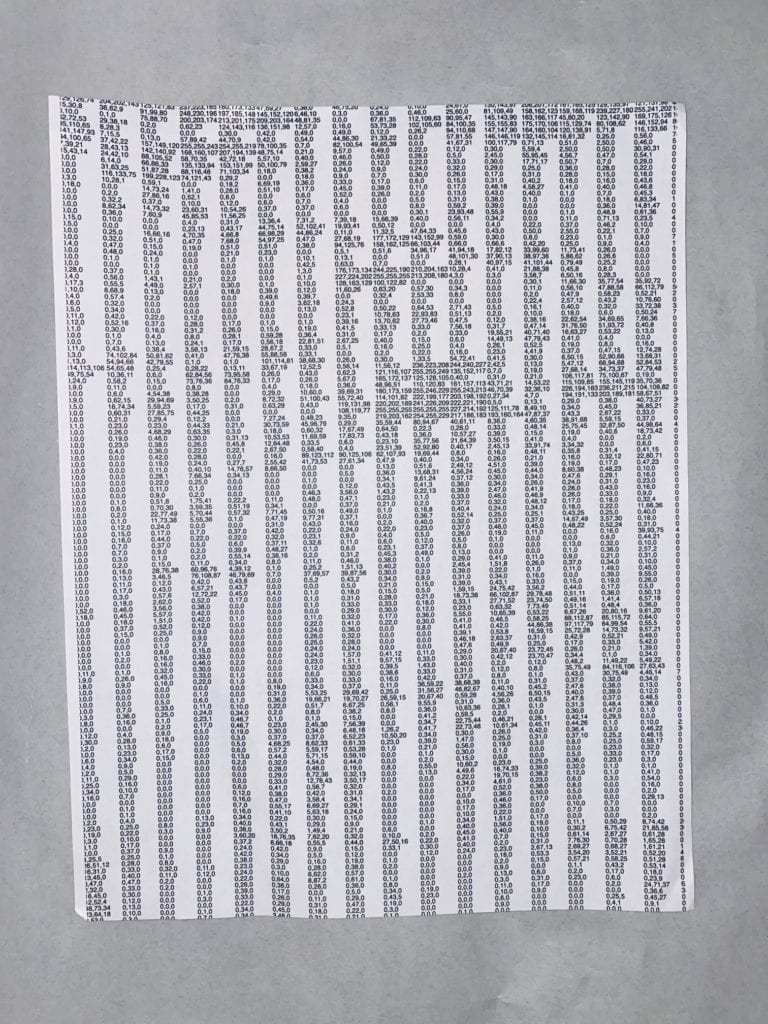
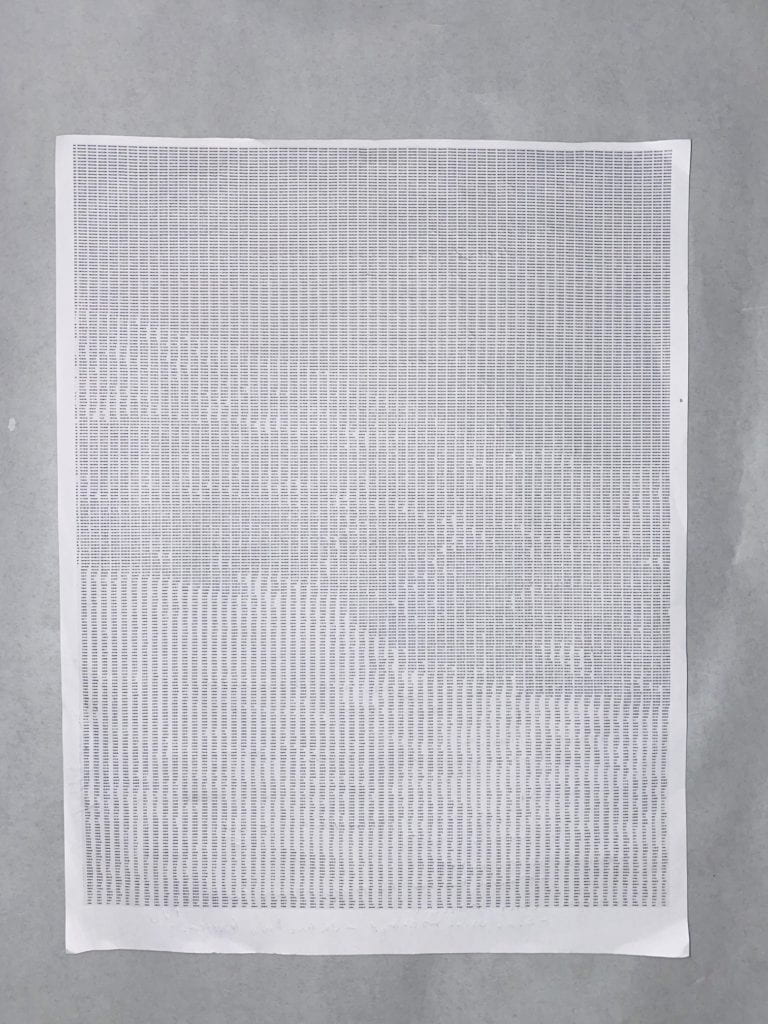
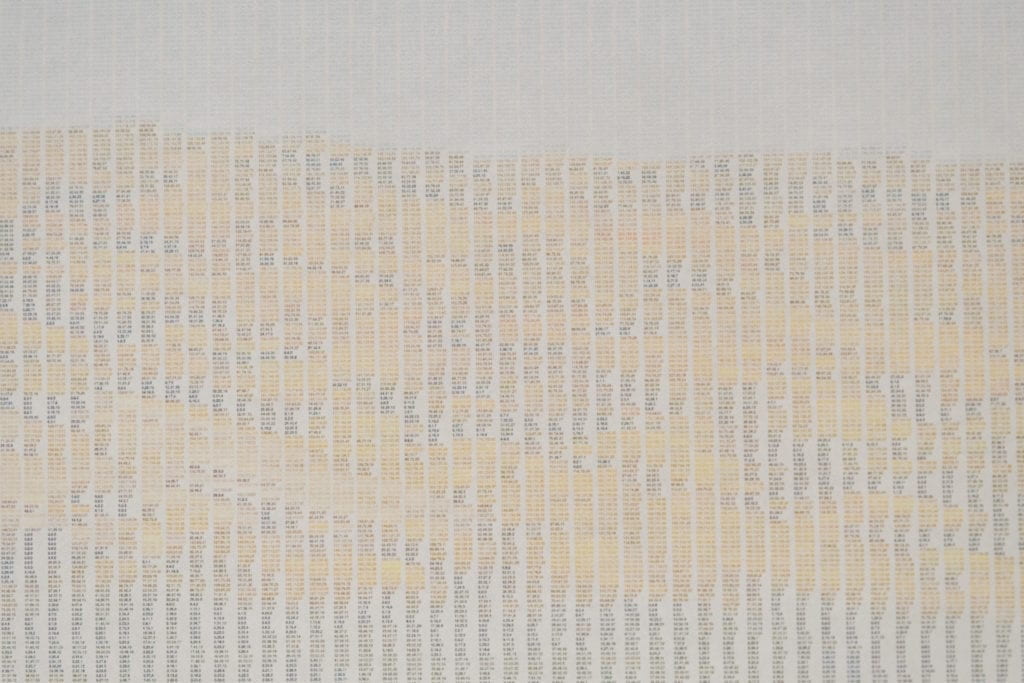
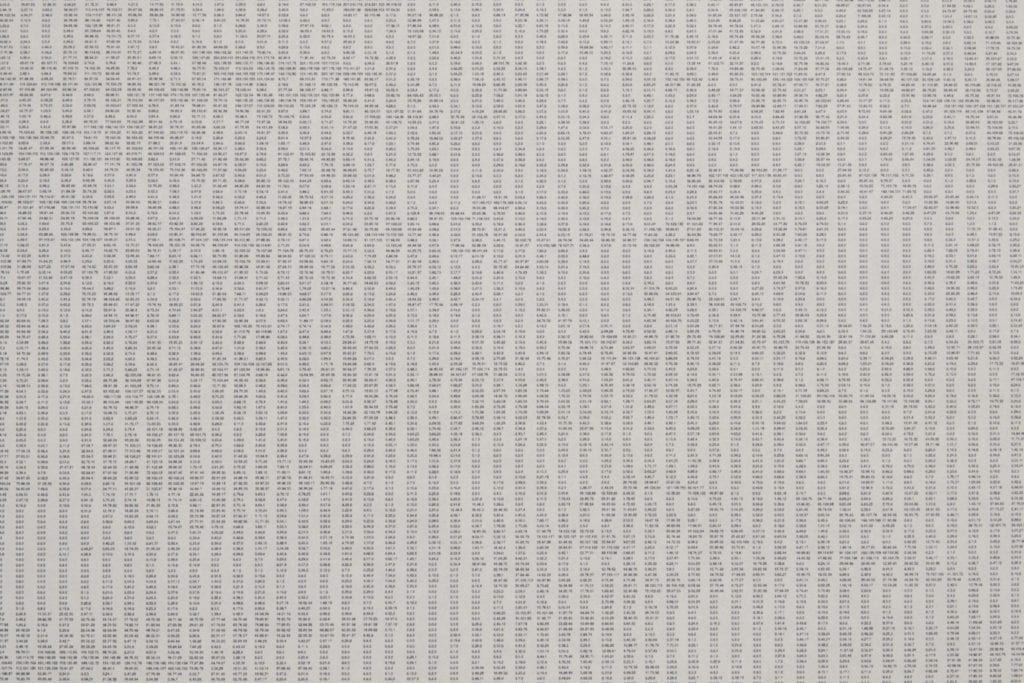
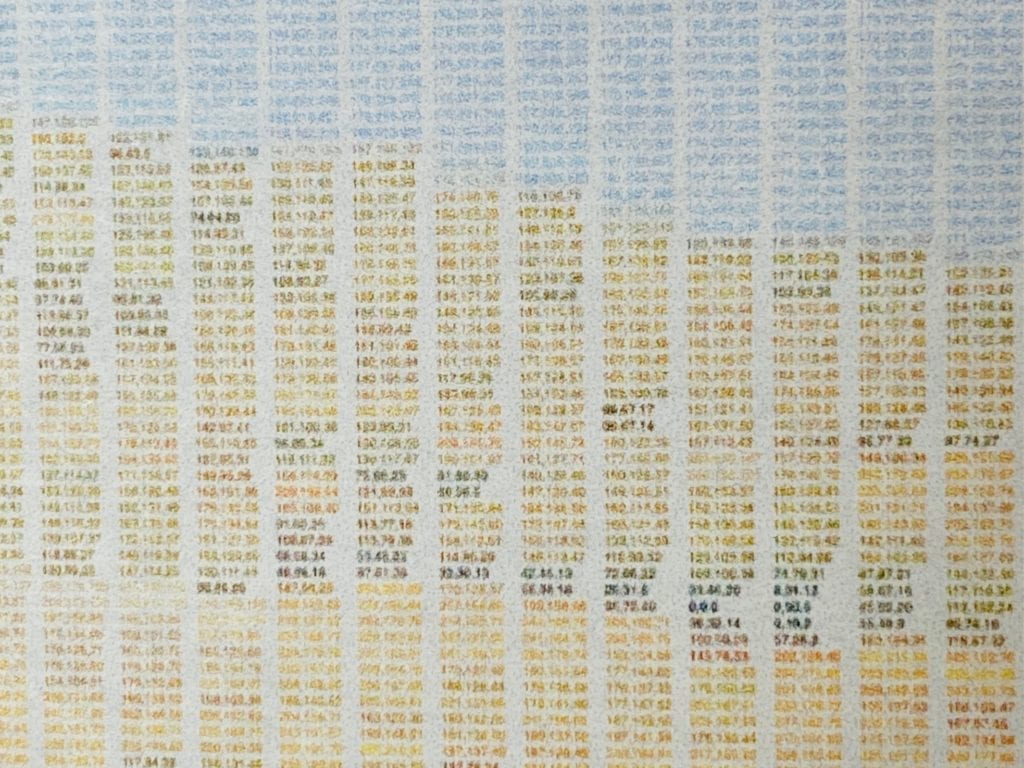
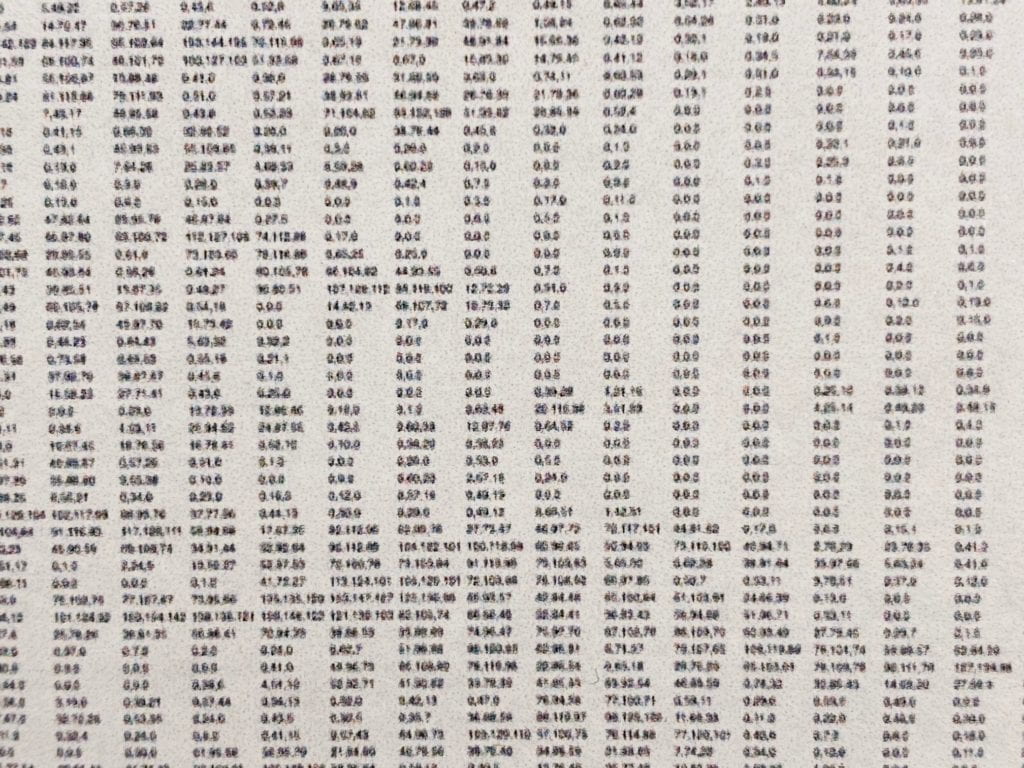
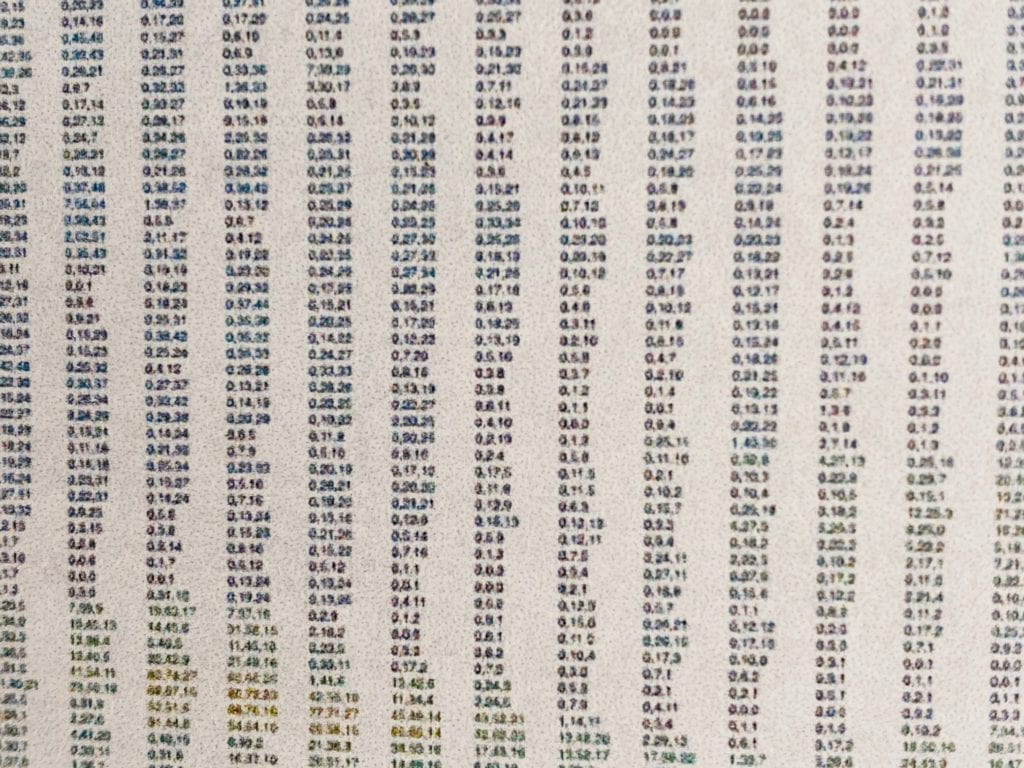
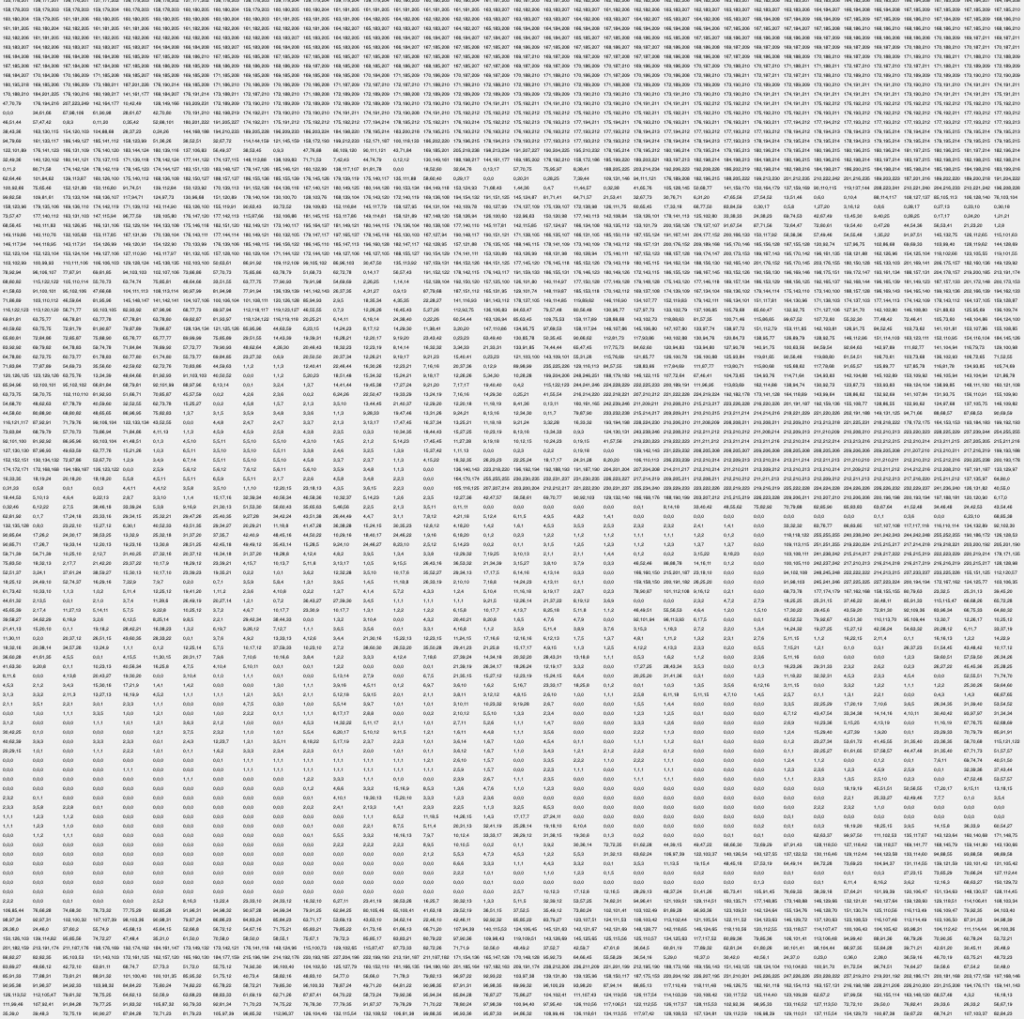
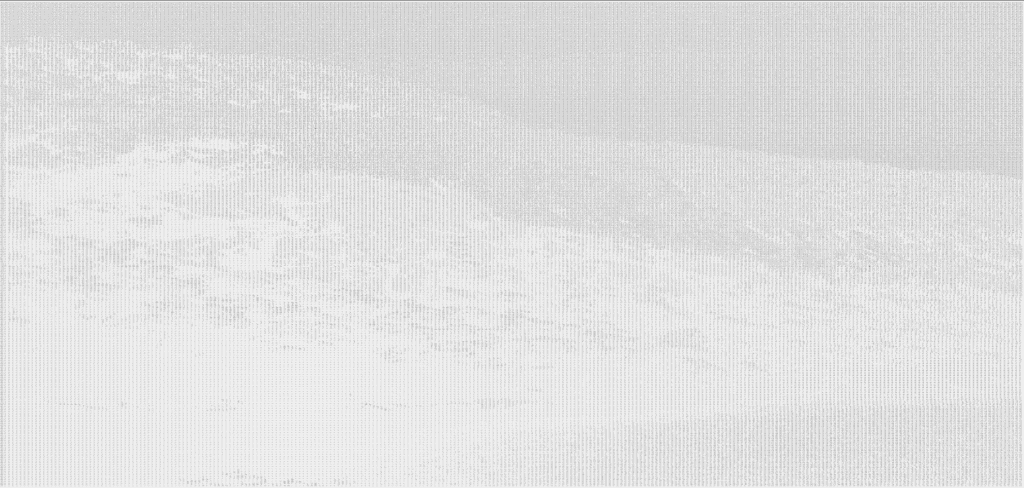
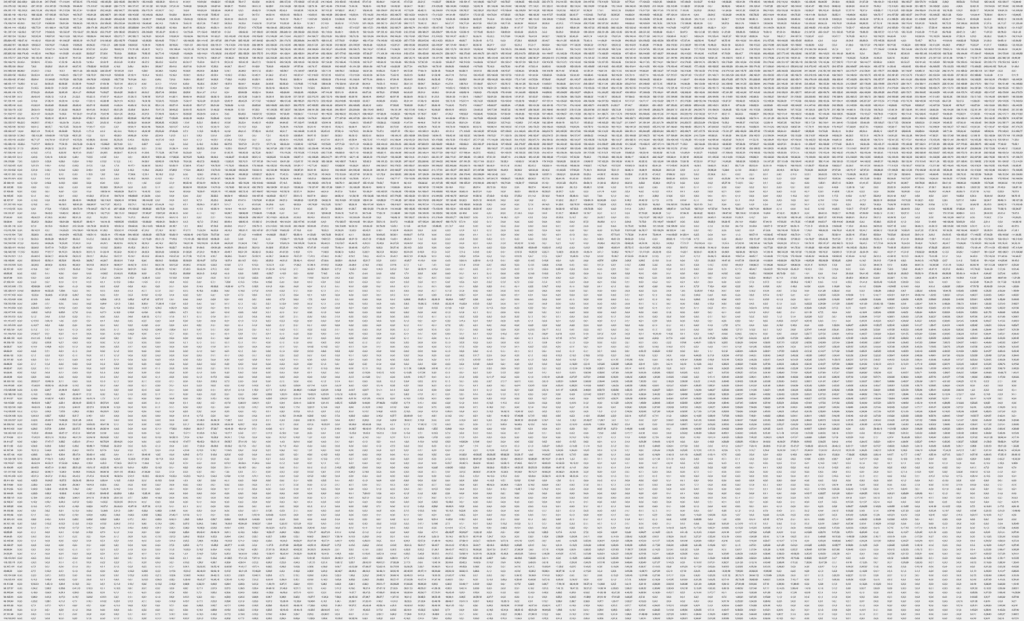
I import an image into the P5JS script that reads each pixel and prints its individual RGB color value, for example, 60,96, 76. The values will then be printed from left to right, top to bottom. The first iteration was in black and white and produced beautiful randomized patterns of data. 

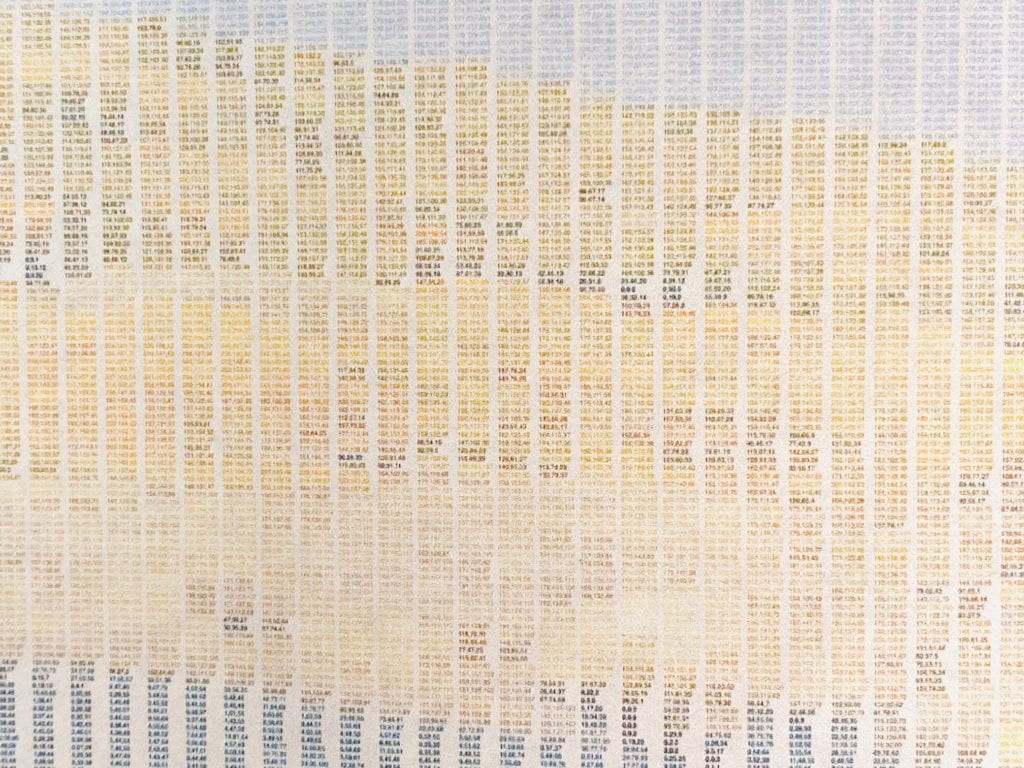
To take the piece a step further, I wanted to add color to each pixel by applying the referenced RGB value to the written outnumber. 

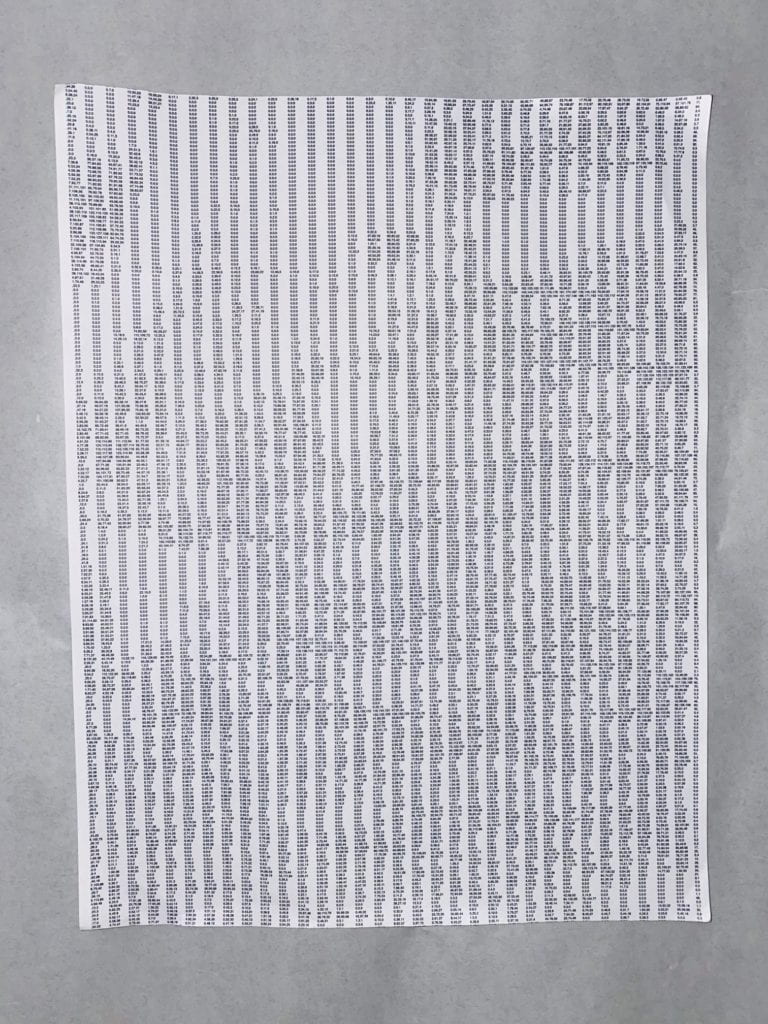
Finally, I wanted to take the piece to print. Making the text small enough to be invisible at normal viewing distances but legible at close up reminded me of grain in an image. 

Pixels broken into RGB values.Introducing color into the print. 

Font size 21 – Too big.

Font size 10 – Still too big.

Font size 8 – Perfect. 

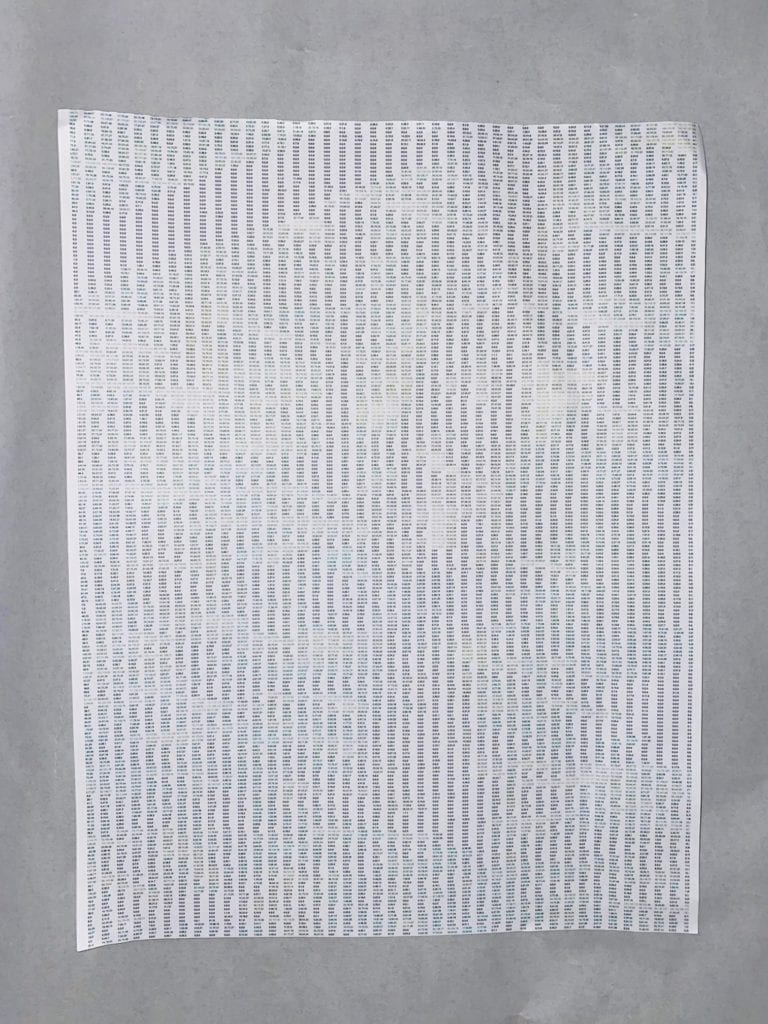
After I sent the script to print at full size, which shook out to be roughly 10 x 45.

full size pixel print

Below are a series of tighter views of the data. 

closeup view of RGB pixel sketch

closeup view of RGB pixel sketch

closeup view of RGB pixel sketch

closeup view of RGB pixel sketch

closeup view of RGB pixel sketch


closeup view of RGB pixel sketch

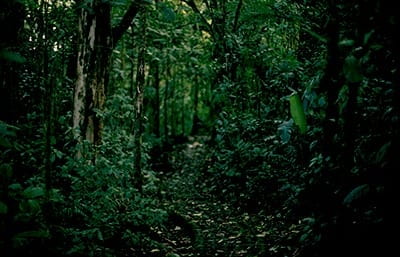
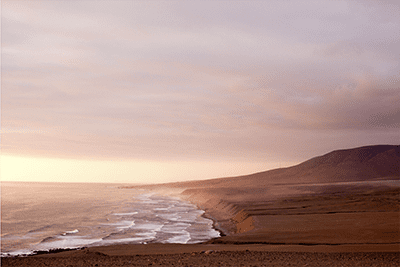
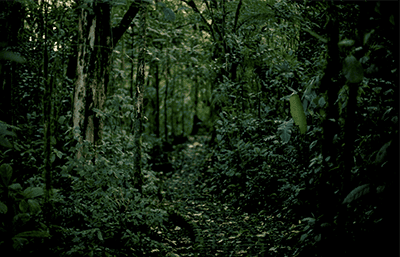
Below are the imported images.Image of forest in Costa Rica

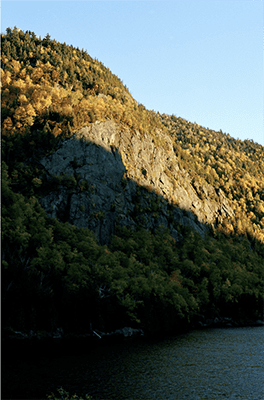
Image of the Adirondack park

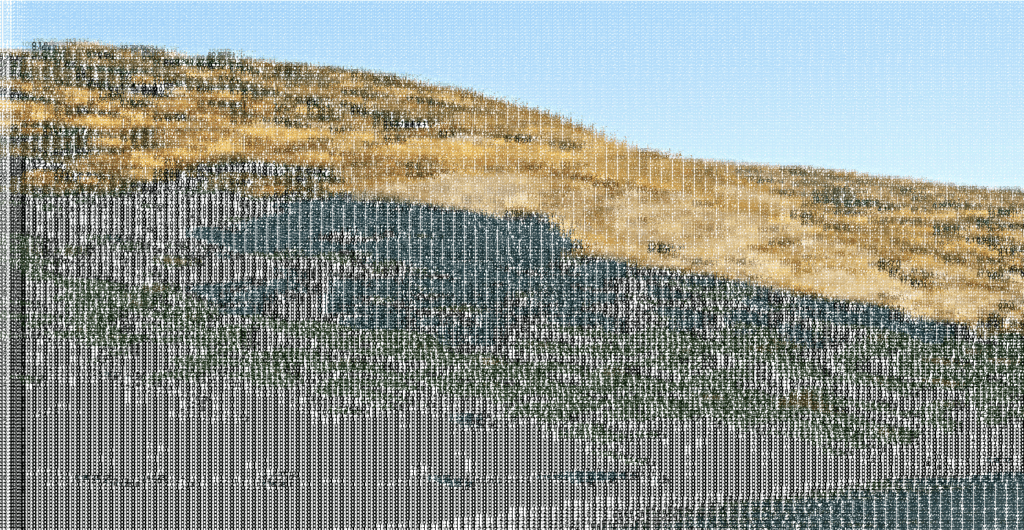
While experimenting with the text size, I noticed that if I did not adjust the canvas size, the pixel values’ blending would make an abstract image. To wrap this project up, I wanted to make a digital version that the viewer could make their own piece and save it. To do this, I added a slider that adjusts the text size and a save button that saves the current canvas and exports it. 

To see this piece click here. 

Images and Pixels

The prompt for this assignment was to manipulate images or video on the pixel level. For a while now, I have been thinking about how we are inundated with images as a society. It would be difficult to go an entire day without seeing one. Does this make images less impactful? I think, to a certain extent, yes. Take Ansel Adams work in Yosemite as an example his black and white photographs shocked and awed people so much that they helped develop the National Park Service. Now we get a photo of Yosemite on our computer when we update operating systems. Does that image have the same impact as Ansel Adams? It’s technically perfect and aesthetically pleasing, but we’ve seen so many images of that same location that I think they’ve lost something. Don’t get me wrong I still believe that an image is one of the best storytelling devices, but sometimes it’s fun to experiment. 

I wanted to take an image and break it down to its invidious R, G, B values per pixel for this project. With the hopes that we can take a fresh look at often photographed locations. To me, each one of these written values is a grain that we use to look at with a loop in the darkroom. 

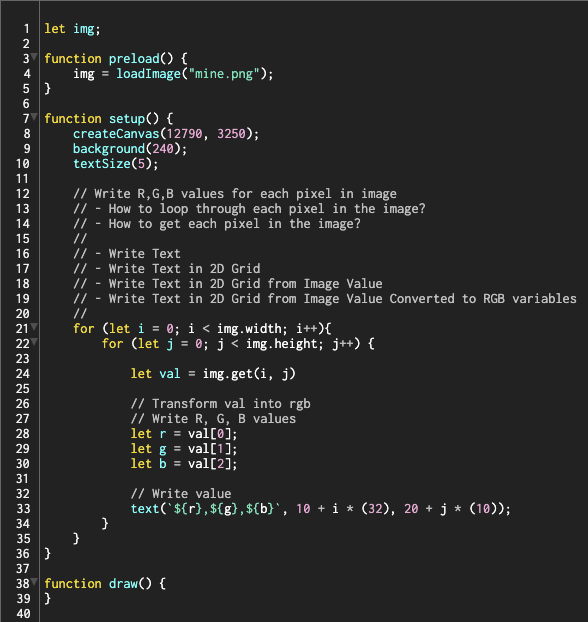
Here is the code: 

screenshot of a p5js script.

The Results: 

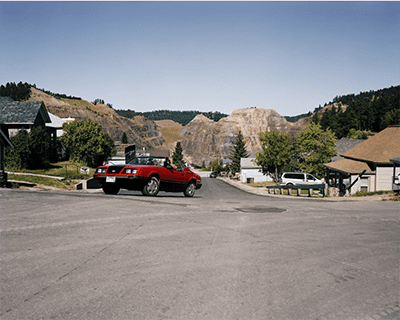
Image of a red car driving up a hill.

Entire Piece:  https://editor.p5js.org/awinslow/present/dLGWTX_QuRGB values written in a grid.

Zoomed in View: 
RGB values written in a grid.


____________________________________________

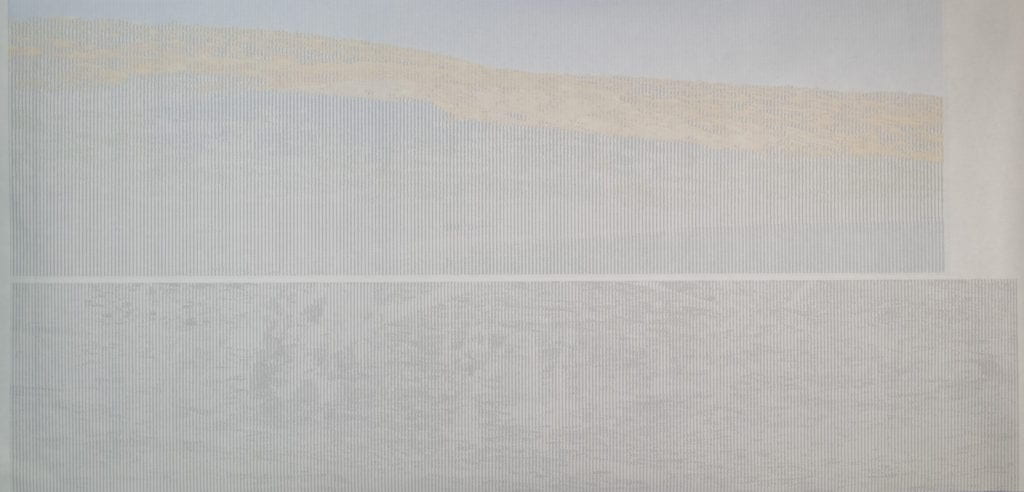
Image of the Adacama Dessert

Entire Piece:  https://editor.p5js.org/awinslow/present/dLGWTX_Qu

RGB values written in a grid.

____________________________________________


Image of the Adirondack Park

Entire Piece:  https://editor.p5js.org/awinslow/present/dLGWTX_Qu

RGB values written in a grid.

Zoomed In View: 

RGB values written in a grid.

____________________________________________

Entire Piece: https://editor.p5js.org/awinslow/present/QXxllhi2D

Image of the rain forest

RGB values written in a grid.

I was pleasantly surprised at the patterns and movement in the numbers in each of the final pieces. I will be feeding more images into this program. 


Project 2 – Lab 7

Project 2: 

I have been interested in both environmental issues and the destruction of my own art for a long time. Over the years, I have found that by combining the two, I can explore visually presenting scientific data on the climate crisis. This exact project has been rolling around in my head for years and I’m really excited to start working on it. 

For this project, I plan on producing a painting or drawing of a threatened/endangered environment. The completed piece will be placed on an easel. Above the easel will be a pulley system with a hose attached in the middle. The hose will run down the back of the painting to a pump, where the second intake line will be in a container of black paint. 

The pump and pulley system will be run off an Arduino Nano 33 IoT. Over the course of the performance, the pump will turn on and dispense paint randomly over the painting, destroying it. To calculate the destruction I will be basing the operation on the predicted extinction of the painted environment. 
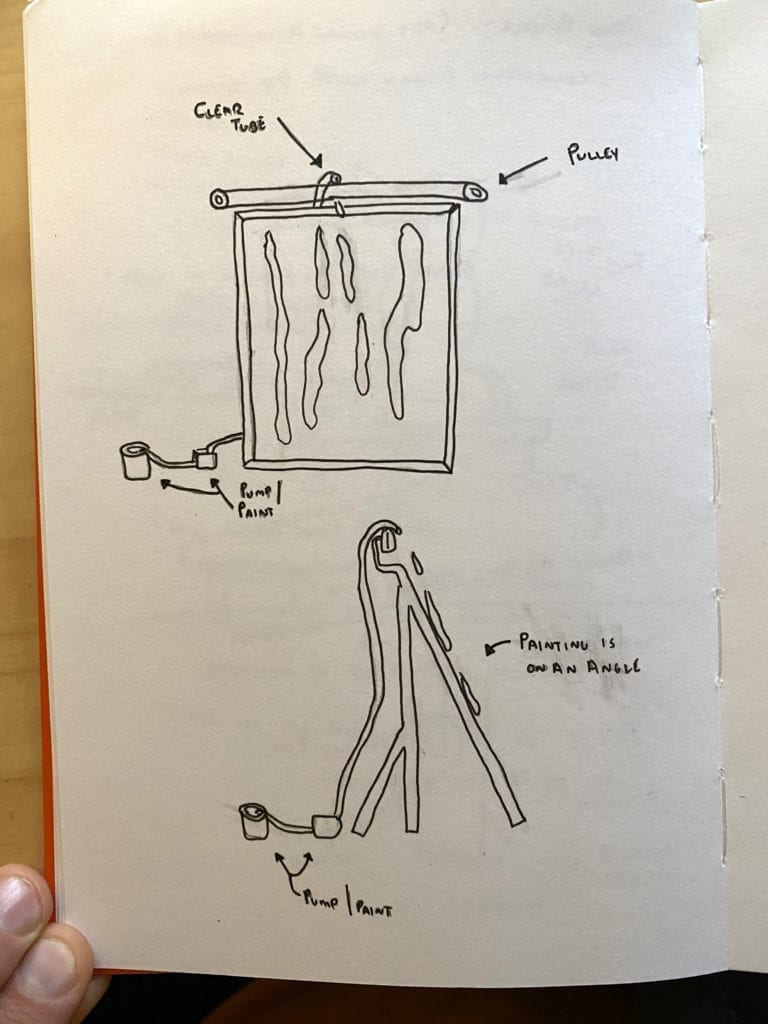
Sketch of a easel and painting getting sprayed with ink.

A completed rough sketch of the layout. 
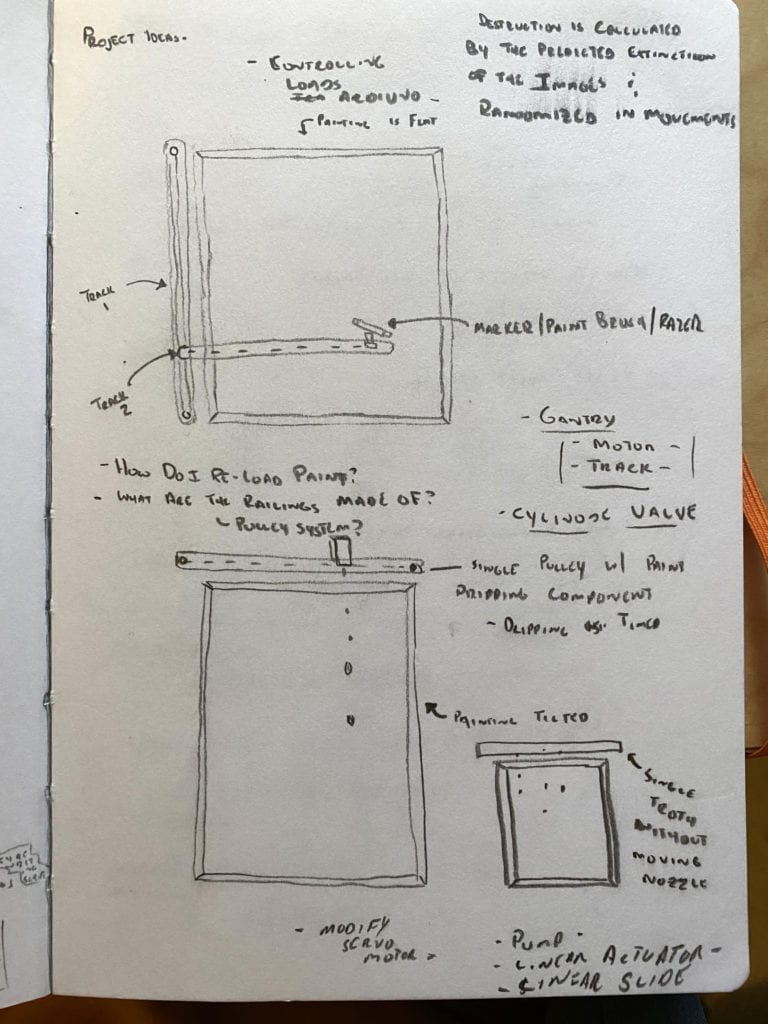
Early prototype drawings: To expand this project I might add a vertical arm that can control other tools, including a marker, paintbrush, or razor.

 Being new to this whole process I’ve ordered parts that I think will get the job done but will still take a fair amount of experimentation.  The parts come this week, so I can get started!

Peristaltic liquid pump with silicone tubing will draw the paint from the container to the top of the painting. 
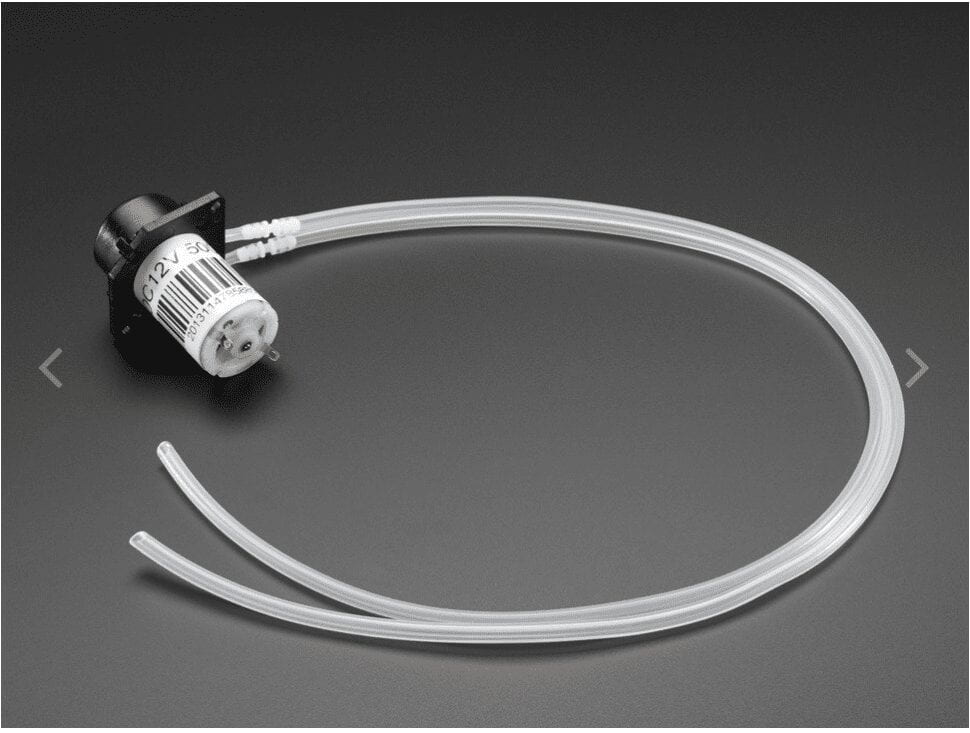
Peristaltic liq. pump. image

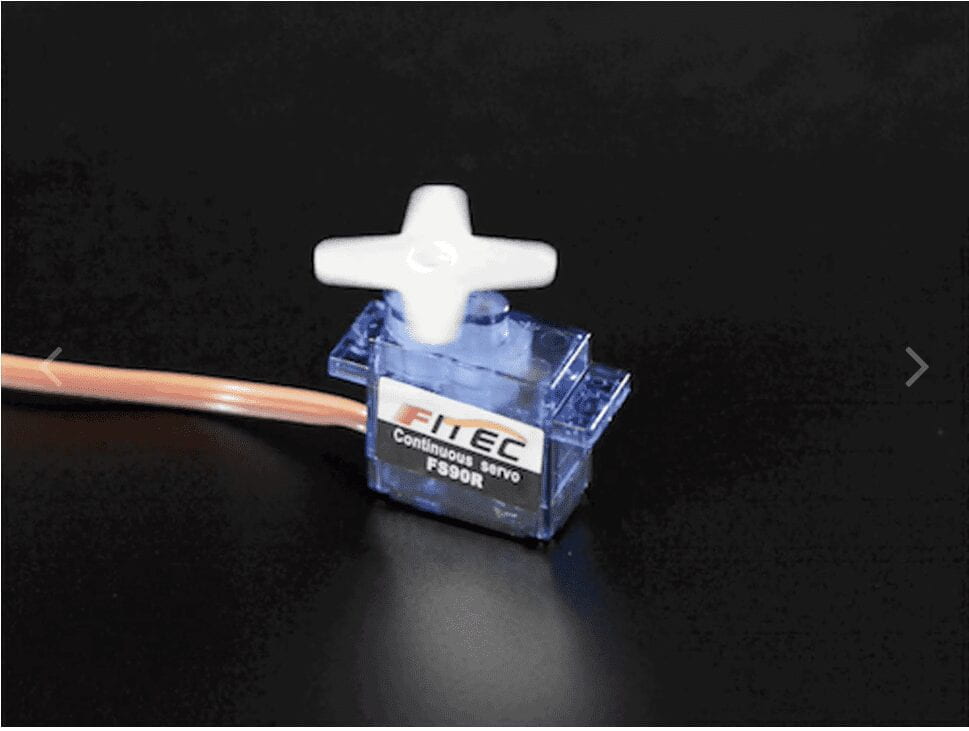
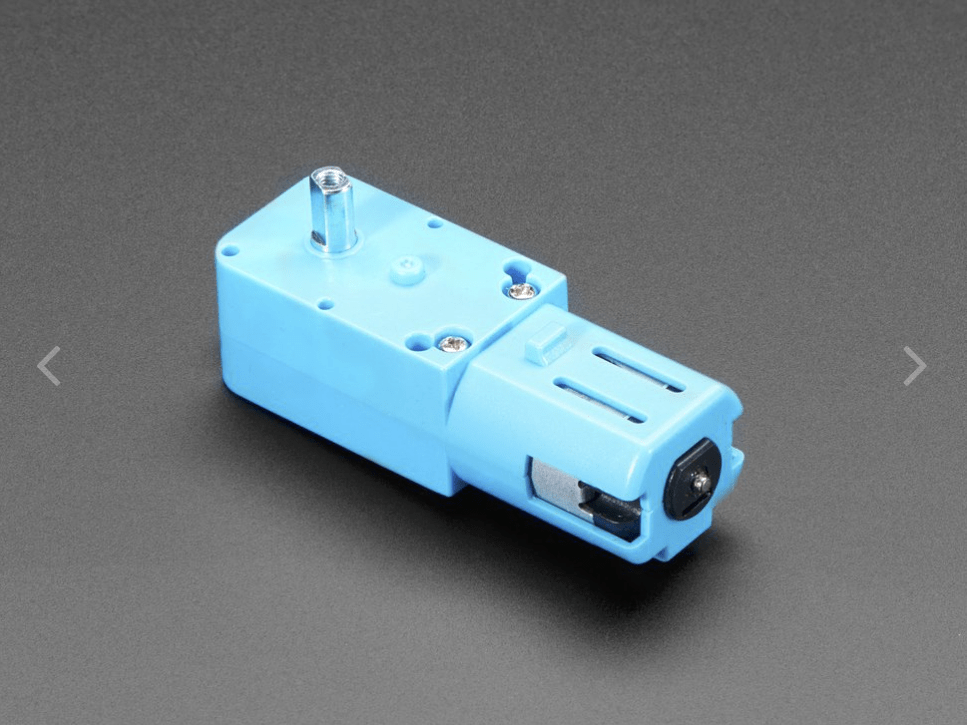
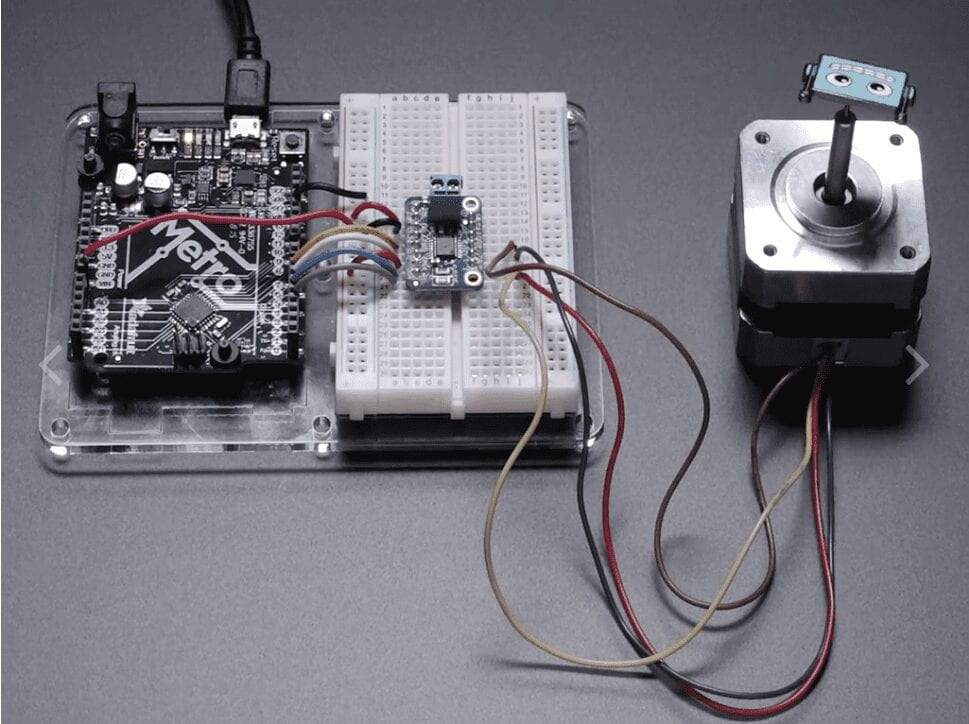
DC Gearbox Motor -TT Motor with a TT Motor Pulley or Continuous Rotation Micro Servo or TT Moto All-Metal Gearbox and a Moto Drive Breakout Board will run the pulley system. 
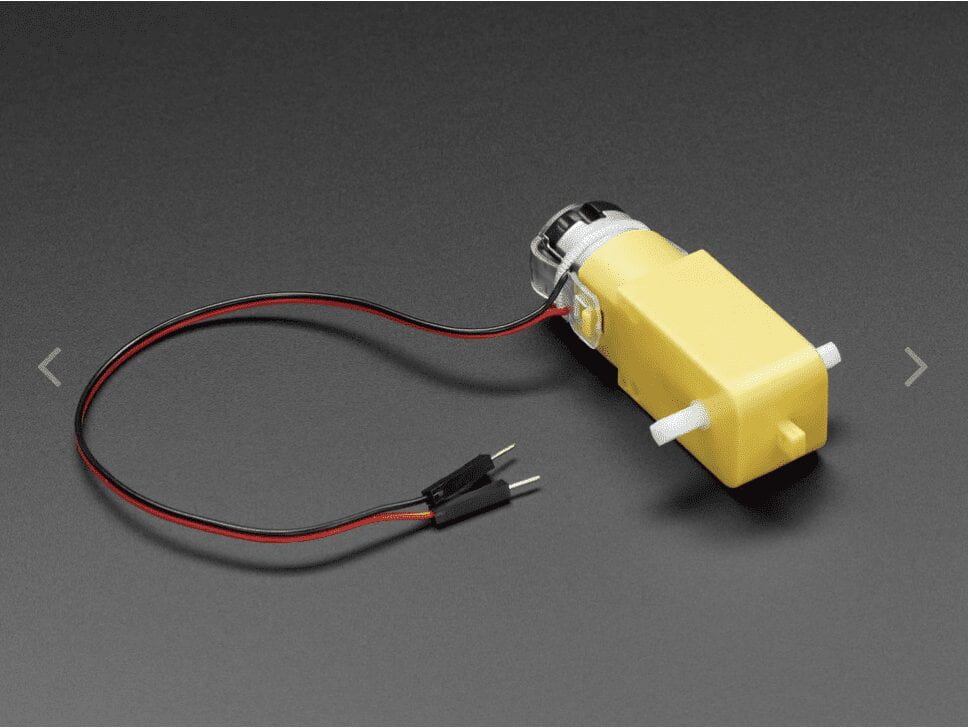
DC Gearbox Motor - "TT Motor" - 200RPM -

Continuous Rotation Micro Servo - FS90R

TT Motor All-Metal Gearbox - 1:90 Gear Ratio

Questions: 

Does the overall concept make sense immediately? 

How does the destruction of a painting/drawing make you feel? How does it make you feel in context to habitat destruction? 

Should the mechanical components be hidden behind a frame of some sort or be exposed? 

Would a fast or slow performance be more impactful? 

Would another destruction method be more impactful? Example: A razor. 

____________________________________________

Two – Way Duplex Lab: 

I had a hard time getting this lab up and running. I kept getting errors that I couldn’t troubleshoot. See below: 
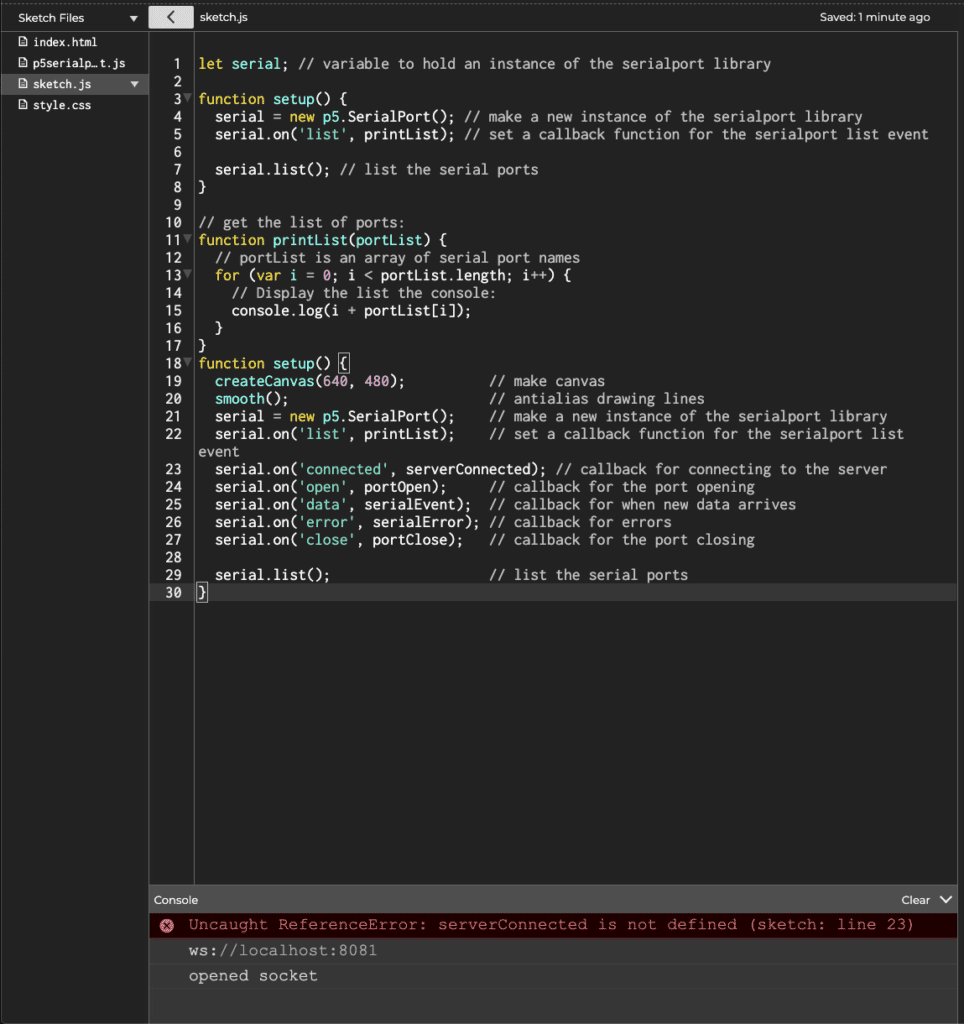
P5JS sketch with error message

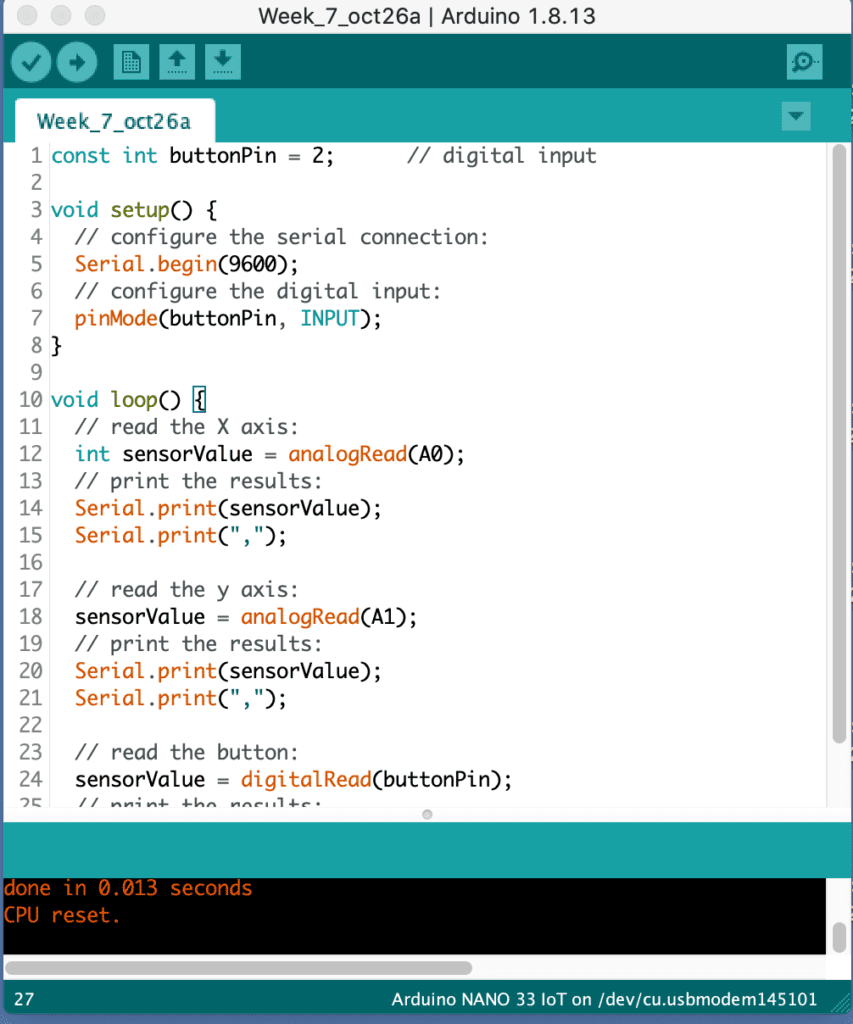
I did however get the Sending Multiple Serial Data using Punctuation section working.  I can see how using punctuation to break up the values can be really helpful for viewing. 

Serial monitor output

Arduino sketch

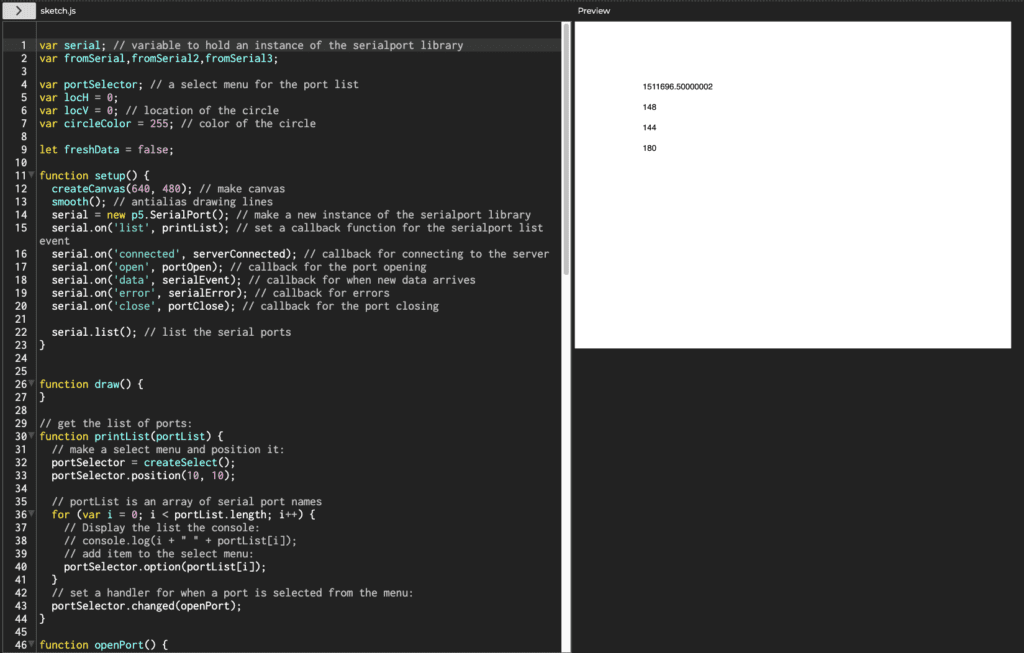
After an office hour session, Danny sent me over a new sketch to try and get this up and running. The code worked perfectly. This is a good thing because now I know that there is something wrong with my code not with my SerialControl or hardware. My next step is to go over this code again looking for my error. 
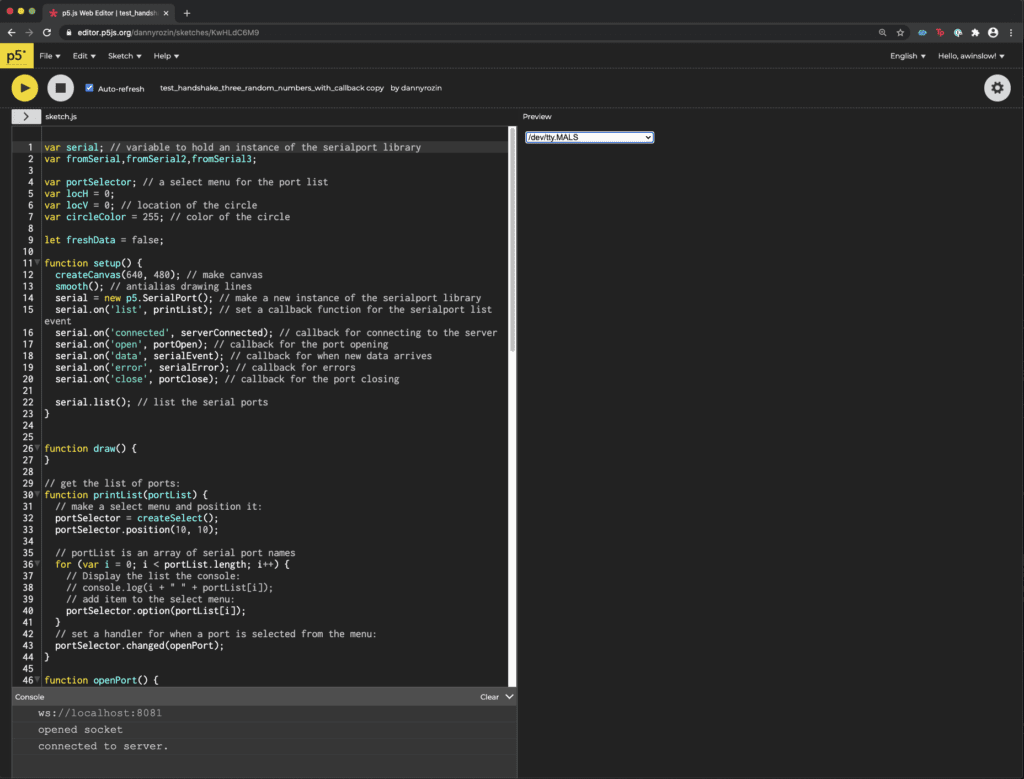
p5js sketch working

p5js sketch working

Getting Creative: 

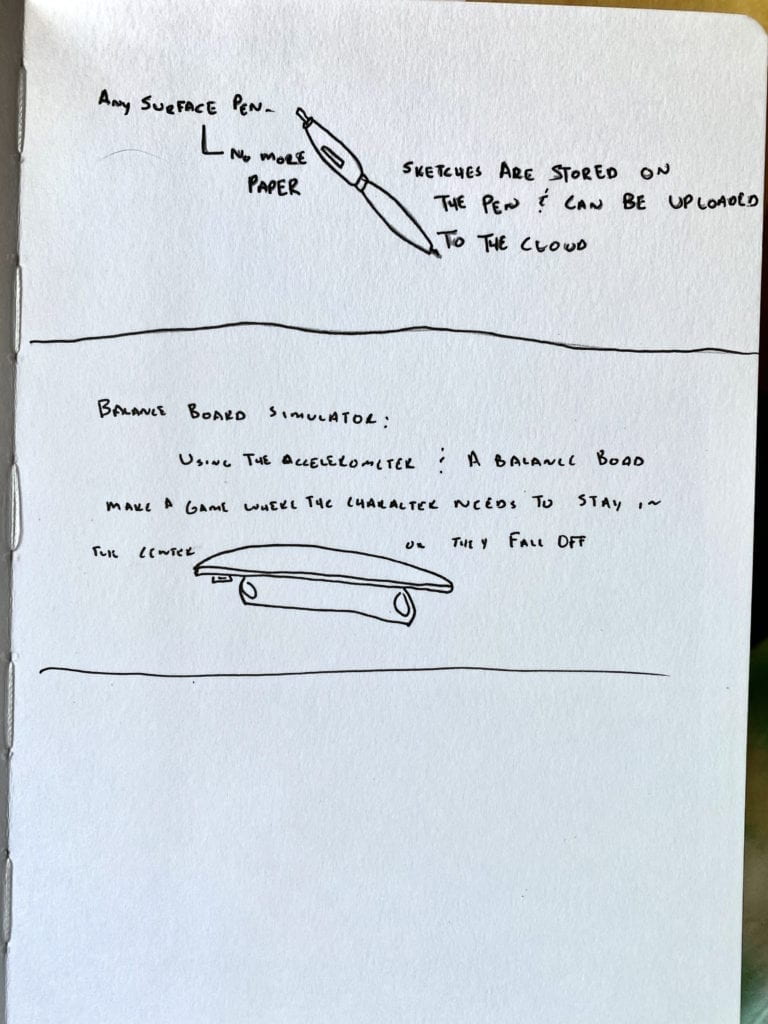
Two projects that I thought could use analog sensors that affect X and Y are:

Any Surface Pen: A pen that will store a drawing that can later be uploaded to the cloud or your device. No need for paper to jot down notes or remember your brilliant ideas. 

Balance Board Simulator: Using the IoT accelerameter on a balance board as a game controller. The player needs to stay in the center or they’ll crash in the game. This project ssems like it could be paired well with a Unity game. 
 

Objects and Arrays

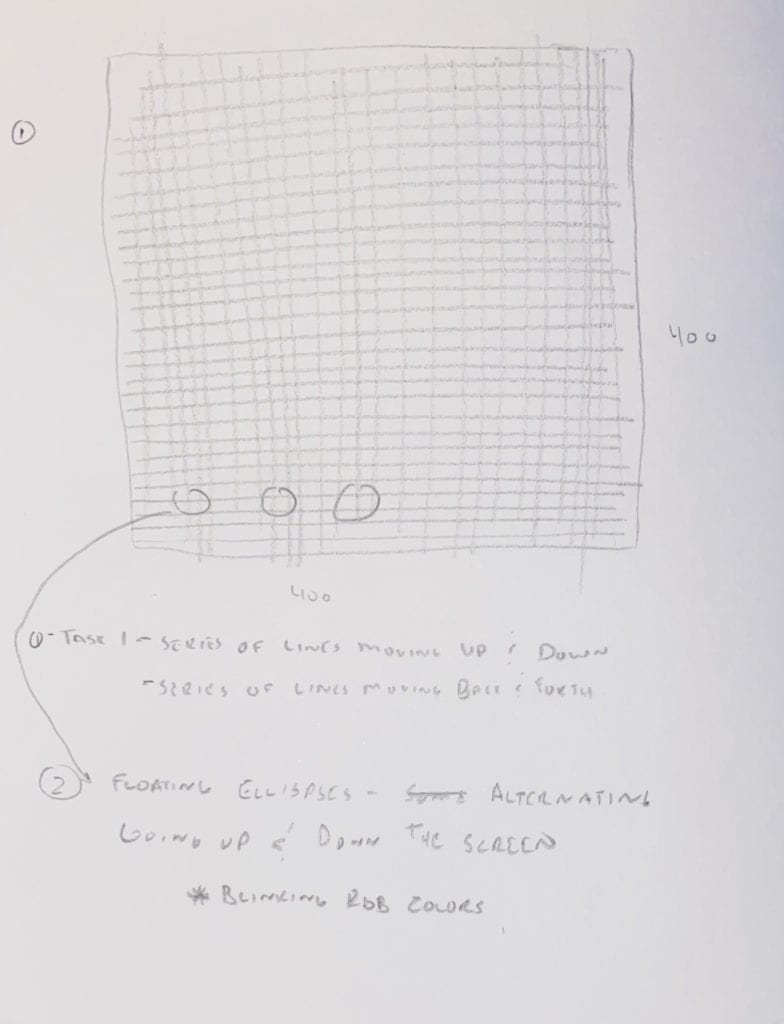
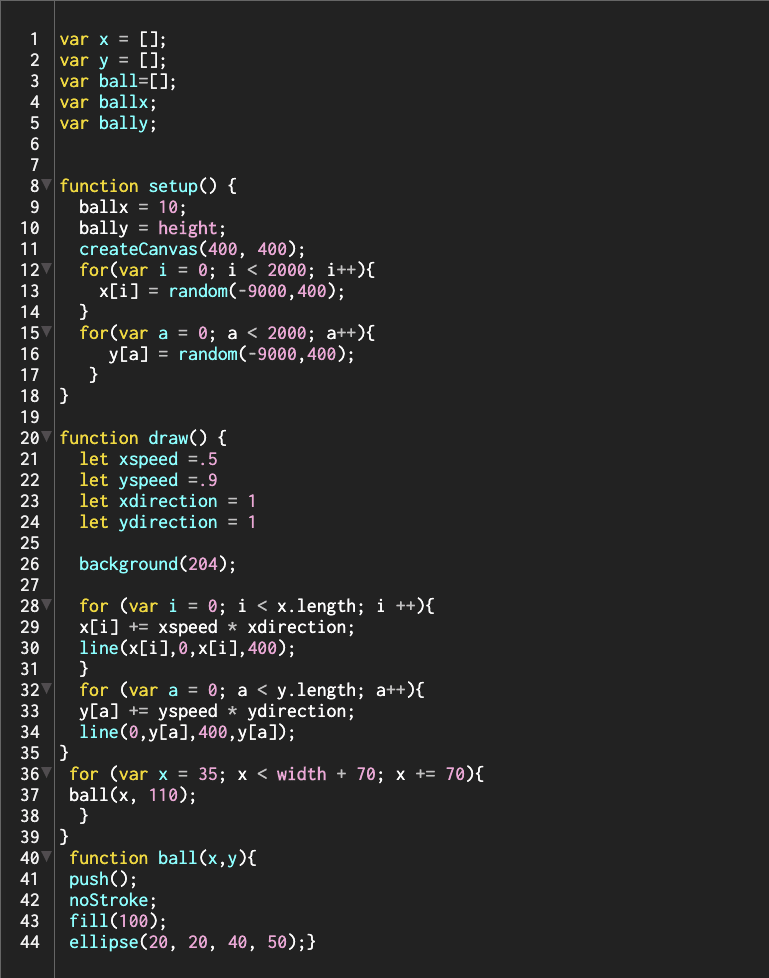
After going over the week’s tutorials, I felt confused. I understood the fundamentals but couldn’t think of a project to do. I re-watched the tutorials and searched the web for some inspiration but was blocked. Finally, I just started sketching in my notebook, reminding myself to think of a simple program that I could test things out. It’s not the most exciting script, but I came up with a thatch type grid with ever repeating colorful ellipses.

Here is my primary sketch. 

notebook sketch of a p5js file

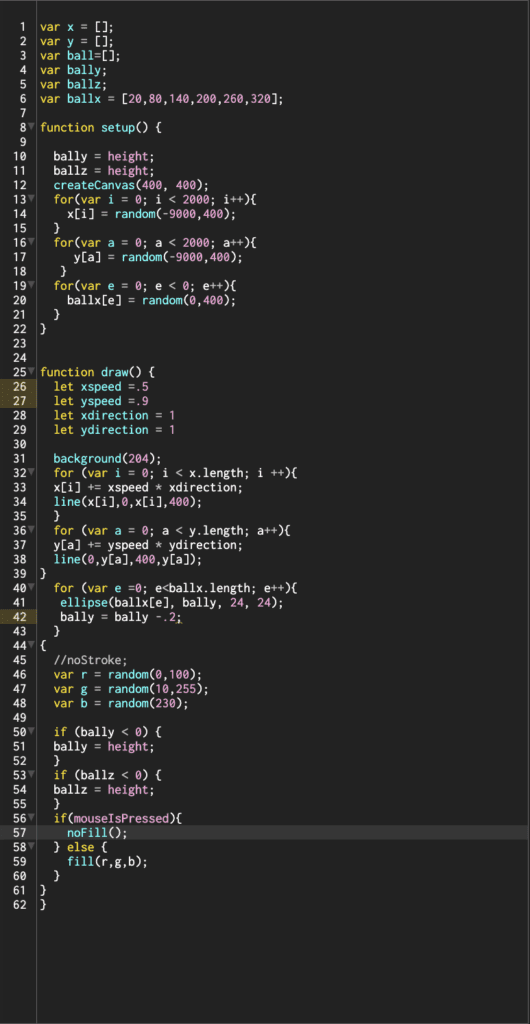
After a great deal of trial and error, I was able to hobble my way to a completed sketch based on my drawing with a few modifications. 

  • I wanted half of the ellipses to go up and a half to go down.
  • I wanted the lines to turn around once they’ve reached the opposite side. 

Because I tried so many different approaches and saved them separately, my final code became really confusing, with oddly named variables and useless code. 

screen shot of p5 sketch

It was important for me to work on this alone to figure out what I really need to work on. This proved to a very frustrating challenge. 

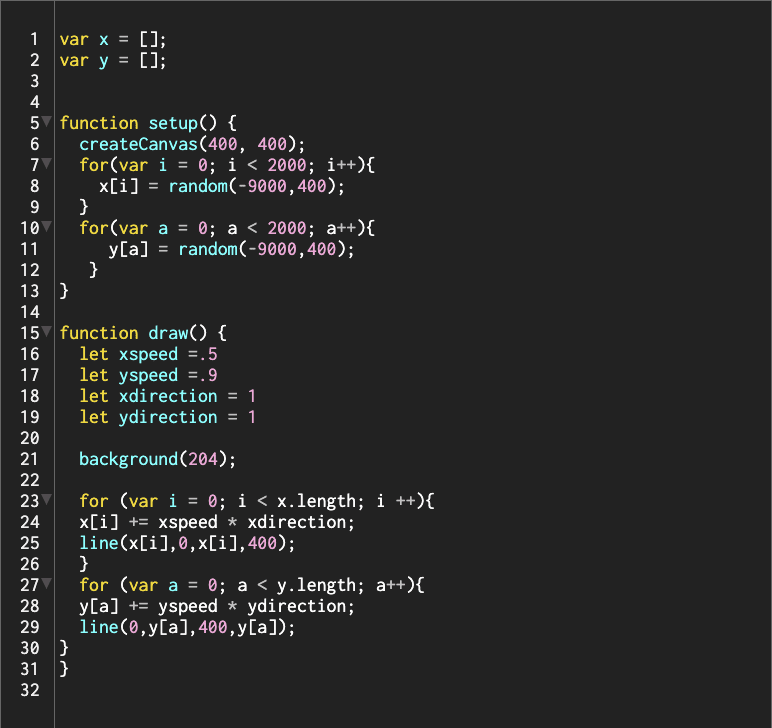
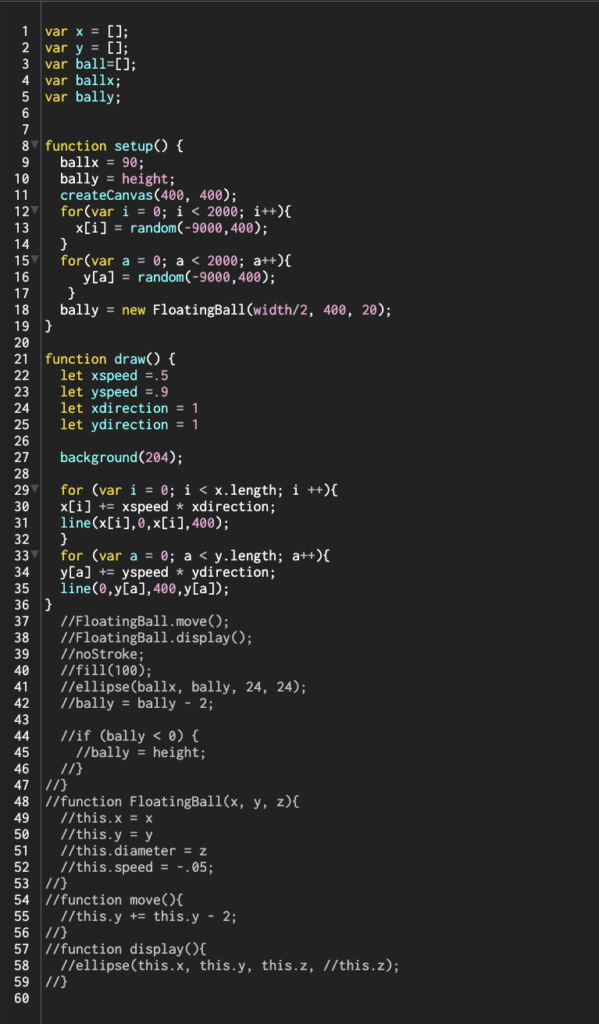
Below are the sketches I saved throughout this process.

Warning, they are full of errors.

screen shot of p5 sketch

screen shot of p5 sketch

screen shot of p5 sketch

Repetition with loops

This week the assignment was to “create an interactive artwork that implements the concept of repetition with variation.” Understanding loops and their functionality has been a challenge for me, but this week it finally clicked. Is crying from joy and relief a normal response to learning how to code?

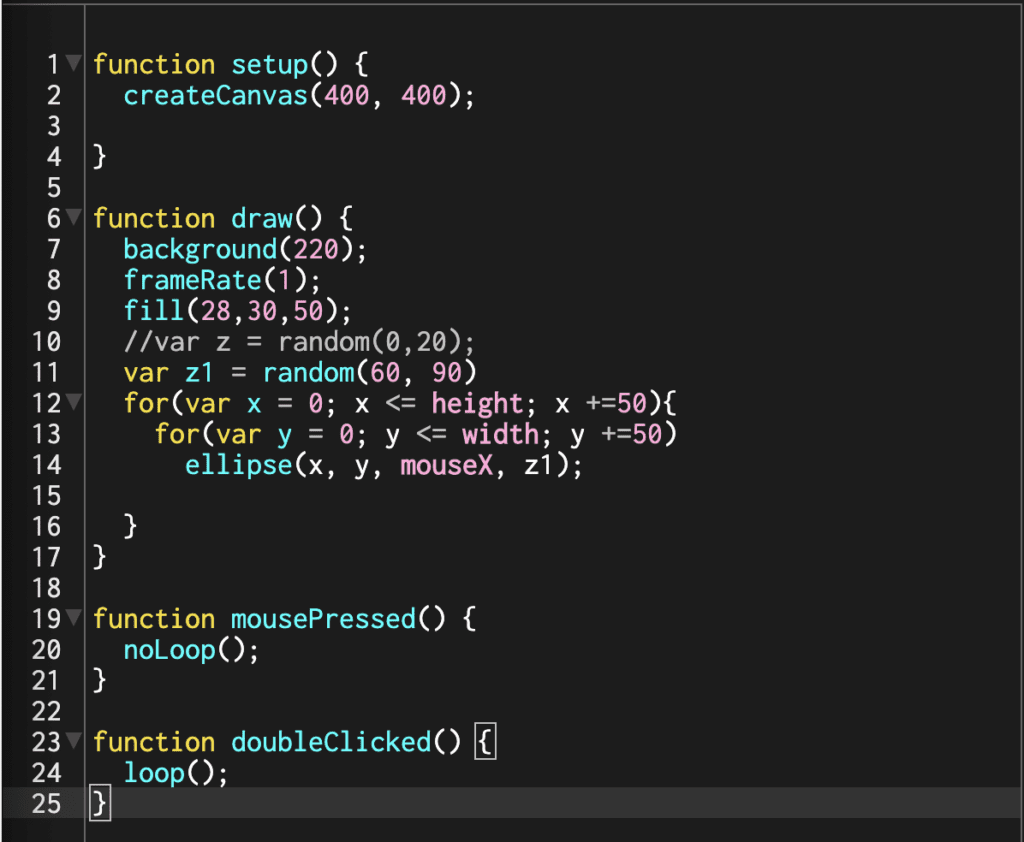
For my assignment, I wanted to make a series of ellipses that the user could modify, but that also changed independently. To achieve this, I used mouseX to adjust the circles’ width and called a random function to control the height. The ellipse is within a nested loop. 

To add a little more complexity and test out some new functions, I added mousePressed to stop the loop and doubleClicked to restart it. 

p5js editor screen shot of a nested loop.

Give it a try here: 

Rollover – Button – Slider

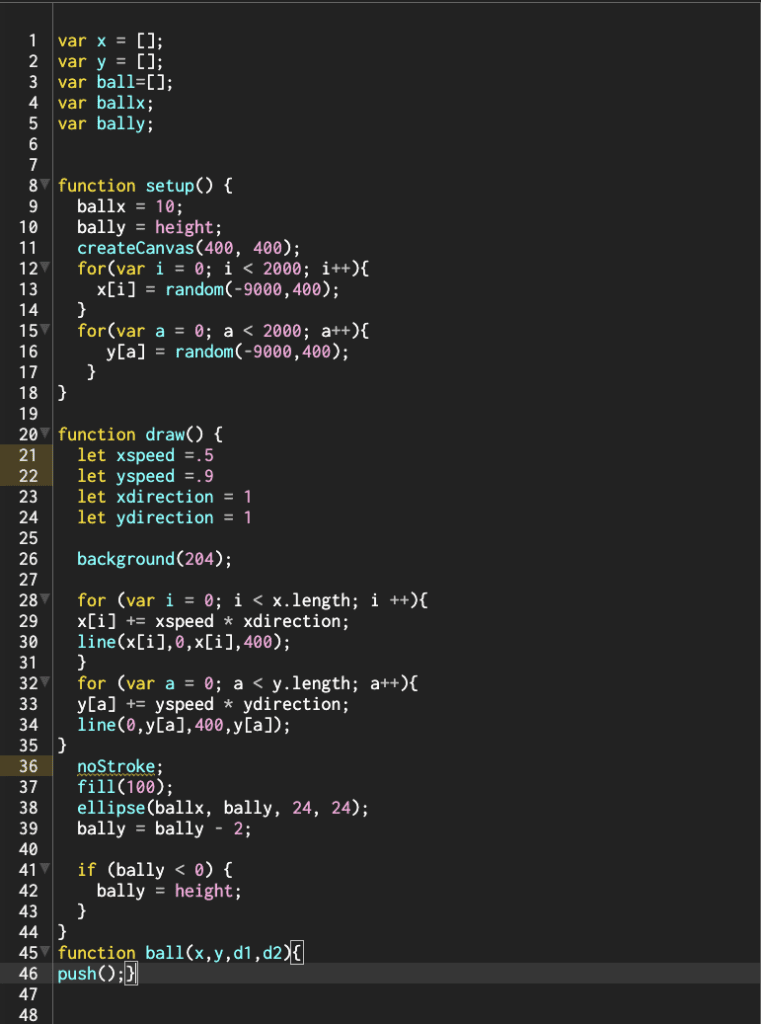
This week we were teamed up to “make a rule-based animation that incorporates motion and interaction and includes a user interface element of your design.” Jenny and I collaborated. Luckily we both are working in NYC and could safely meet on the floor to spend an entire day focusing on the project. 

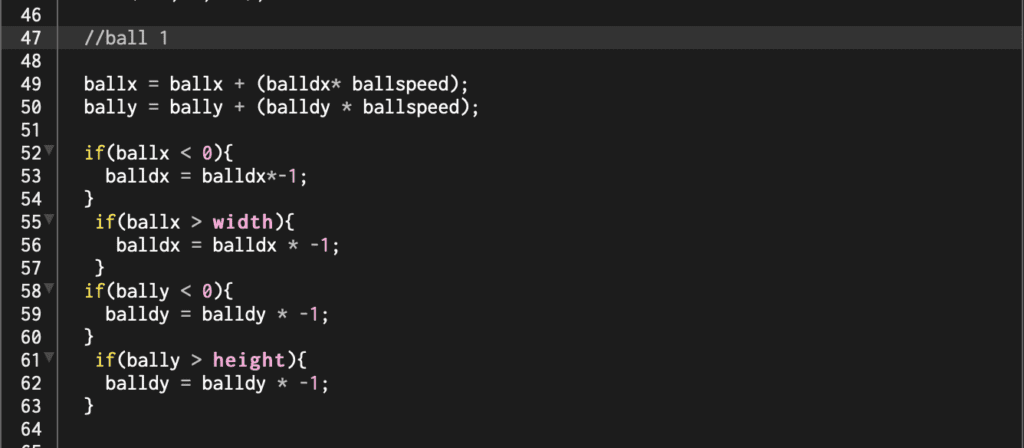
We set out to make a button that when you hover over it, bouncing balls appear on the screen. This undertaking seemed both challenging and executable. We knew that we needed to use if statements to constrict the bouncing balls to the canvas, so we started there.

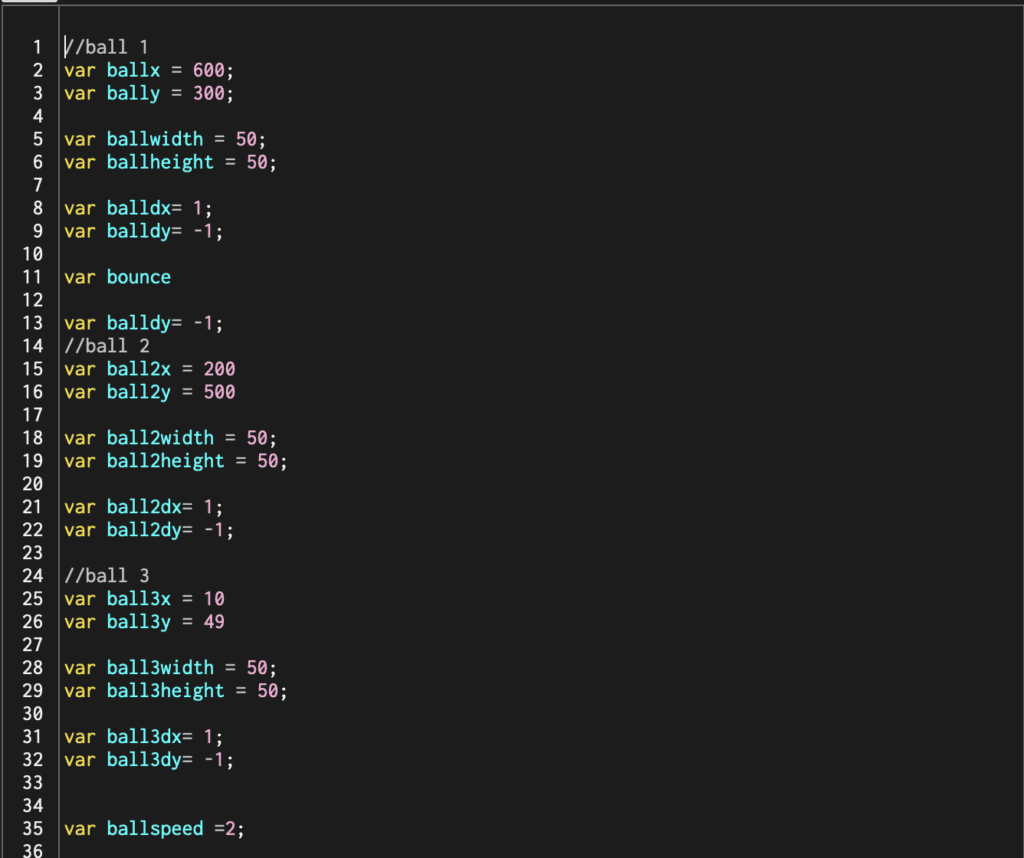
First, we set up all our variables. 
A list of variables in p5js editor.

Next, we started writing out our if statements one for each side. We thought that if the ball reached the edge, we would multiple the direction by -,1 reversing it.  This worked great, but the code seemed very long. 

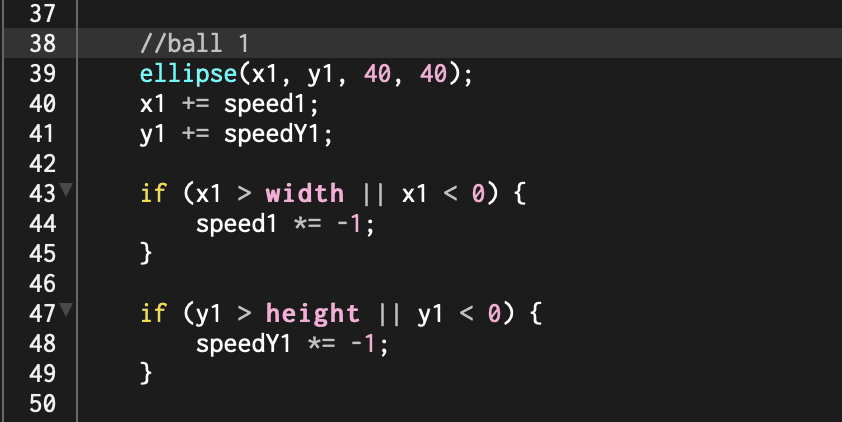
After giving it some thought, we came up with a way to shorten everything down. Instead of writing out an if statement for each side, we used an if statement containing || (or). This modification cut our code down significantly and made it easier to read. p5js sketch using or statements.

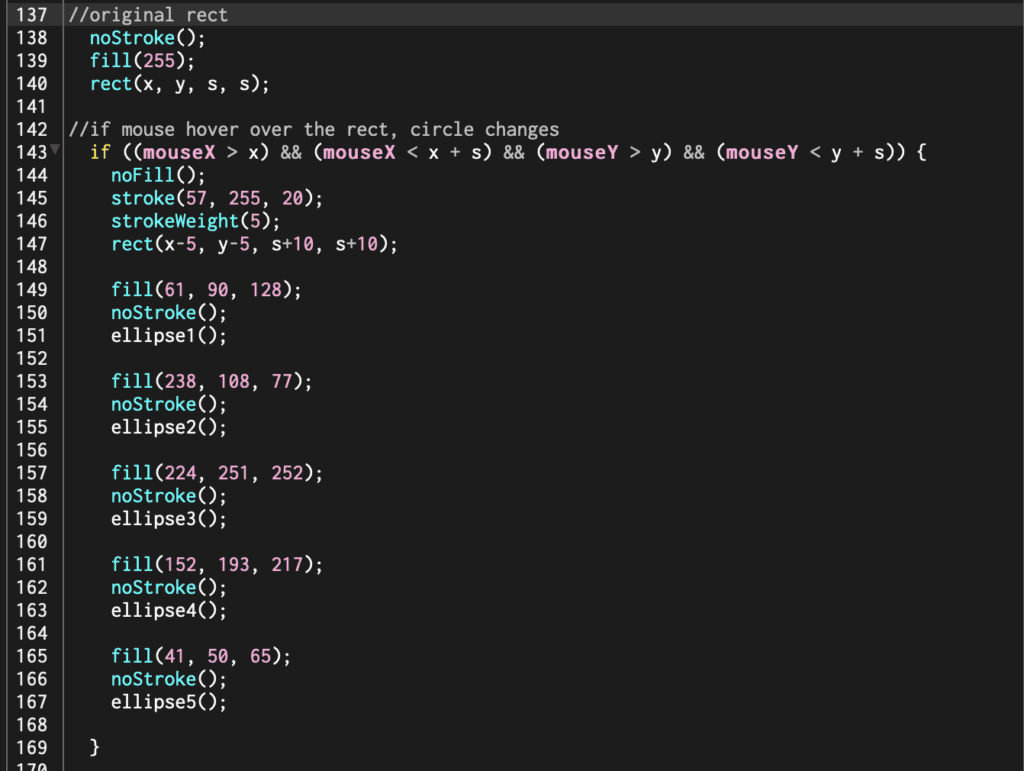
The final step was to make the rectangle that would activate the bouncing balls. 

Mouse activated button on a p5js sketch.

After we completed the sketch we wanted something just a little more dynamic. So we decided to add one more statement which changes ball size back and forth.

p5js sketch show a shifting circle size function.

Click here to see the final sketch. 

I had a great time pairing up on this project. It was fun collaborating, bouncing ideas off each other, and having someone to help troubleshoot. Every week I develop a much deeper appreciation for every button, switch, and component of a computer. 

Clock Failure – Character Success

At the start of the week, I had the idea to make a clock. I was concerned that I was biting off more than I could chew but excited to take on the challenge.

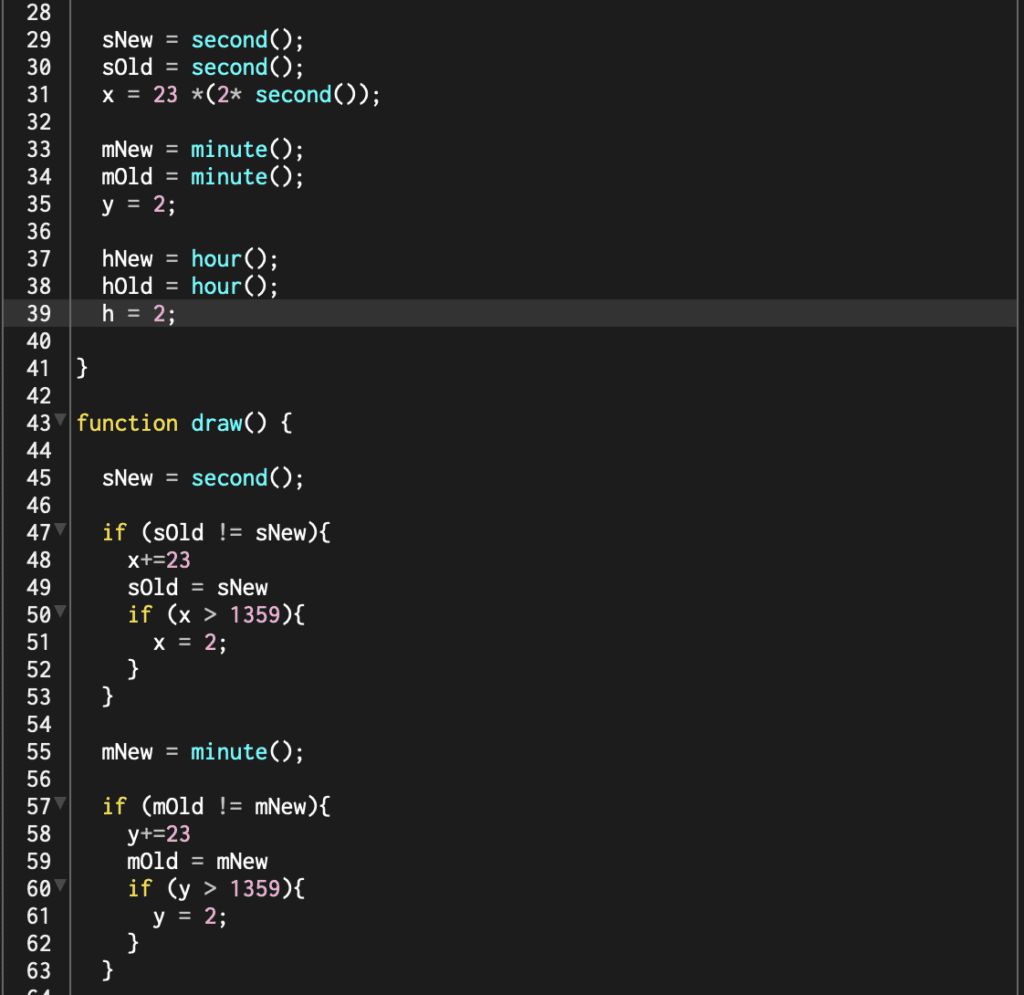
First, I laid out my sketch to have 60-second blocks, 60-minute blocks, and 24-hour blocks. I would call the second, minute, and hour functions to light up the blocks. Using a variable for RGB colors would blick in the current time setting when it advanced, one random color would be left behind. My first problem was the clock wasn’t running. I soon realized that I needed to code some sort of statement to move the rectangle. With the help of Philip Cadoux, I learned IF statements. A sample of that code is below:

Code sample for a P5JS sketch showing an if statement

The clock advanced based on the clock on my computer with a couple of problems. It always reset and didn’t show the proper time. I made a jumbled timer. Lost, I sought out some office hours. I had a great conversation, but we couldn’t come up with a proper solution. After spending a couple more hours on the project, I became frustrated and decided to put this project on hold until I learn more about IF statements and loops. I will come back and complete this sketch!

In the meantime, you can see the current sketch here.

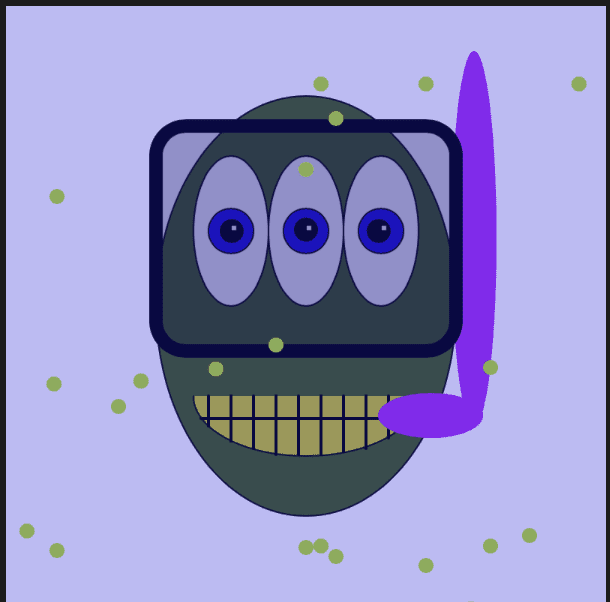
I still wanted to create something this week that uses everything that I’ve learned so far. With a new sketch and idea, I got to work drawing an interactive version of a doodle I’ve drawn for years.  This is Frank, the Gowanus Canal monster. *Gowanus Canal is a highly polluted body of water in Brooklyn that I lived near for years.

Doodle of a monster underwater

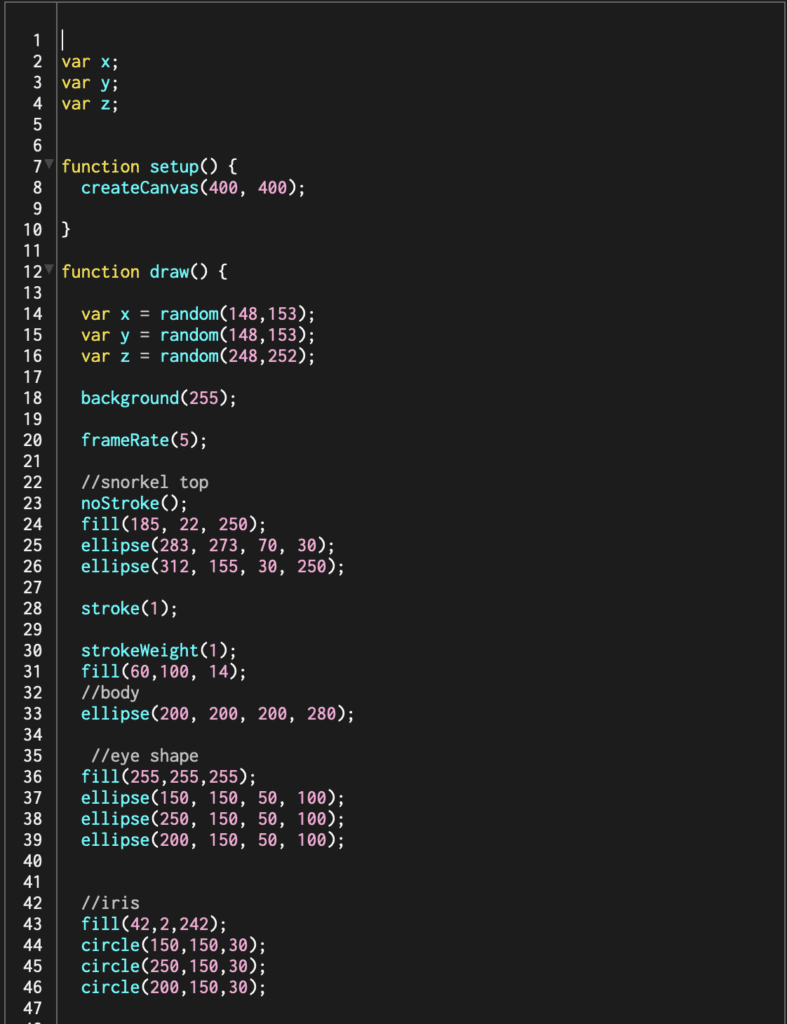
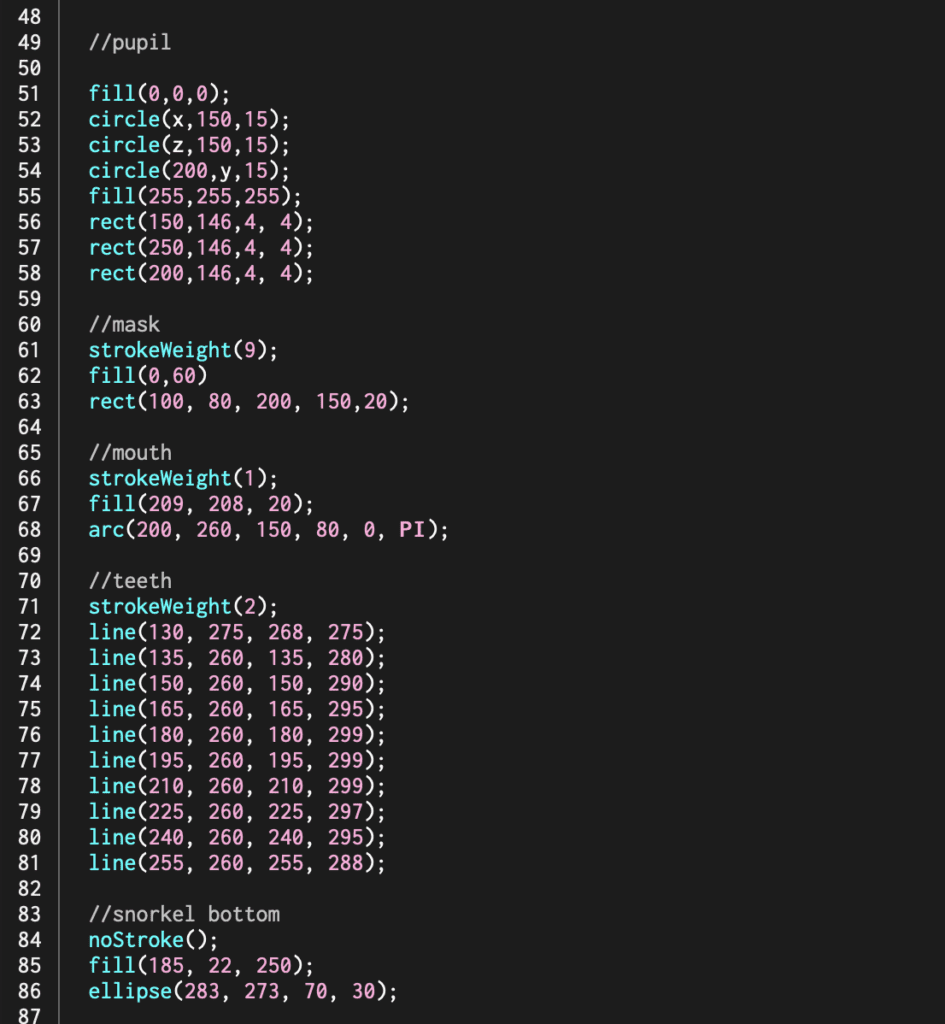
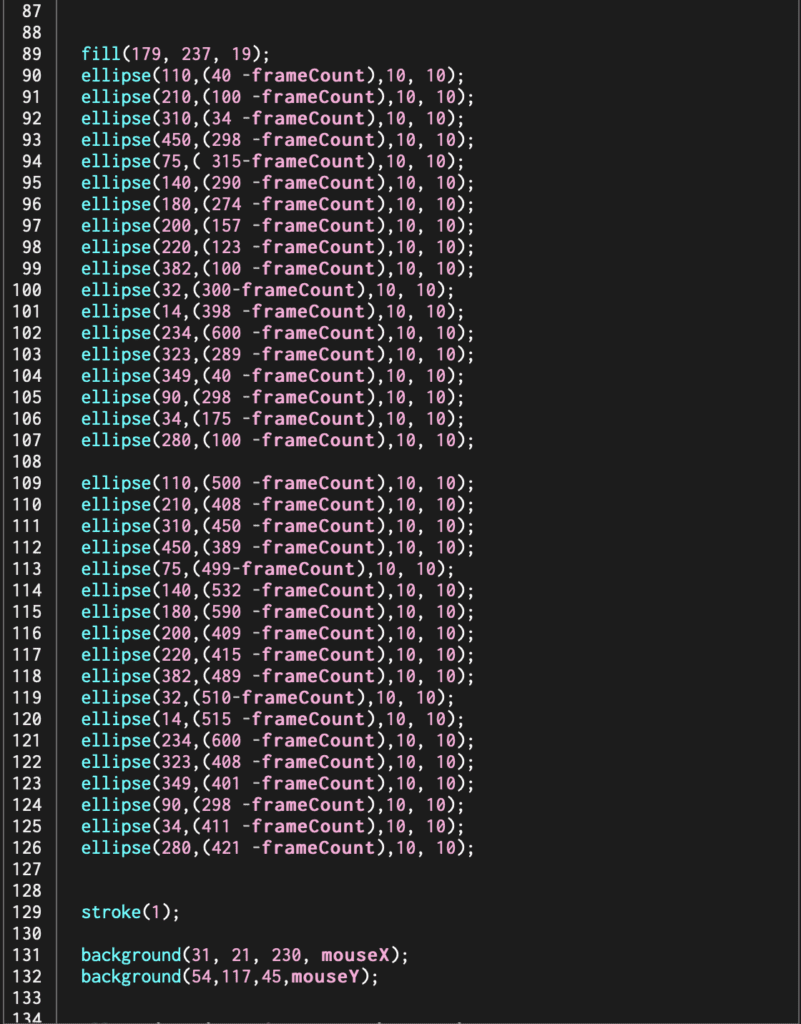
When you play the program, the bubbles rise from the bottom but using -frameCount. Frank’s eyes bounce back and forth that I achieved but using a random variable—finally, the color mix of the water changes based on mouseX and mouseY movements. I used two background settings, one blue and one green, to make the mixing effect. 
Below is the code: 

P5JS sketch

P5JS sketch

P5JS sketch

This sketch isn’t as elaborate as my original clock idea, but it brings me a lot of joy. I tackled some new techniques like mouse movement, variables, and frameCount in a more light-hearted approach. The friends, I sent this to also got a good laugh out of it. Sometimes simple is better, but I will finish that clock!
To see Frank in full glory, head over here. 

p5js – Self Portrait and Looking Ahead

Being completely new to coding, I was unsure how to start my first assignment, making a sketch using primitive shapes and color tools. After watching the tutorials and reading all the documentation, I knew I had to jump in, make a ton of mistakes, and learn by trial and error. The p5js reference documentation quickly became my friend.

The first problem I encountered was understanding how the X-axis and Y-axis worked. Frustrated on how to lock down locations, I started to research online. Eventually, I stumbled upon a former ITP student blog post on this very assignment.

Vidia spoke about how she found an Image Map Generator site that would plot the drawing’s edge coordinates. I played around on this site for a while but couldn’t get it to work; I would like to explore it more once I have more experience under my belt.

Back to my sketch, I started placing shapes and moving them around to get a better grasp of coordinates. Since I was drawing a face and wanted symmetry, the second feature fell into place much quicker.

The next problem I struggled with for a long time was producing an arc. I couldn’t wrap my head around how to specify the angles in radians. With a little research, I found if I placed. angleMode(DEGREES); at the beginning of my sketch, I could work in degrees instead of radians, which made a lot more sense to me.

The final problem I encountered was working in the proper order. I originally drew the entire sketch and waited to color and remove strokes at the end. Quickly finding out that color was applied to everything below.

Final Note: I found that organization and notes are essential. I ended up breaking each section of the face-up with comments so I could go back later and make corrections.

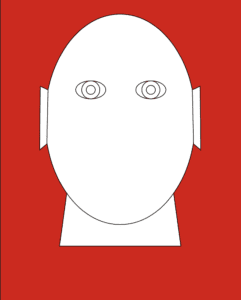
Rough Draft Sketch:

The first rendition of my sketch. The face only contains eyes and pointed ears and is completely white set on a red background.

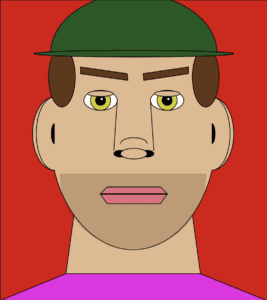
Final Sketch:

My final sketch a complete face set on a red background. The mans face has a light beard and is wearing a green hat and purple shirt. He also has brown hair and green eyes.

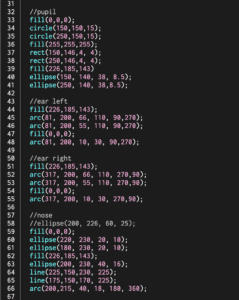
Code Example:

An example of my final sketch code.

My final code: Assignment 1

This exercise has got me thinking about the types of projects I would like to work on this term. I have been working as a photographer during my entire career and have always been drawn to public art and interactive art. The two main reasons I like this style of work is because, for one, I find public art more disarming and accessible. Two, I find that interactive work gets a level of engagement, both active and passive, that static art doesn’t.

In the past, I would have to hire developers to help me achieve my vision. Eventually, this would work, but it came with a host of problems, including:
1) I would have to secure more grant funding to cover the costs of bringing on help.
2) Without proper training, I only had a basic understanding of the technologies available and how to work with them. This left me feeling that I wasn’t pushing my work as far as I could.

This term, I am looking forward to grasping the necessary computation skills to make me a better teammate and explore new techniques to create more dynamic public art.

My work has been focused primarily on putting visuals to scientific research. I would like to continue down this track but also make purely visual pieces this term. For these reasons, I think I’m particularly drawn to these three pieces:

HintFM : Wind Map
Jill Hubley: NYC Trees
TeamLab: Universe of Water Particles Falling from the Sky