Chaotic Glacier – Playful Communications of Series Research

This semester-long project was in collaboration with Philip Cadoux, Pauline Ceraulo, and Sean Zhu. We were tasked with using actual research to create an interactive and educational museum installation. 

The project is based on the research entitled “Centennial response of Greenland’s three largest outlet glaciers” by David and Denise Holland of the Courant Institute at NYU and the Center for Global Sea Level Change at NYU Abu Dhabi.

Our installation focus was to introduce the viewer to general topics of how this complex research is conducted through climate models, chaos theory, and tipping points. 

Activation 1: Double Pendulum – Demonstrating the fundamentals of chaos theory. 

Chaos Theory – What do viewers need to know? 

  • One action can have a large-scale, snowballing effect on the larger system. 
  • There are patterns in the chaos that we can use to estimate whether changes/events. 
  • Glacial melting is a phenomenon closely tied to weather and chaos theory. 

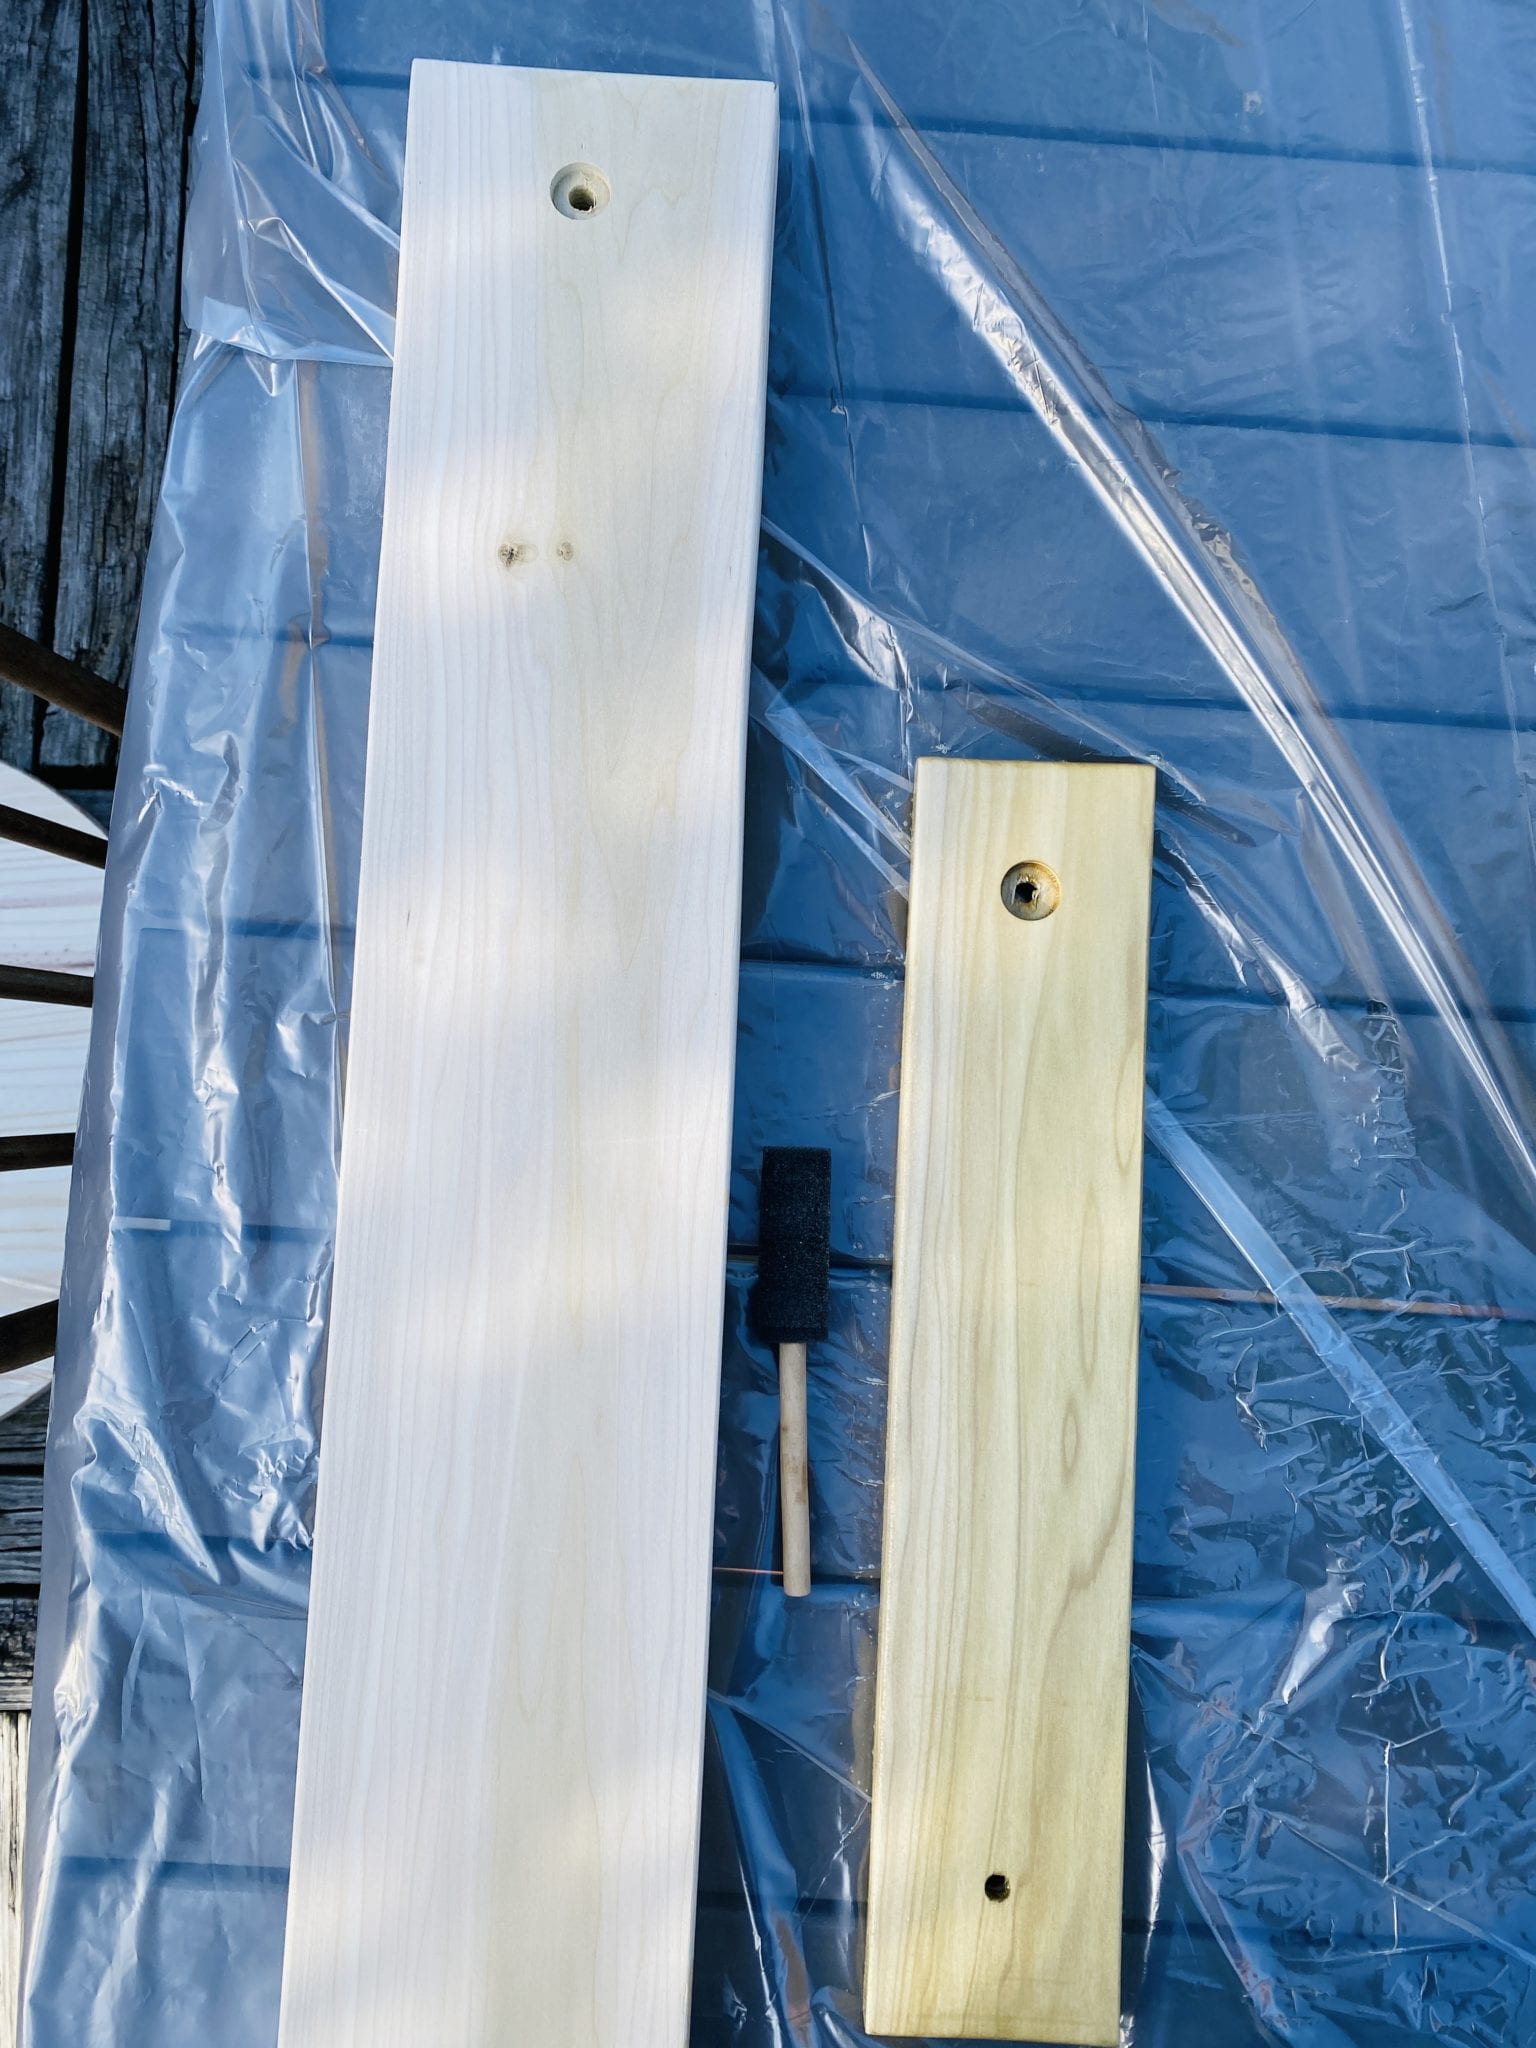
Production of Double Pendulum: 

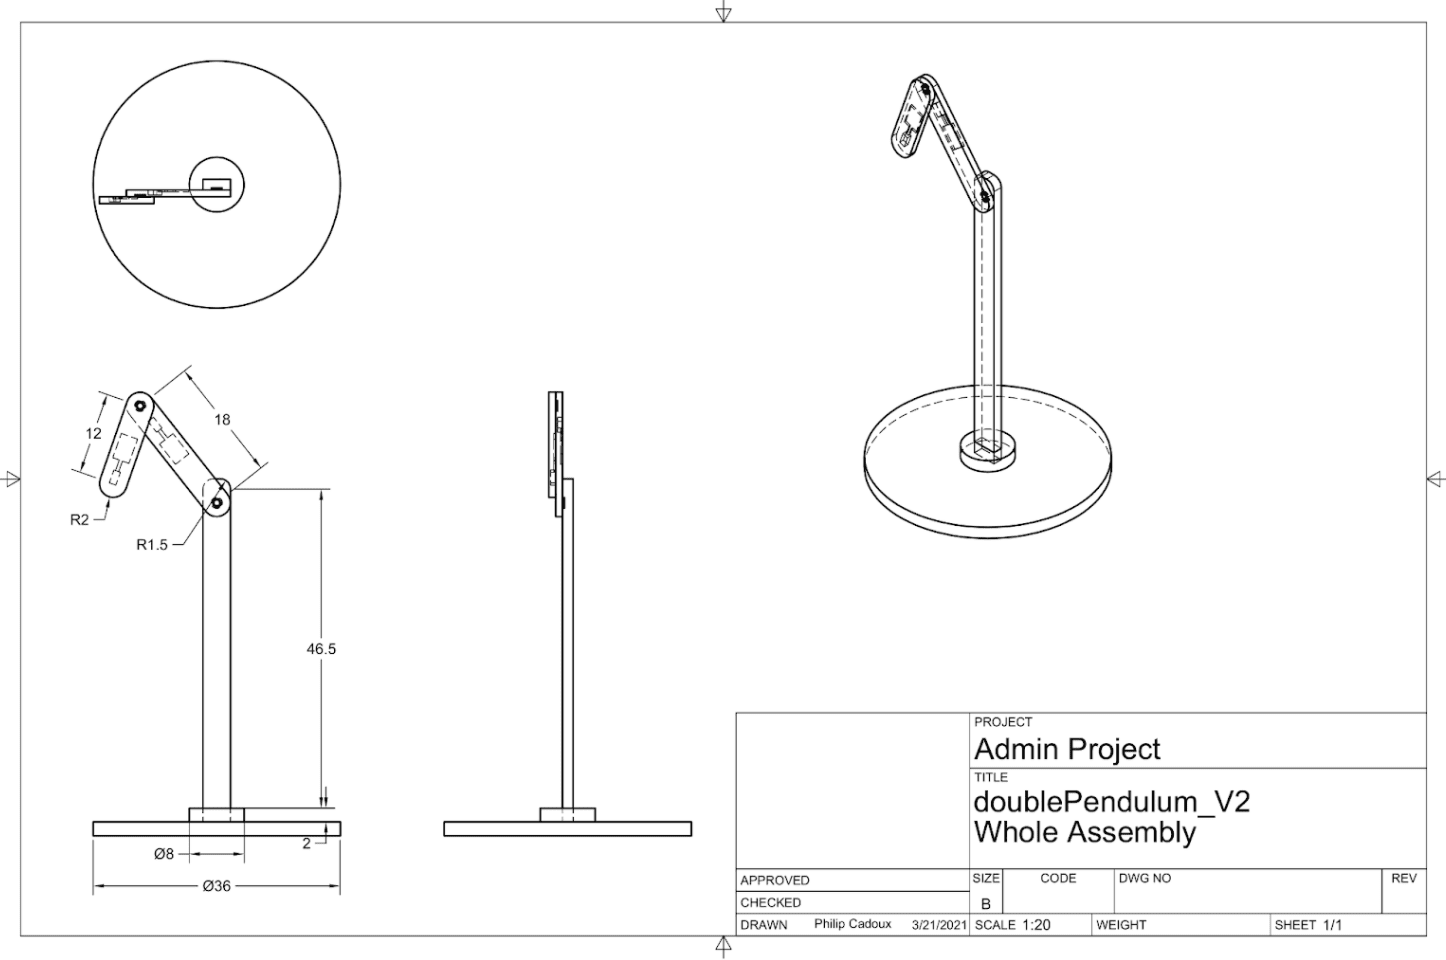
Cad drawing of Double Pendulum

Orginal CAD drawing

Playtesting

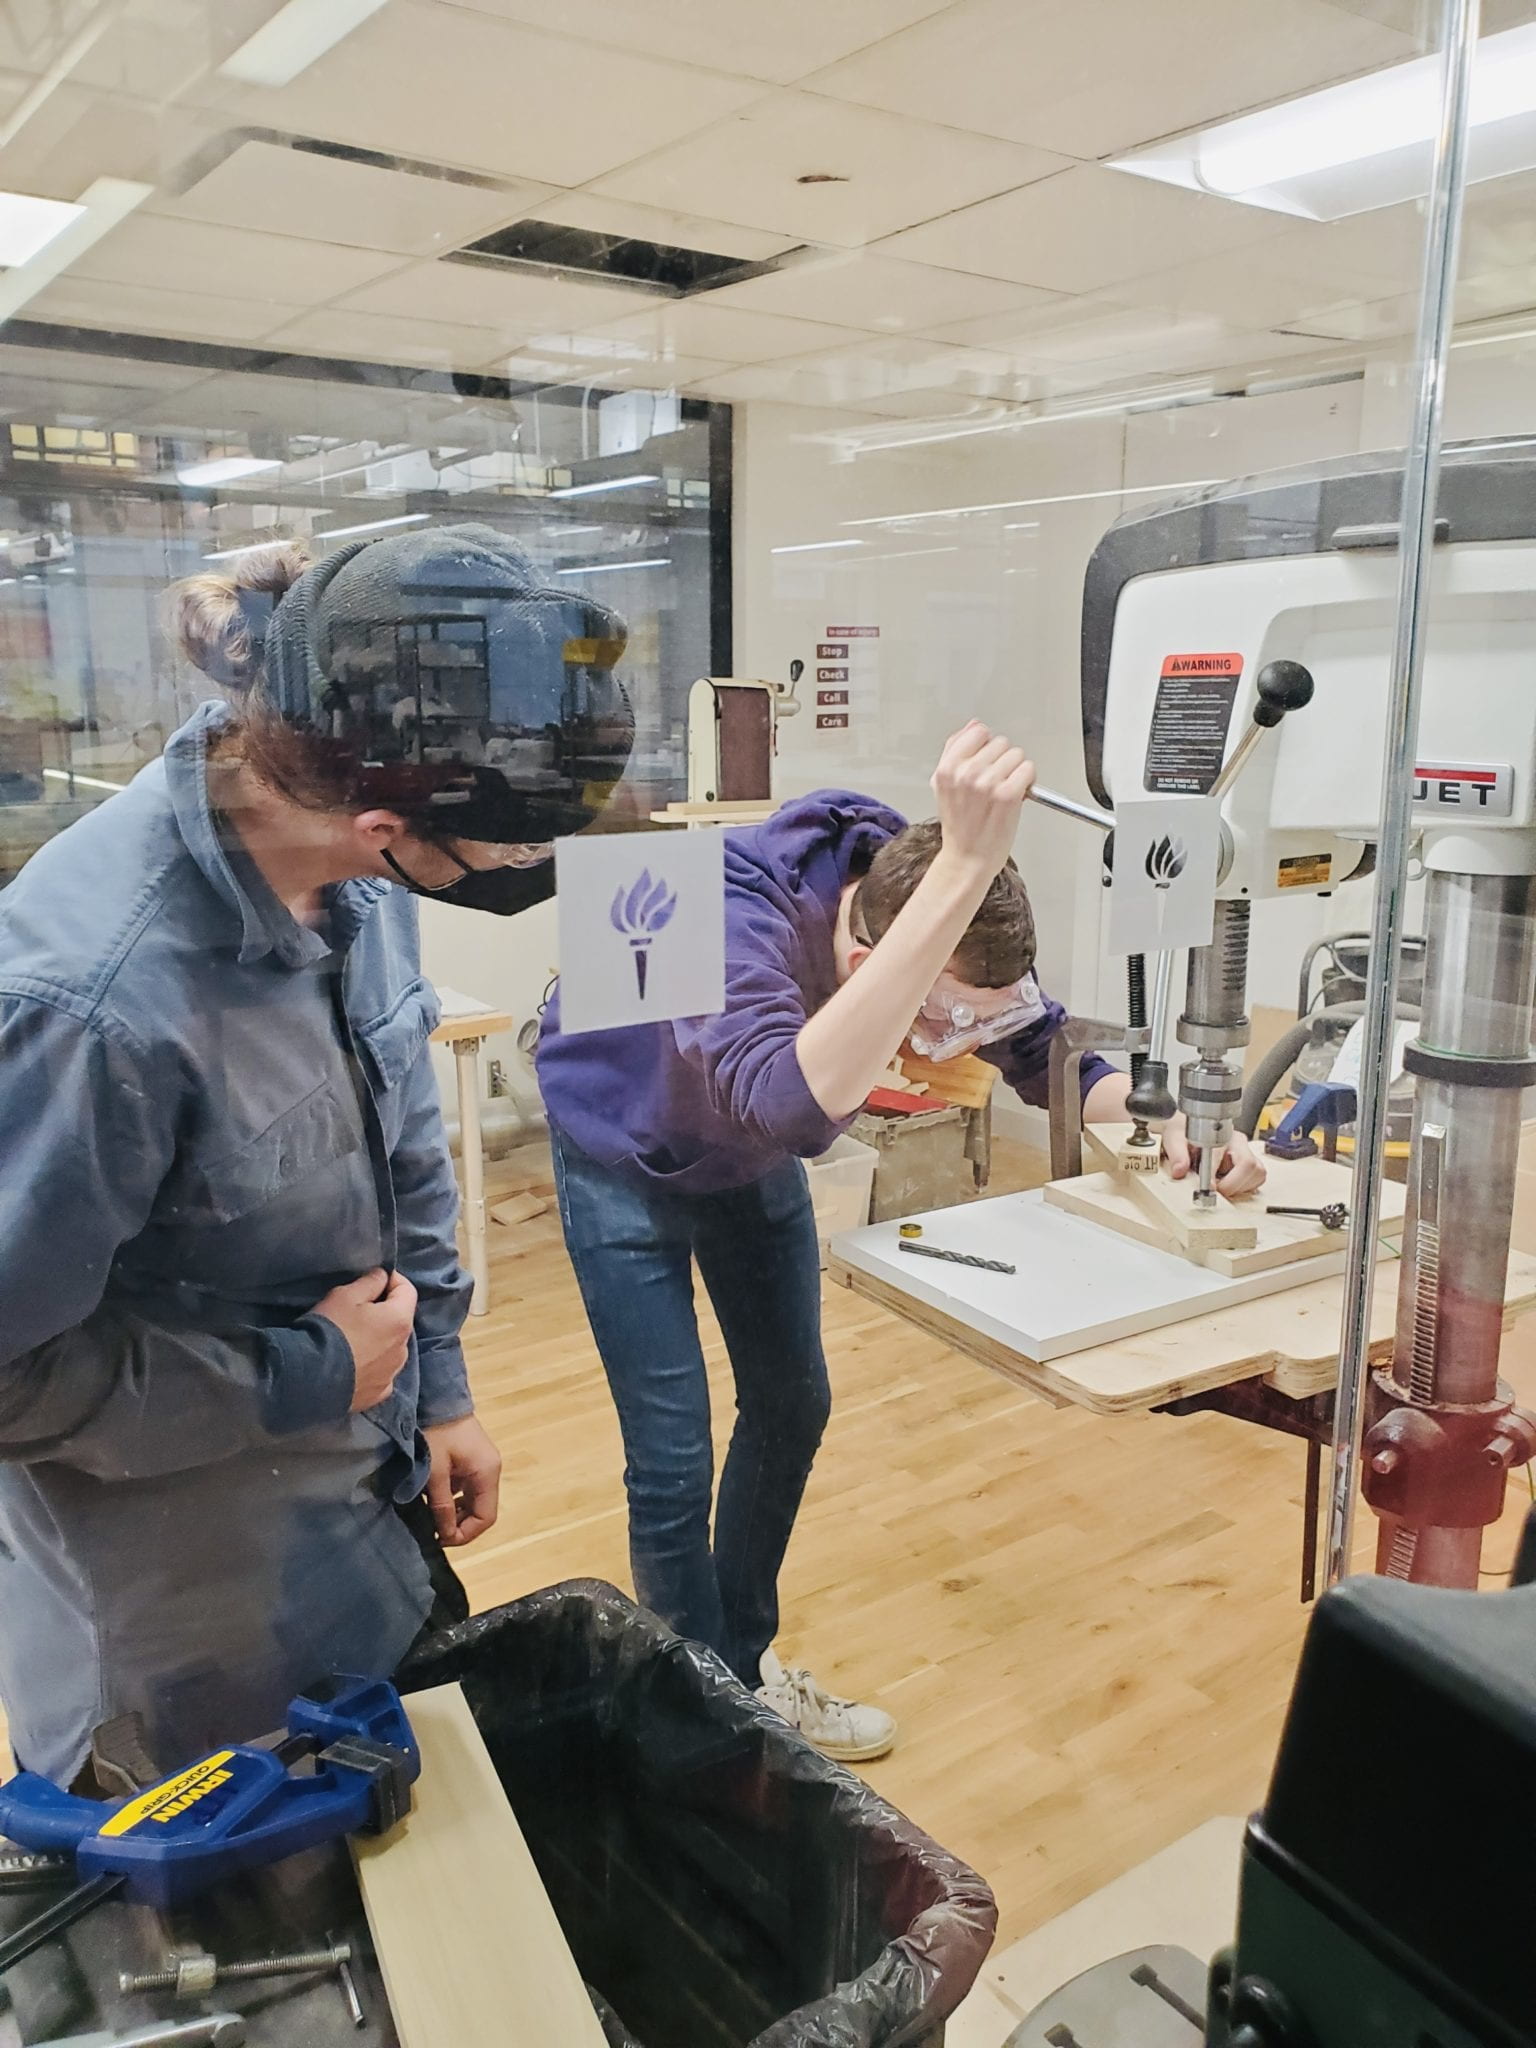
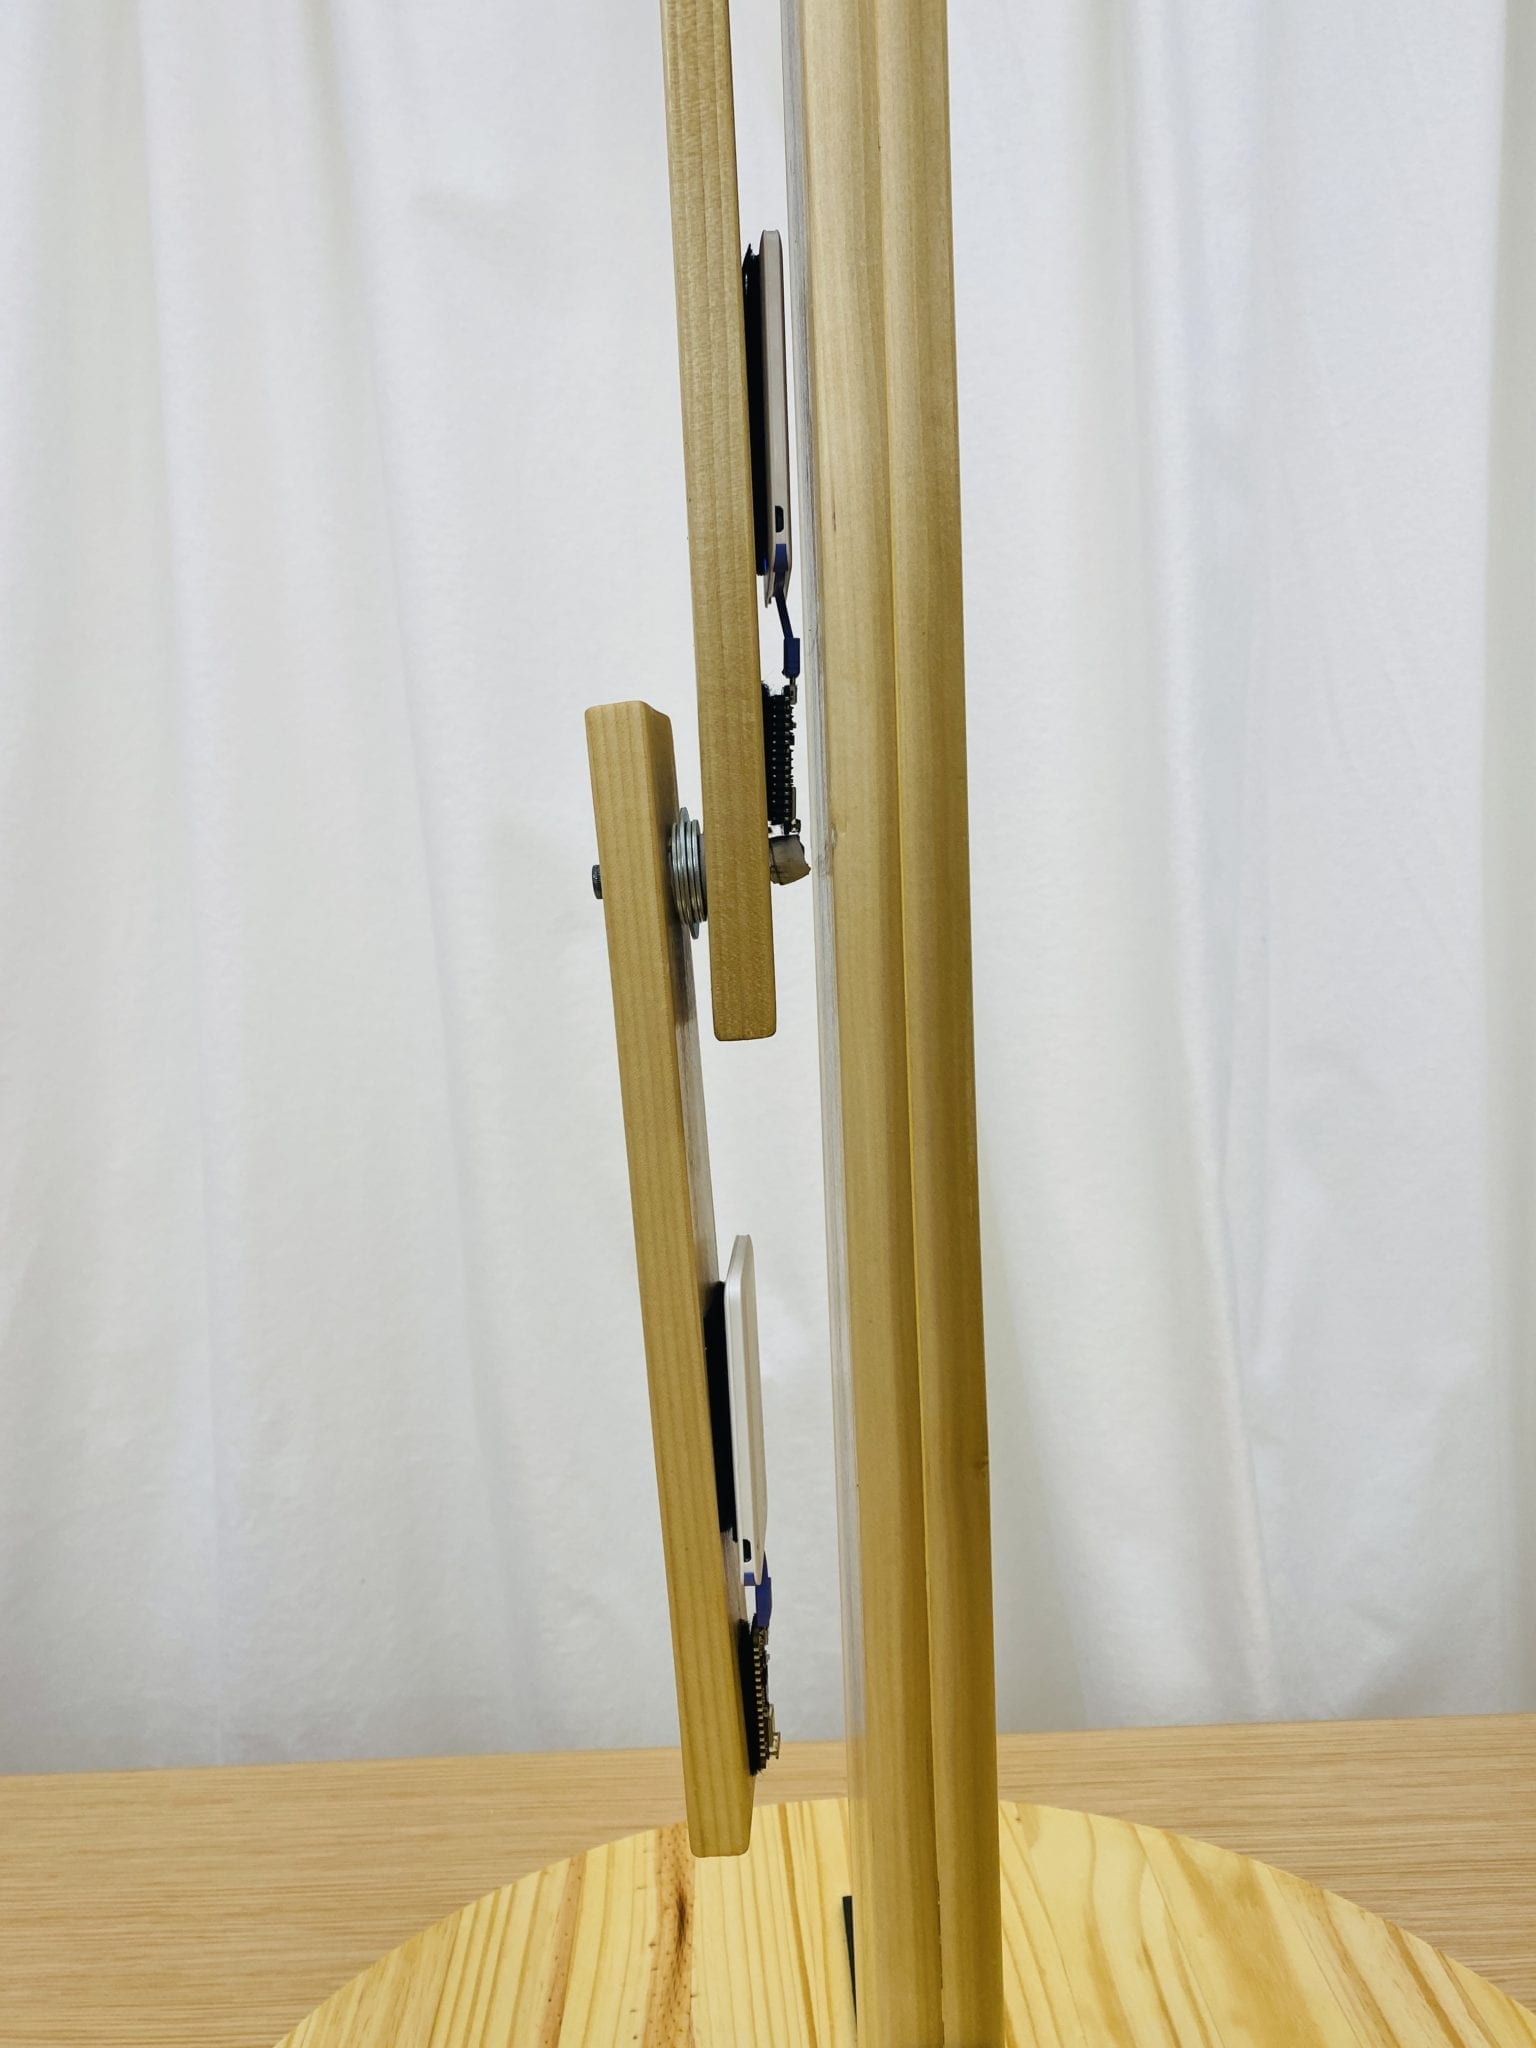
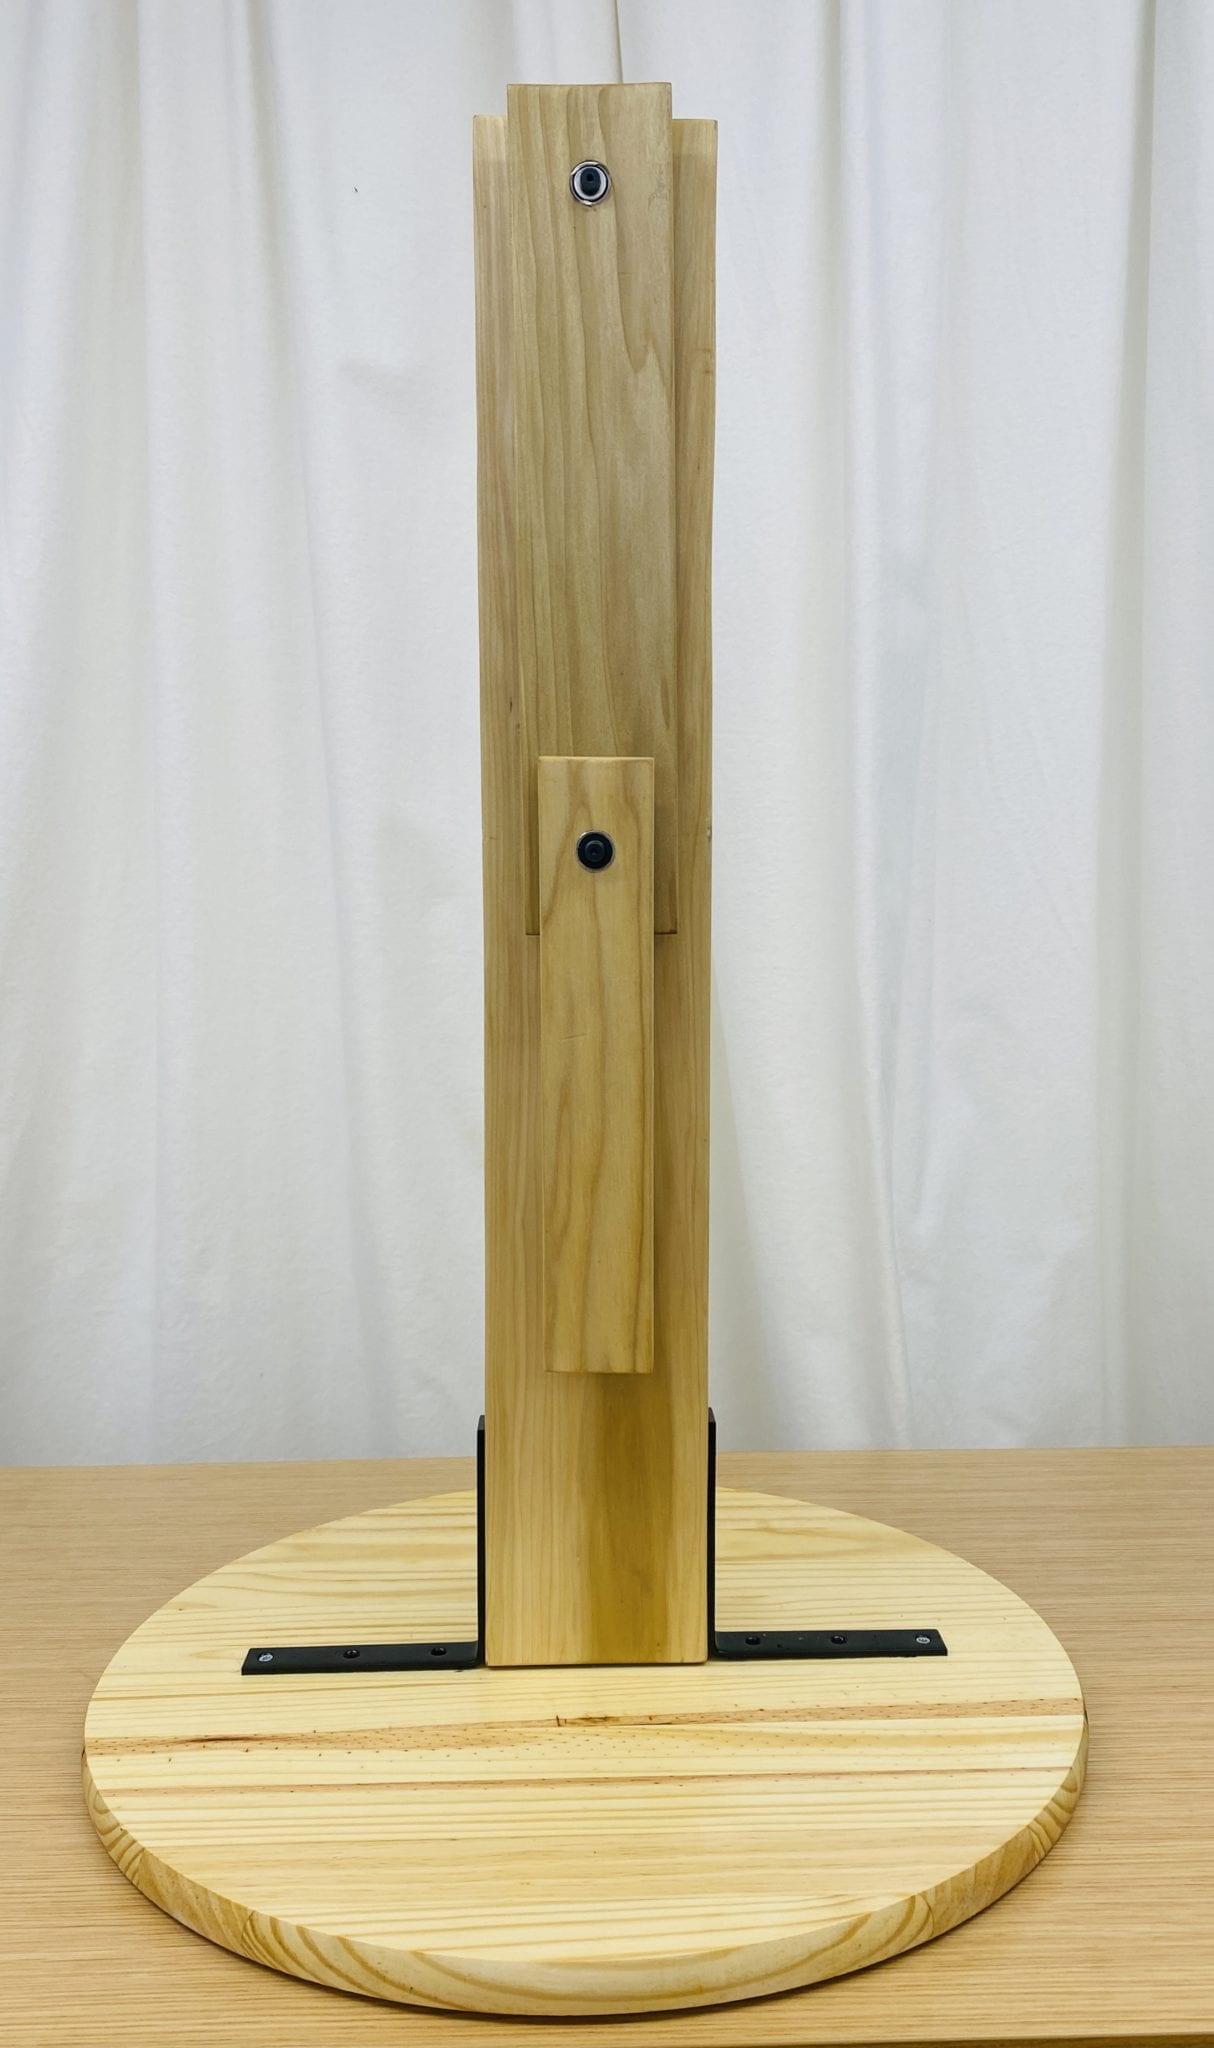
double pendulum construction

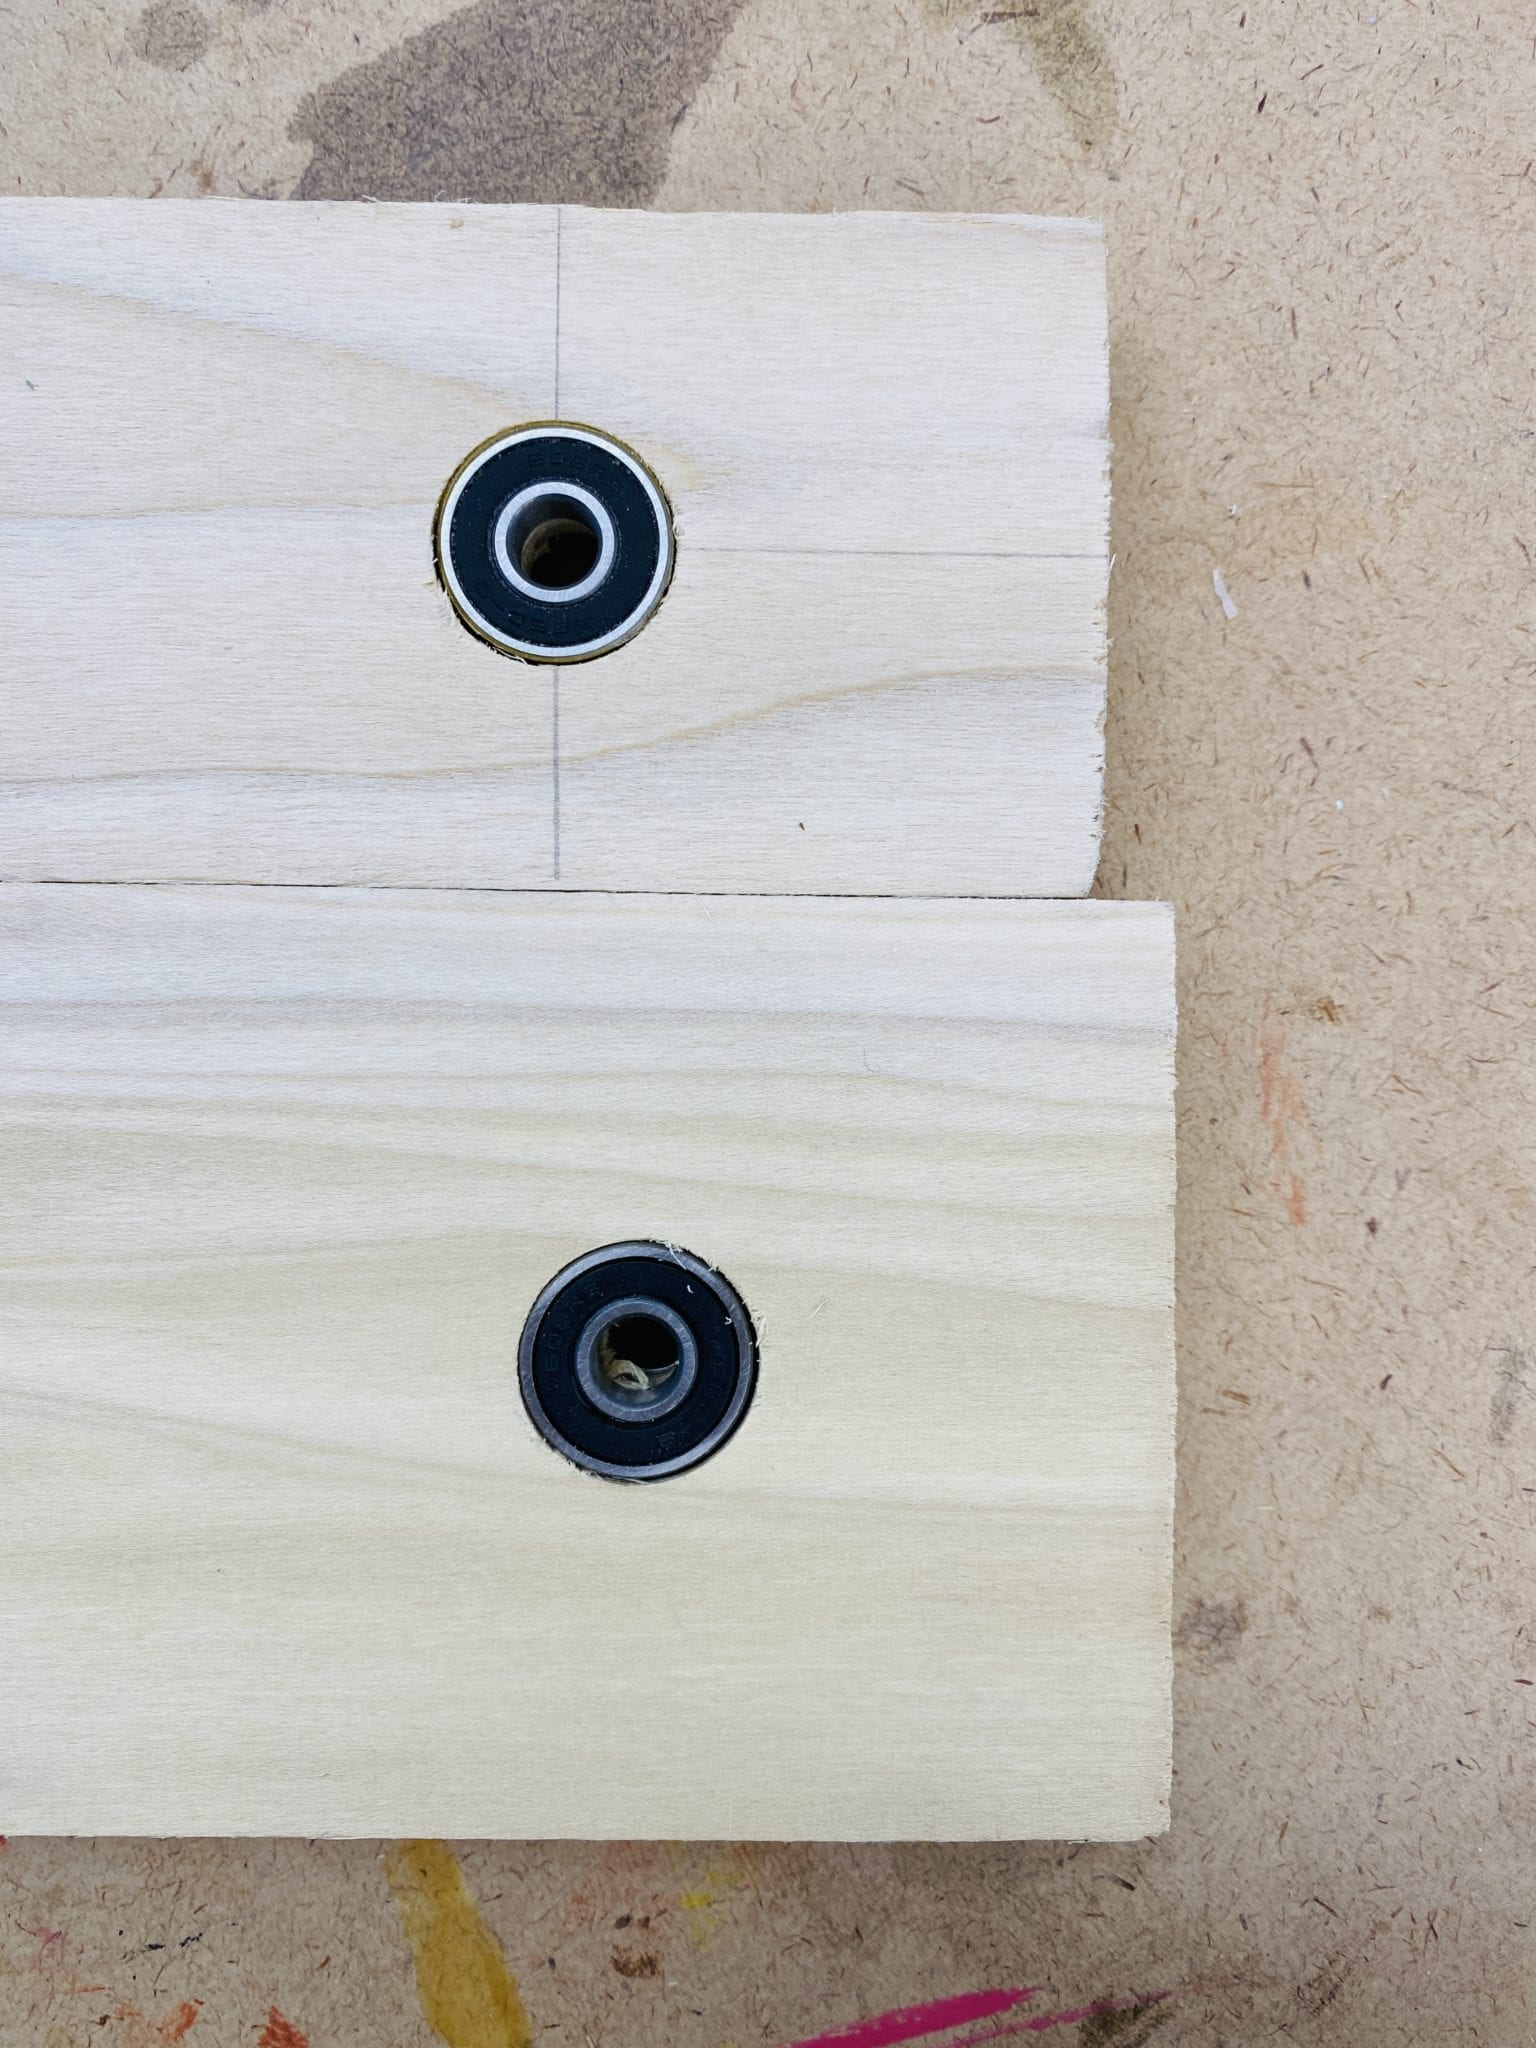
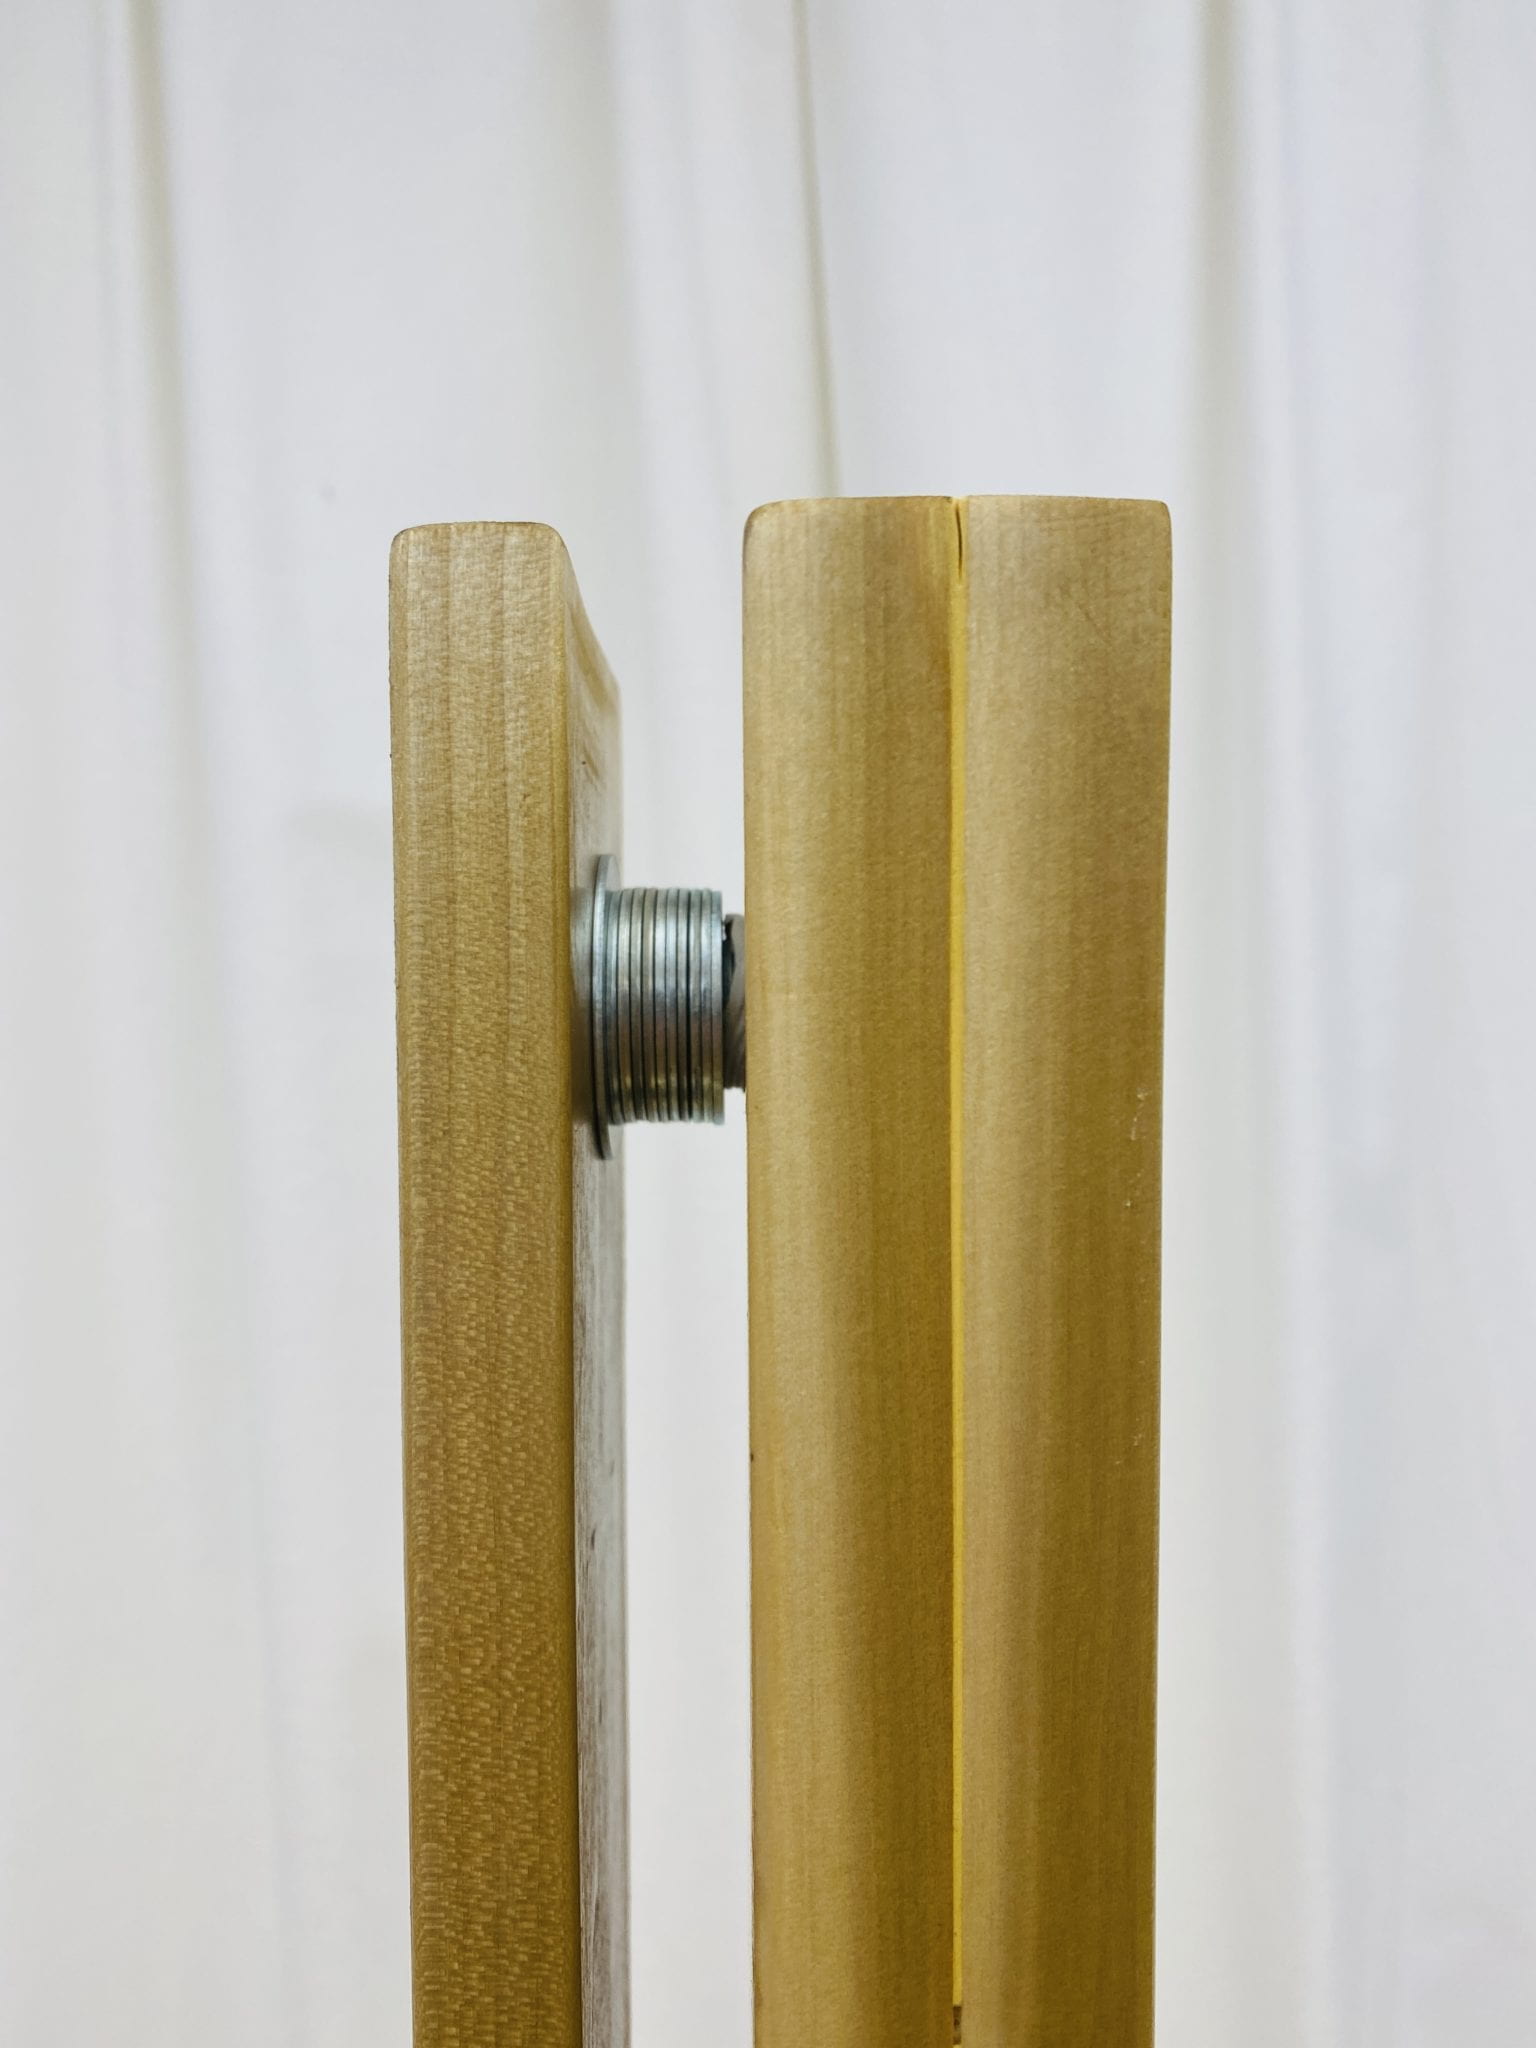
After building a full-scale finished piece, we discovered a flaw in our design. We needed more bearings to reduce friction, a tighter fit for our bearings so they wouldn’t shift while rotating, and finally, we needed to install shoulder bolts instead of regular bolts to reduce friction again. 

double pendulum construction

The second round of construction more bearings and a more precise fit. 

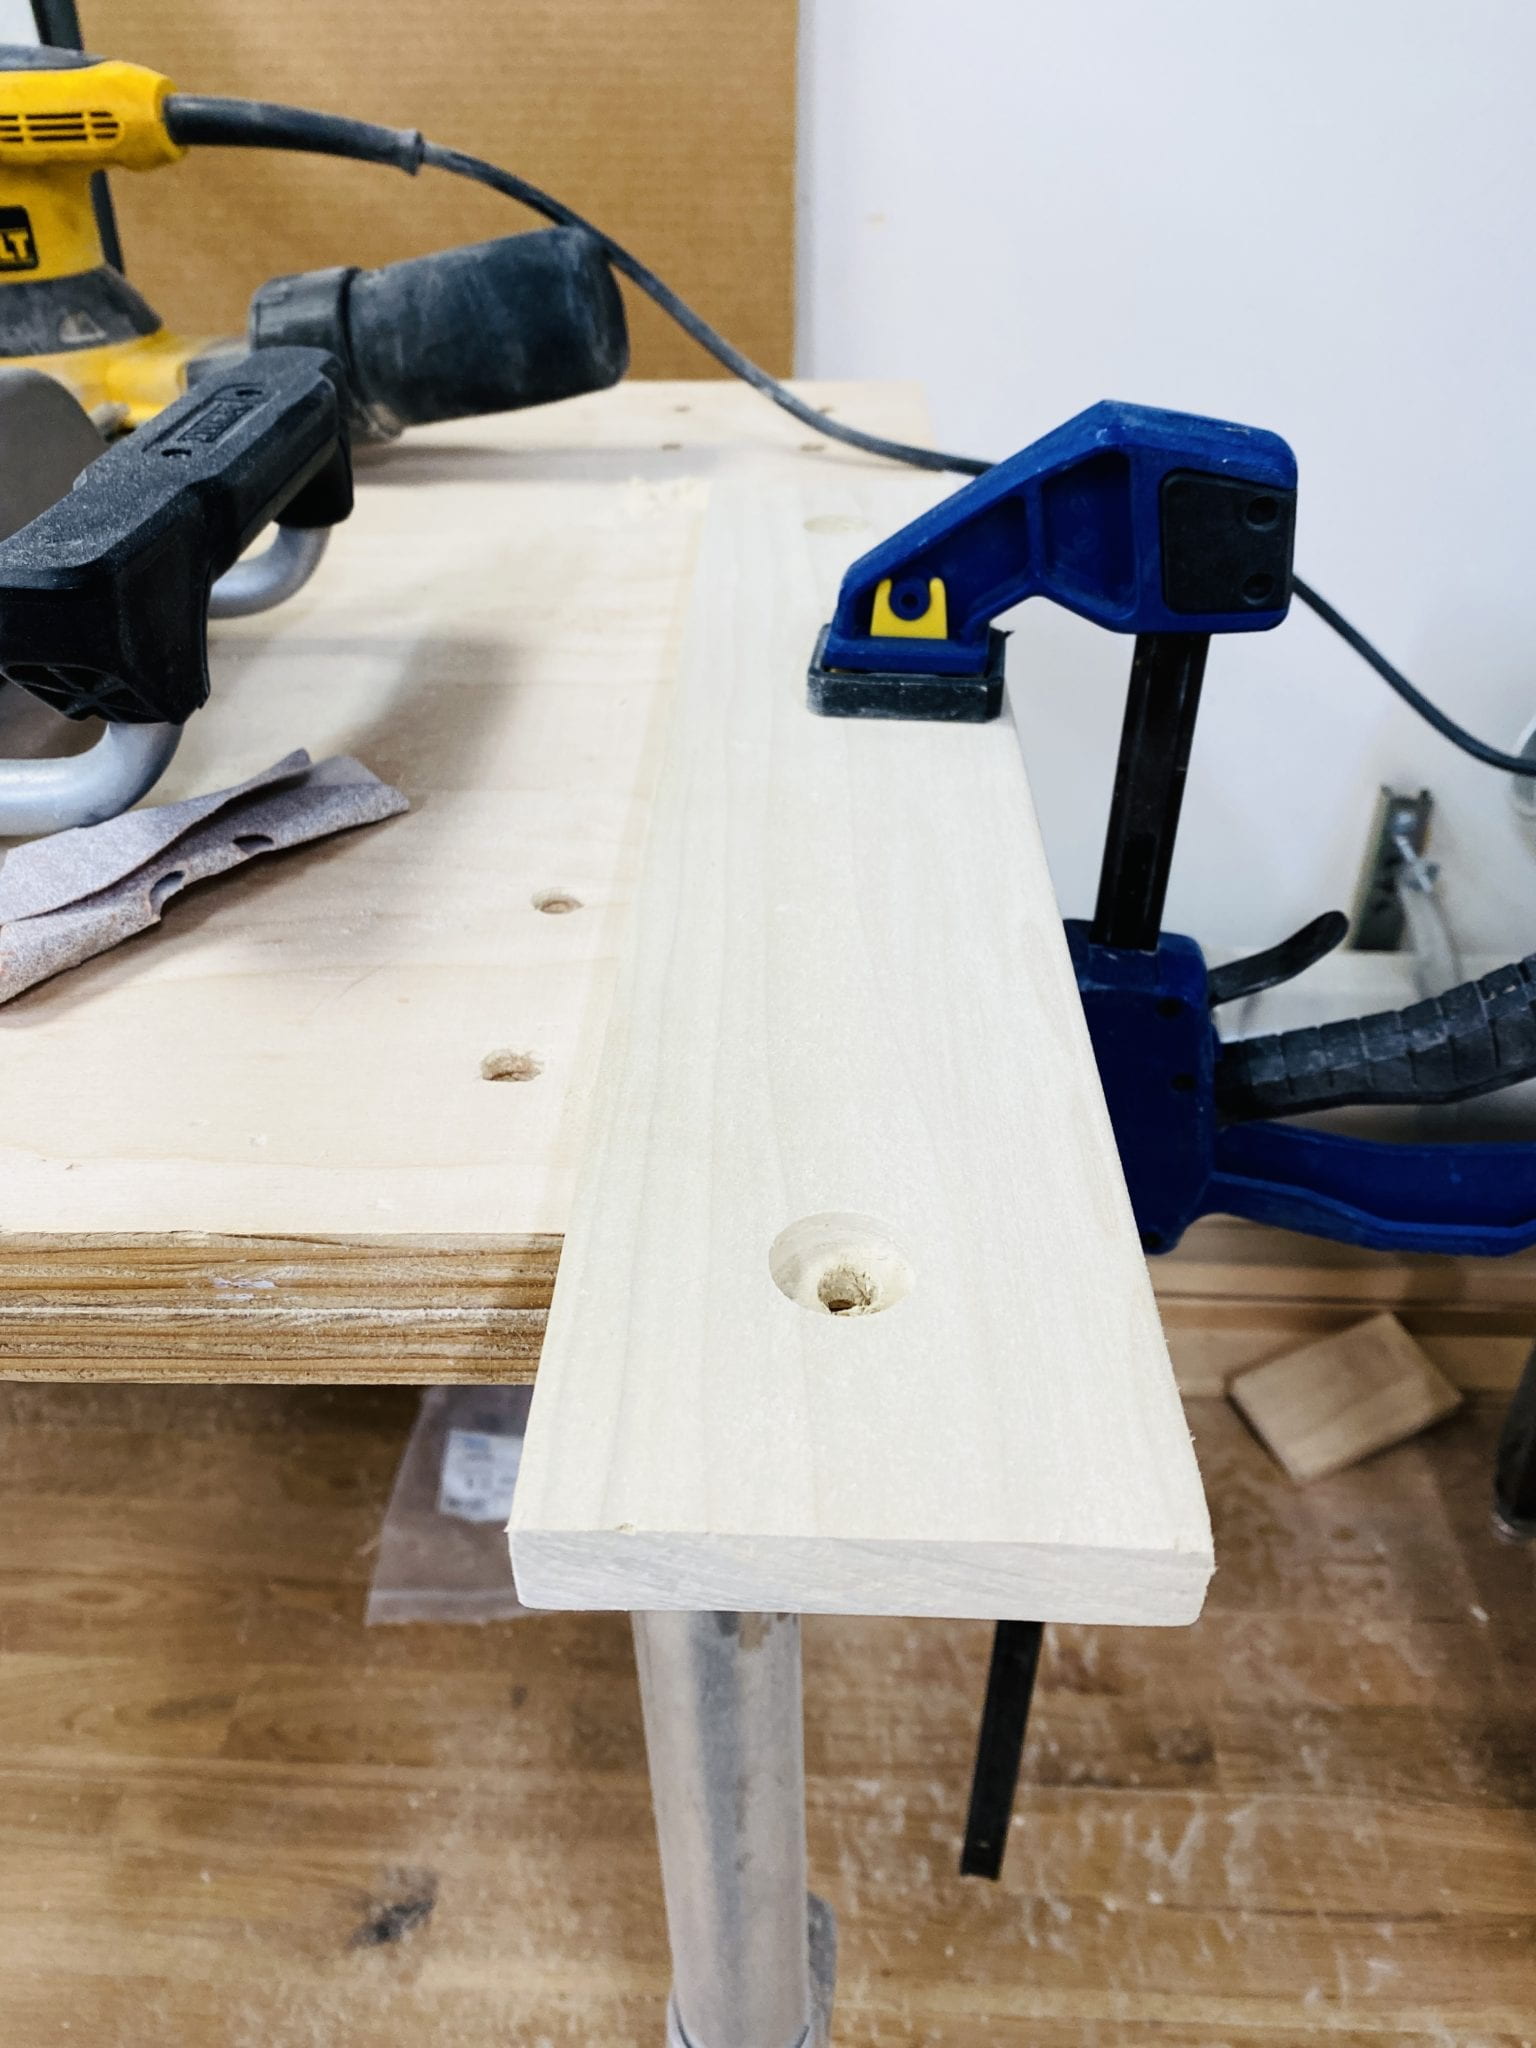
Finishing work. 

double pendulum construction
Finishing work II. 

Final Piece:

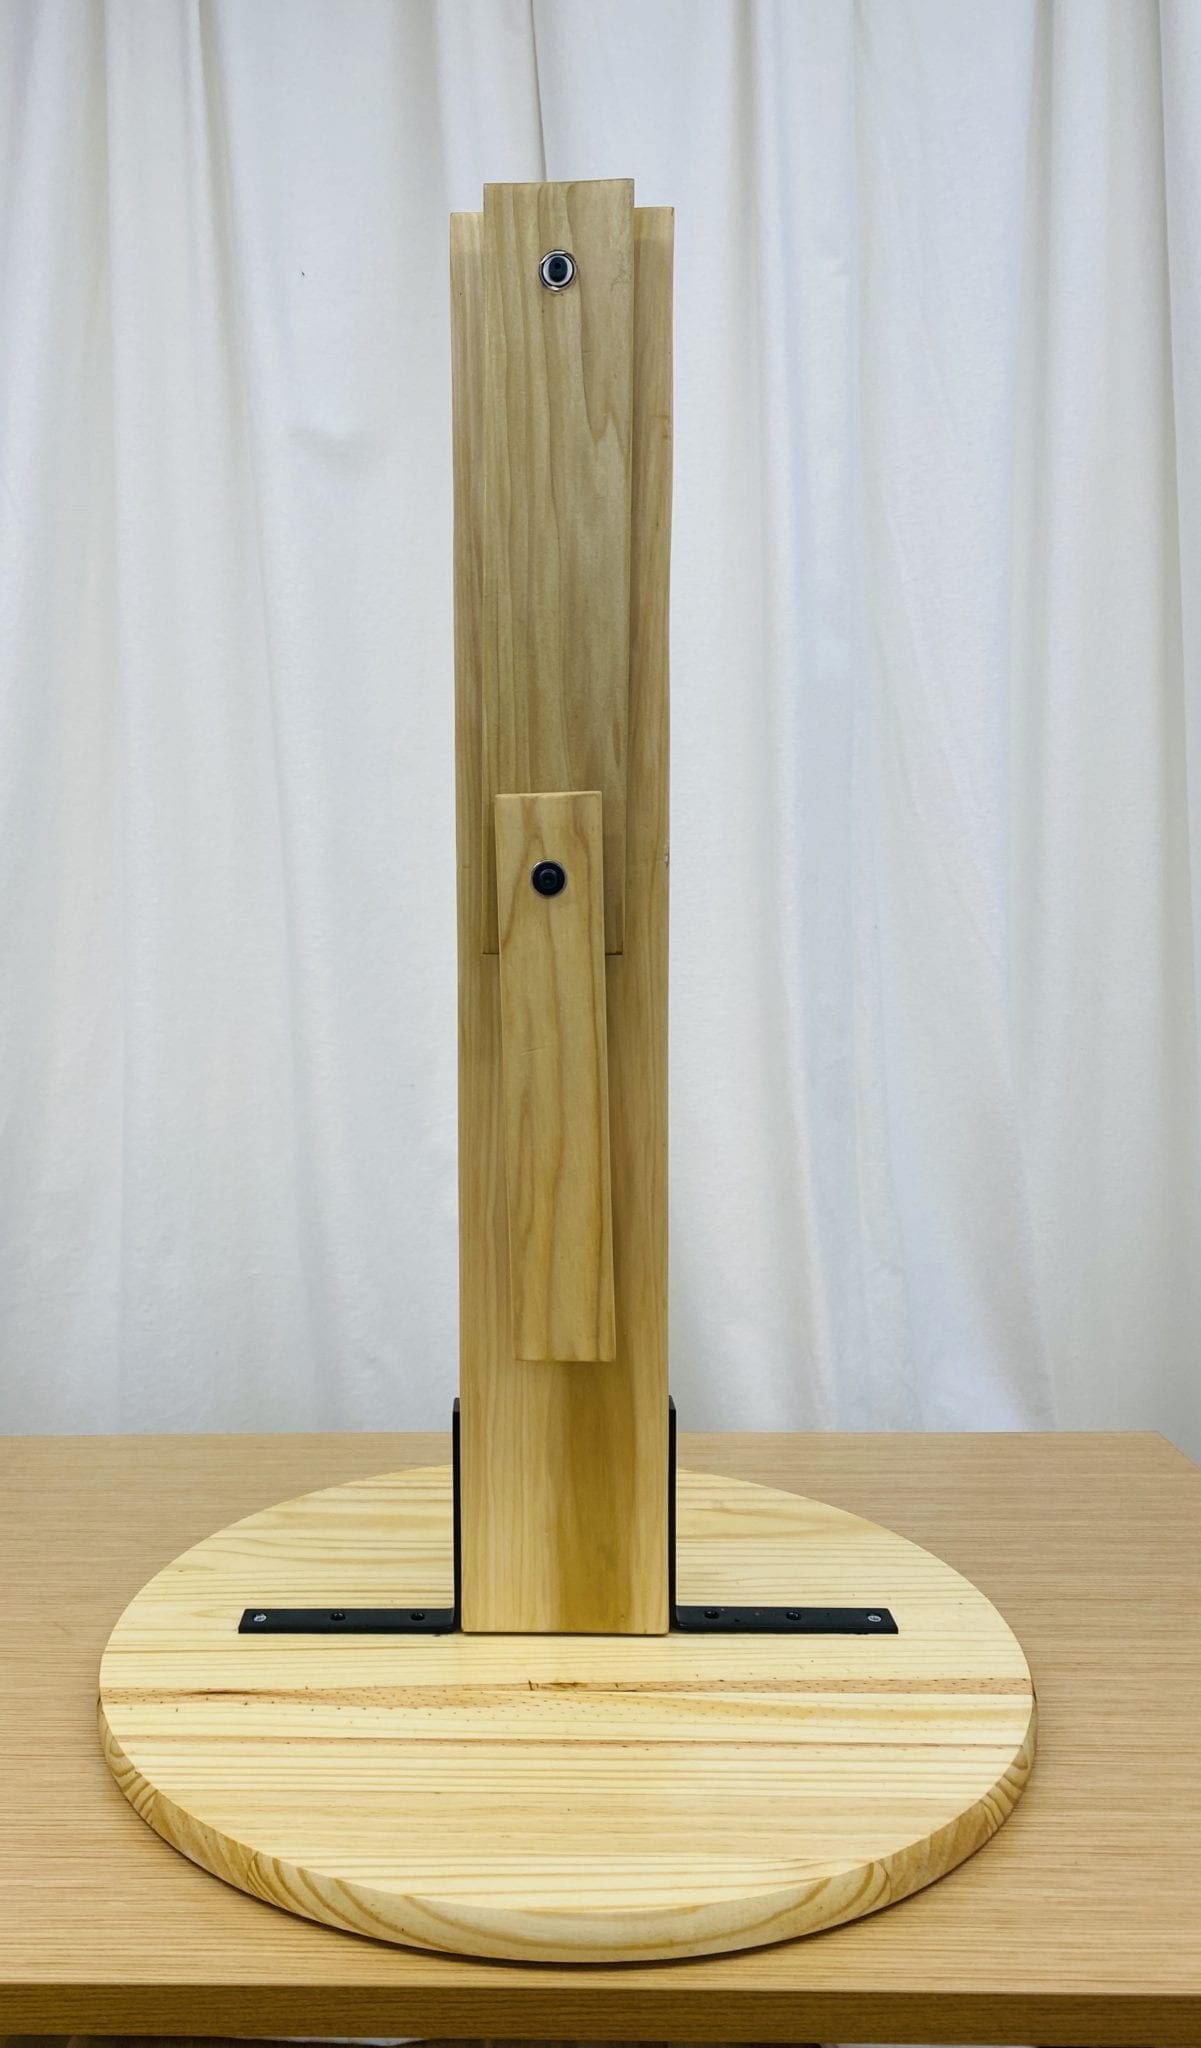
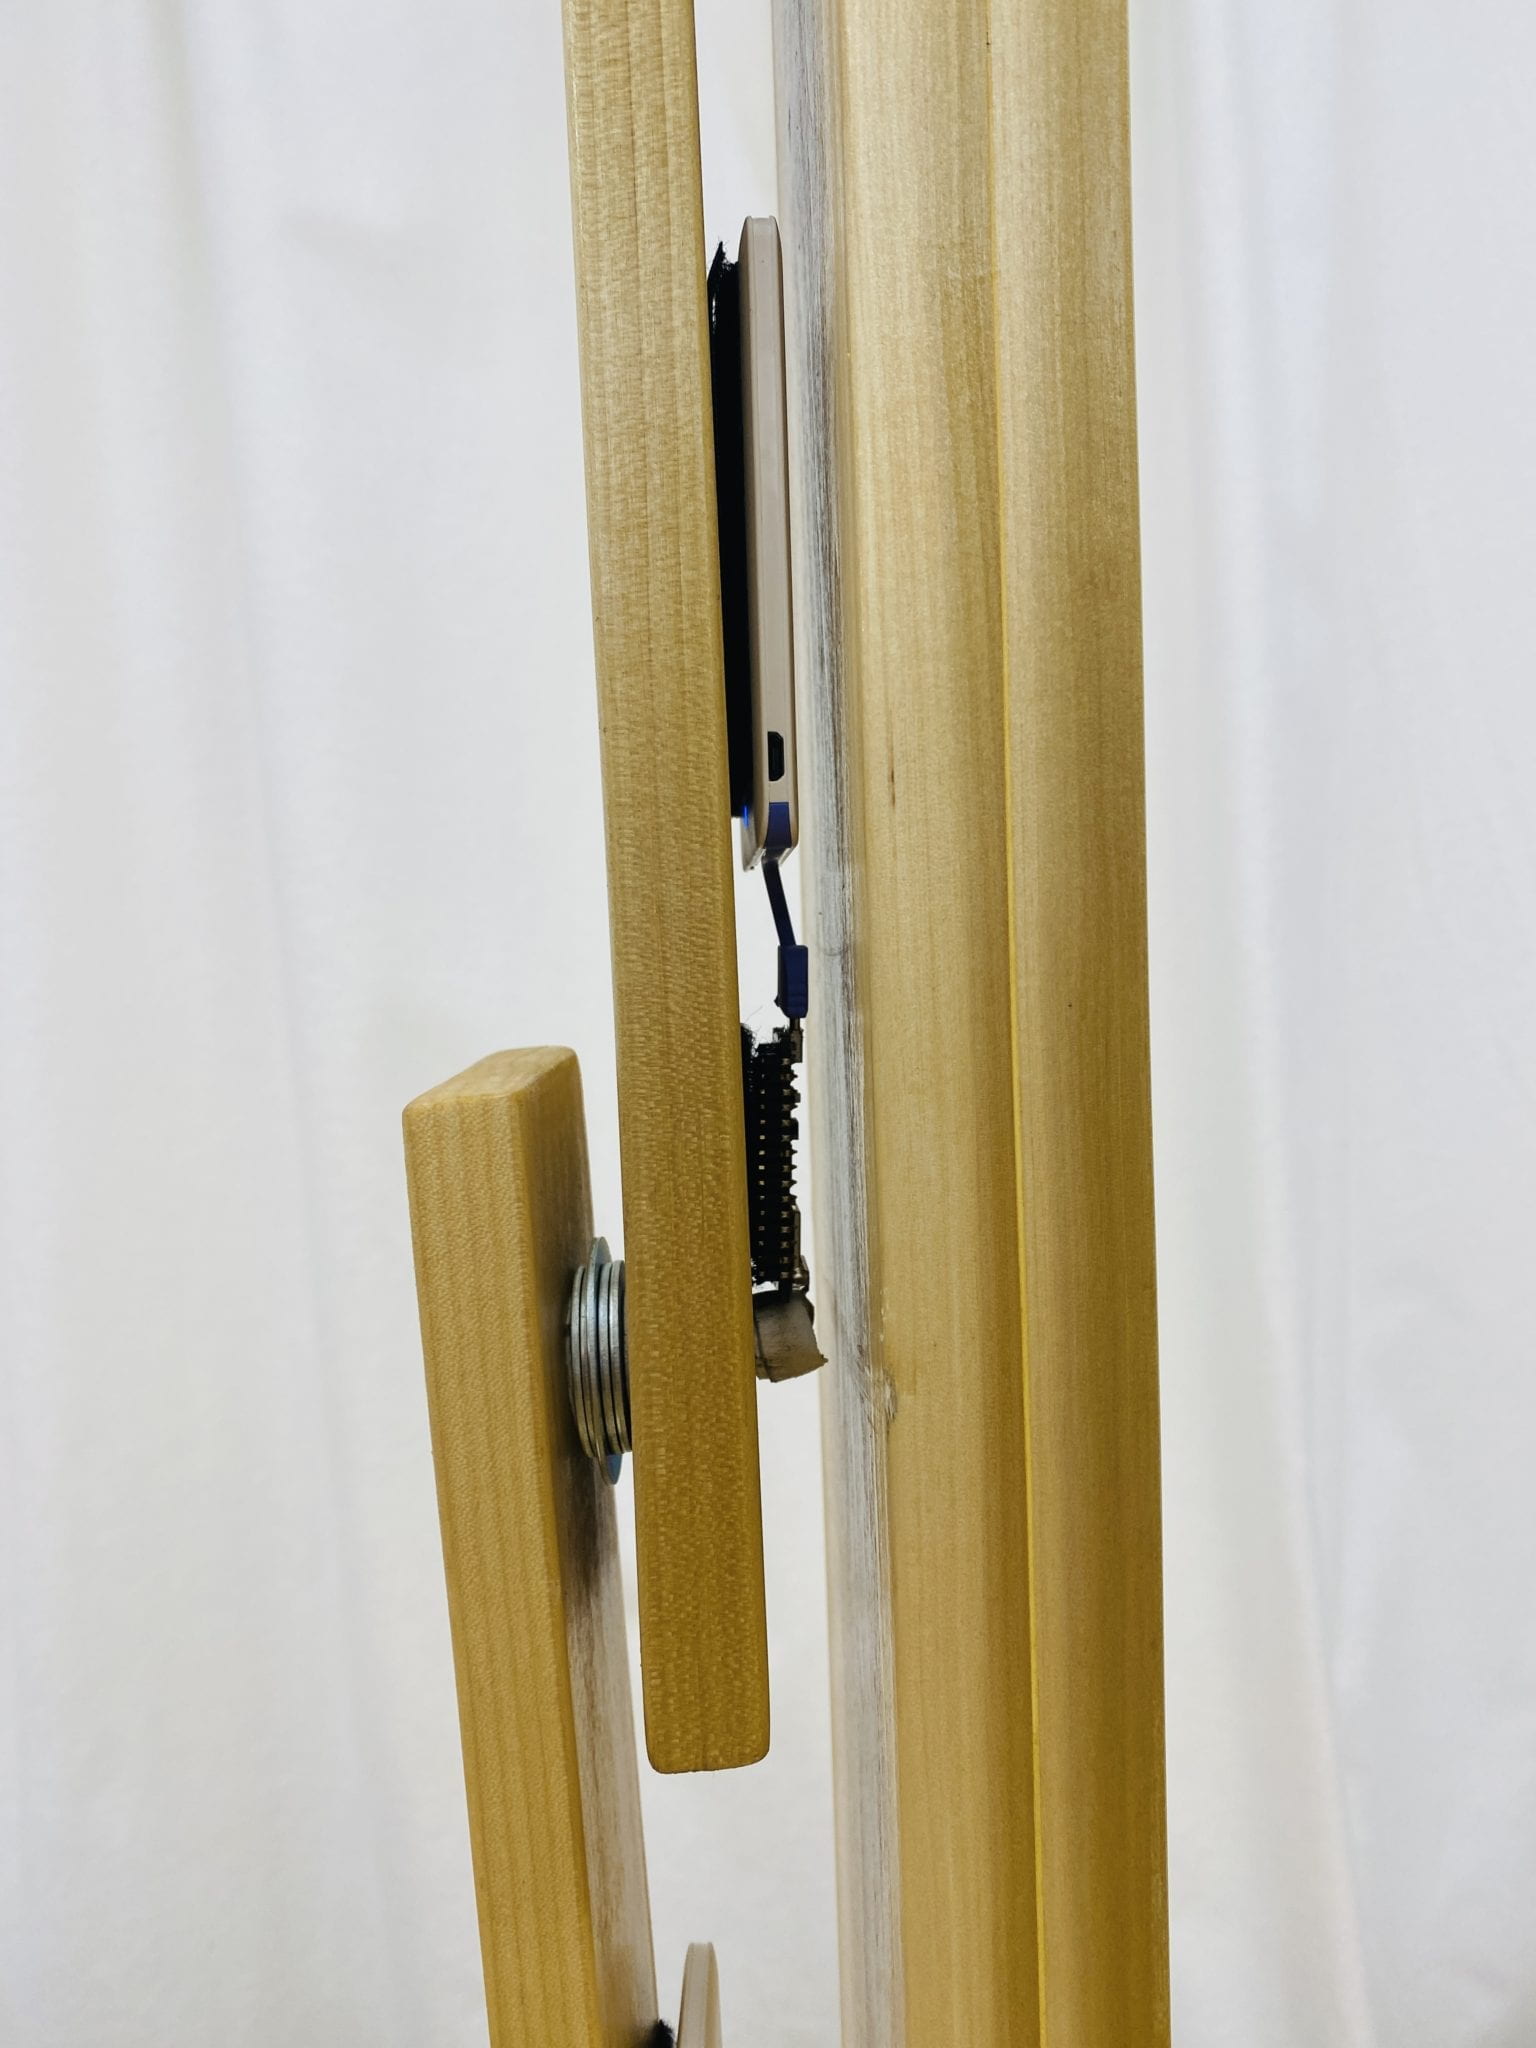
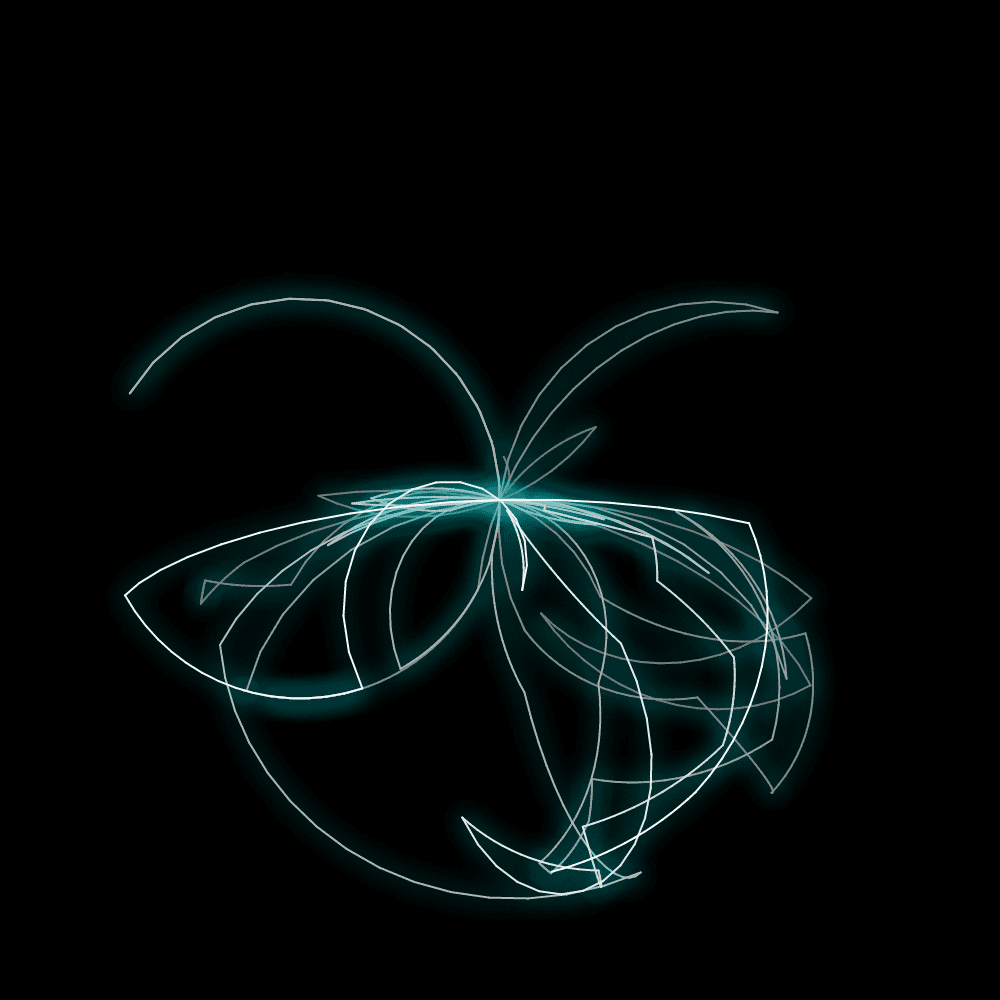
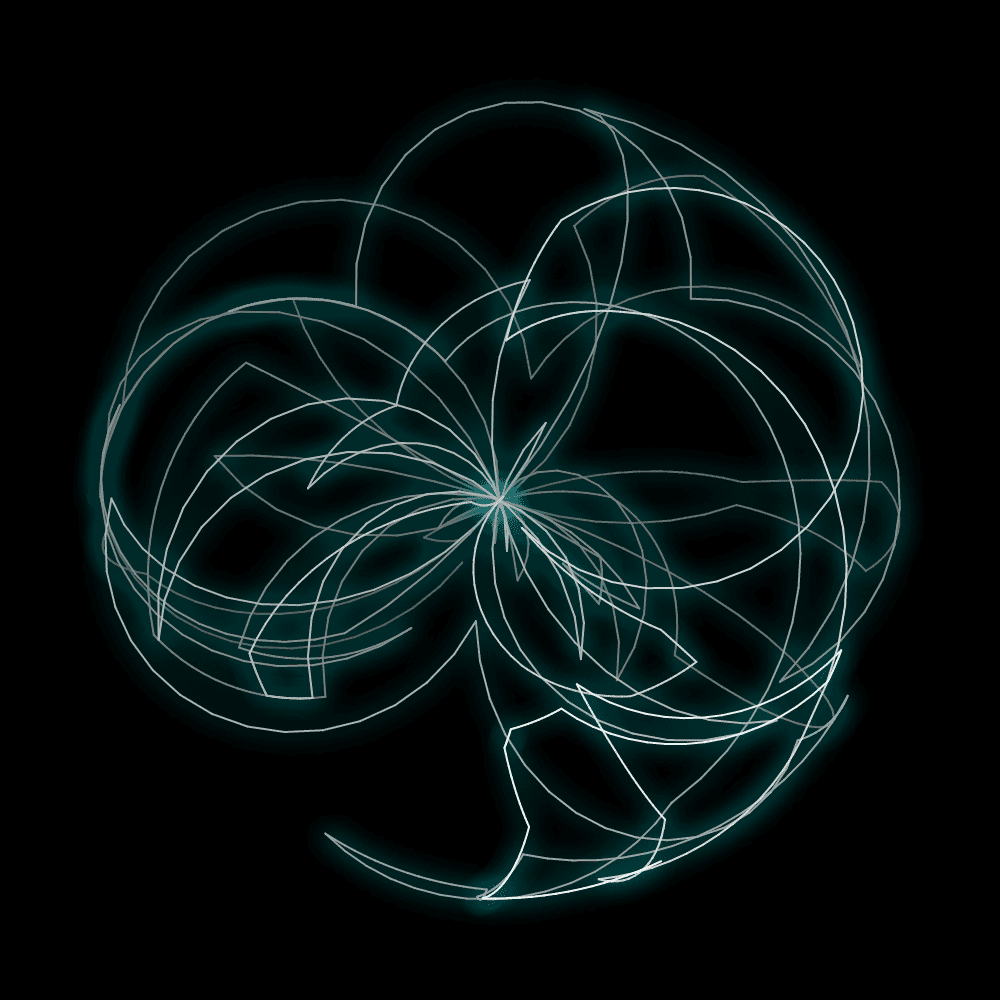
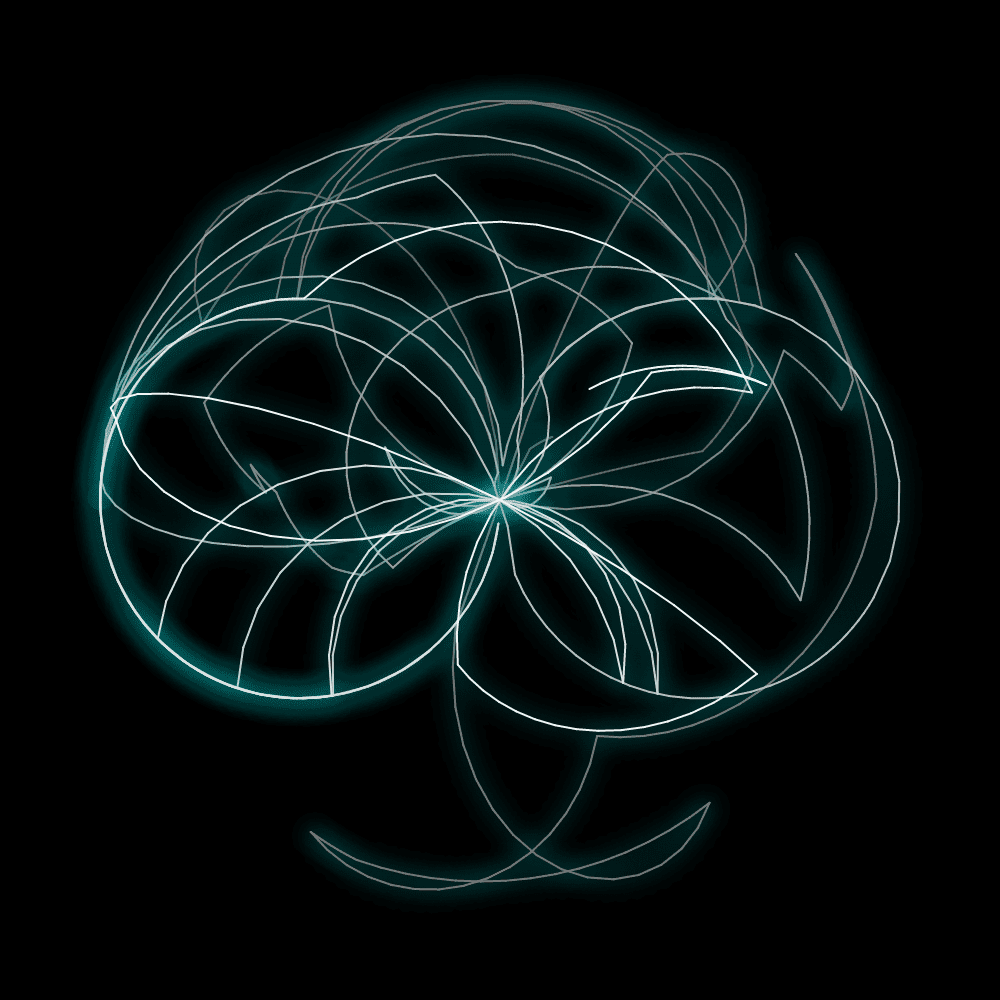
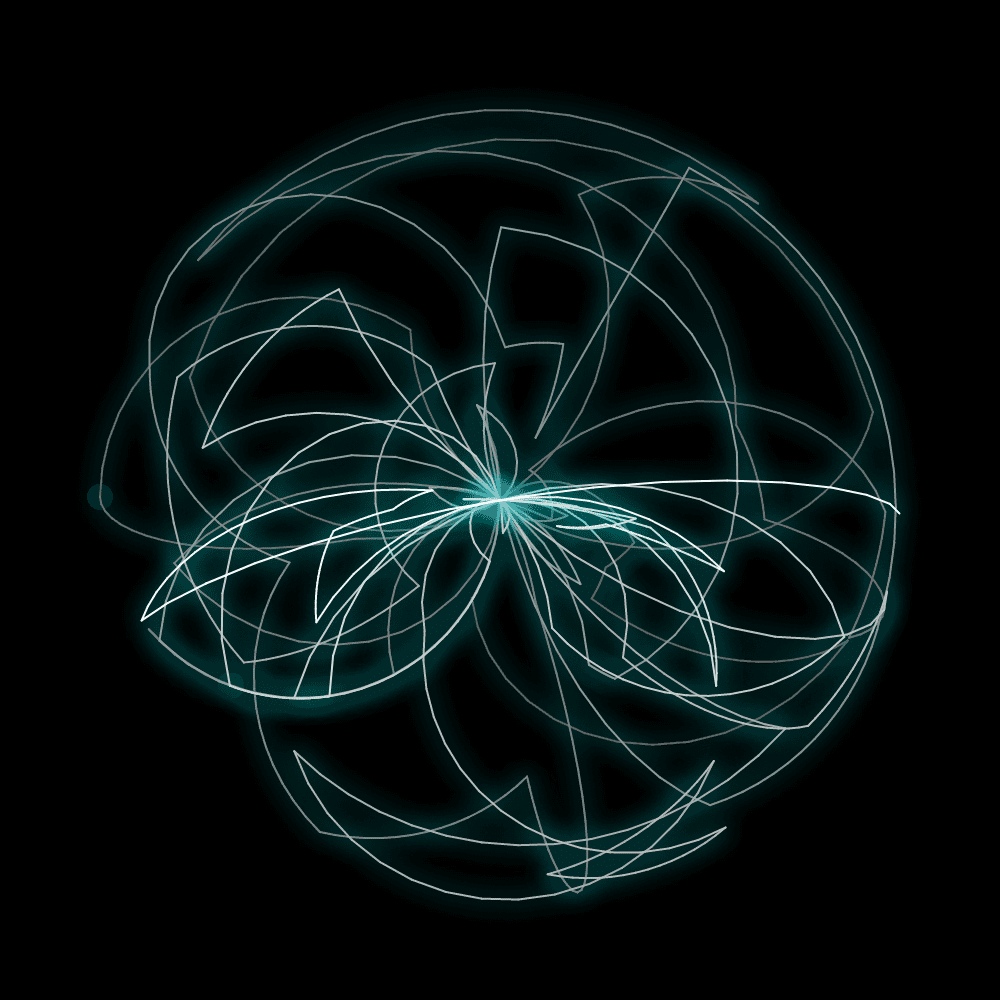
The final piece has a battery-powered Arduino attached to each arm of freedom. The Arduino uses an accelerometer to detect orientation and sends the information via Bluetooth to our site, presenting the viewer with their own chaotic system drawing. The viewer can capture the drawing on their phone via a QR code that pops up. 


Double Pendulum

Double Pendulum

Double Pendulum

Drawing Examples: 

Chaotic drawing

Chaotic drawing

Chaotic drawing

Chaotic drawing

Activation 2: Tipping Point

Our goal is to demonstrate the seriousness of tipping points. Once you reach any of these thresholds, the system can be pushed into an entirely new and potentially irreversible state.

This activation is a carnival-influenced web game similar to High Striker, where the player uses frantic button pressing against a difficult system to score points. The game can be played here

Game describing tipping point in climate science.


PCOMP Final


For my PCOMP final, I decided to combine a few of my favorite things, data visualization, and surfing. My goal was to measure my acceleration on a wave, graph the data, and present it in a physical form. 

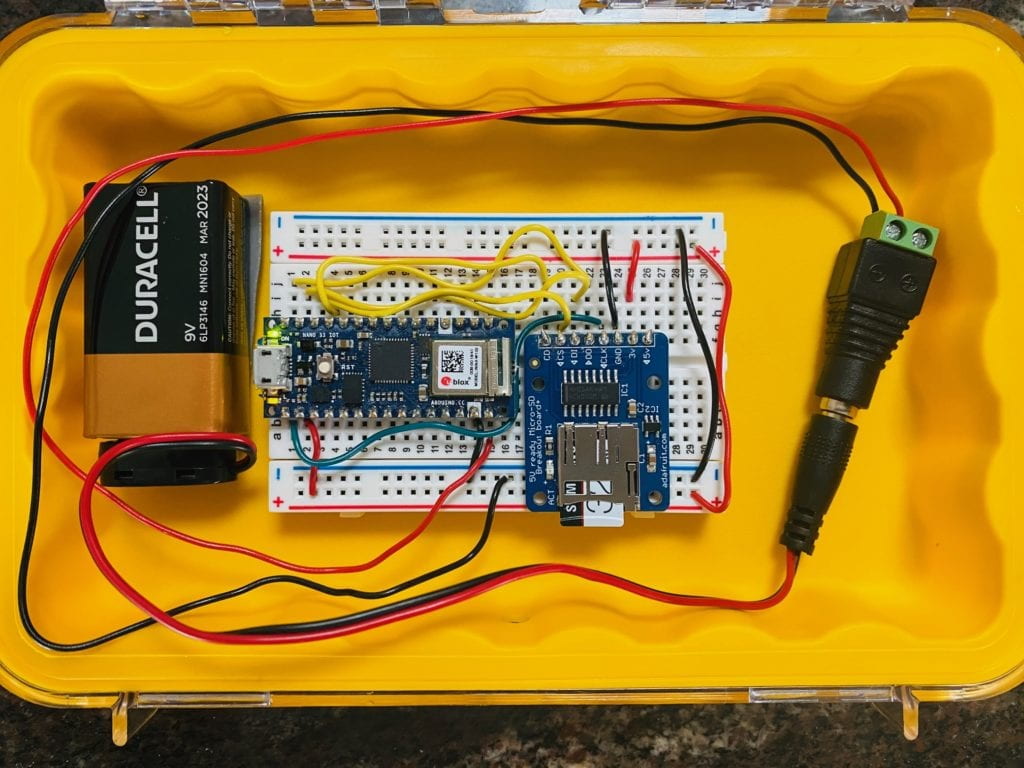
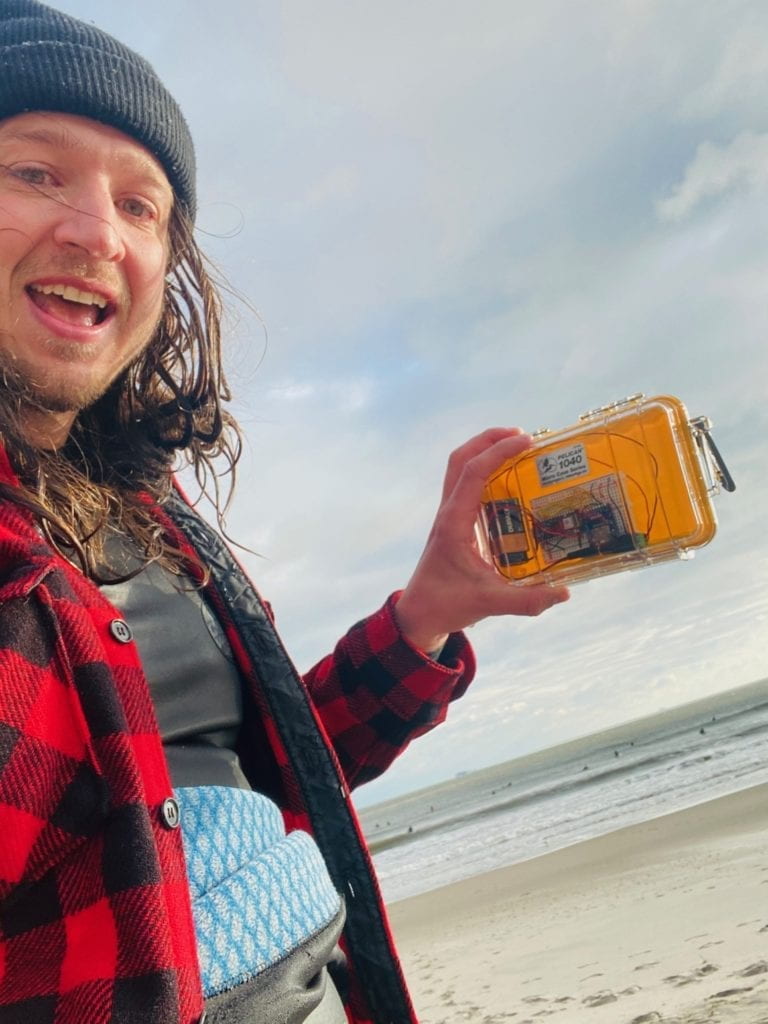
The first step was to get the circuitry up and running on dry land before taking it out in the water. This didn’t prove easy because I couldn’t get the SD card reader to link up with my Arduino Nano 33 IoT. After spending just under a week working on the problem and going to office hours, I decided to try a new board—Sarah Ro to the rescue with a board that worked immediately with the same wiring. I still have no idea if the original boards were faulty or I was doing something wrong, but that’s a problem to figure out over break. With the board up and running, I put my setup in a waterproof housing and got it down to the beach. 

It was a cold December afternoon, but I was determined to get out in the water and test it out. I couldn’t find a way to mount the device to my board successfully, so I decided to put it inside my wetsuit. With everything all set, I paddled out, hoping that the case was waterproof, the circuit would keep working in the rough water, and it was recording data. 

*I got a lot of weird looks with a rectangle shape on my back. 

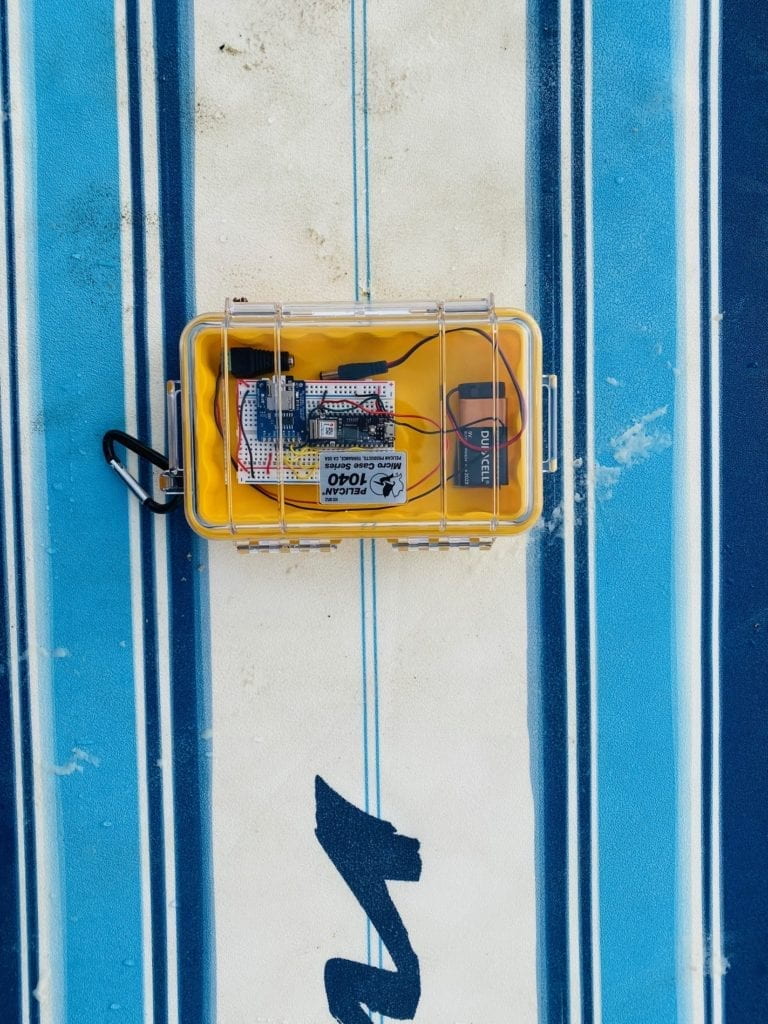
Surfboard and Arduino

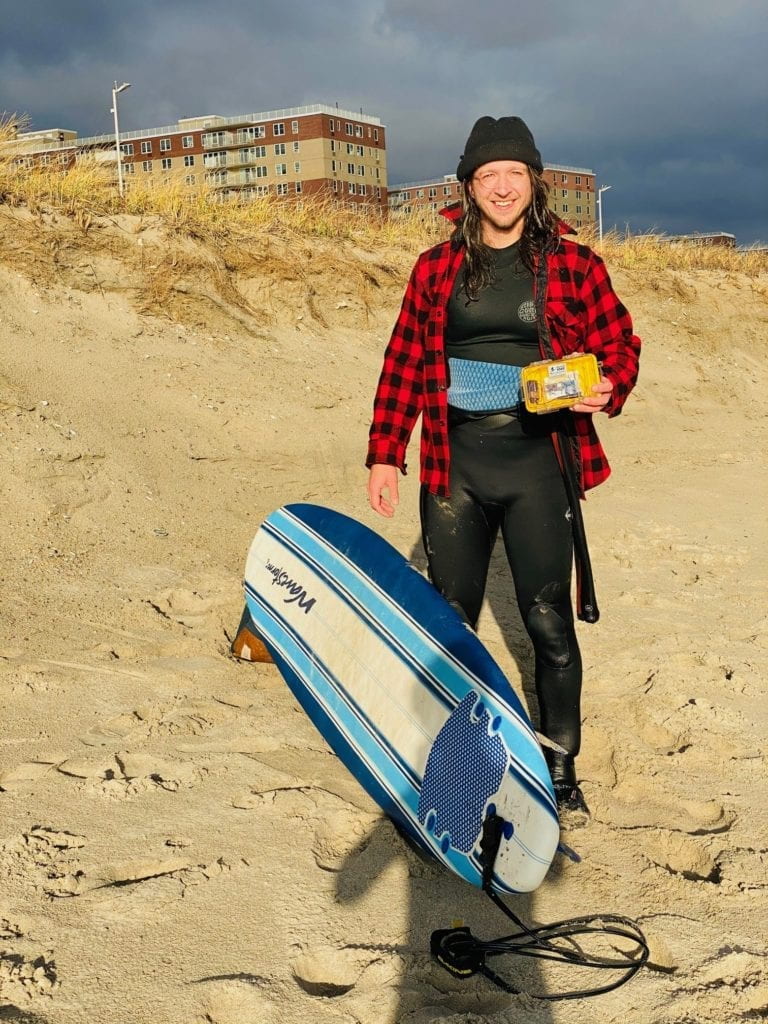
Just under an hour, I paddled back in the cold and hoping for the best. To my surprise, everything was still working. The glue came undone, and the board was rattling around, so I need to address that later. 

Surf Board Installation

My excitement caught the attention of some strangers on the beach who took my photo after explaining what I was doing. 


Surf Board Installation

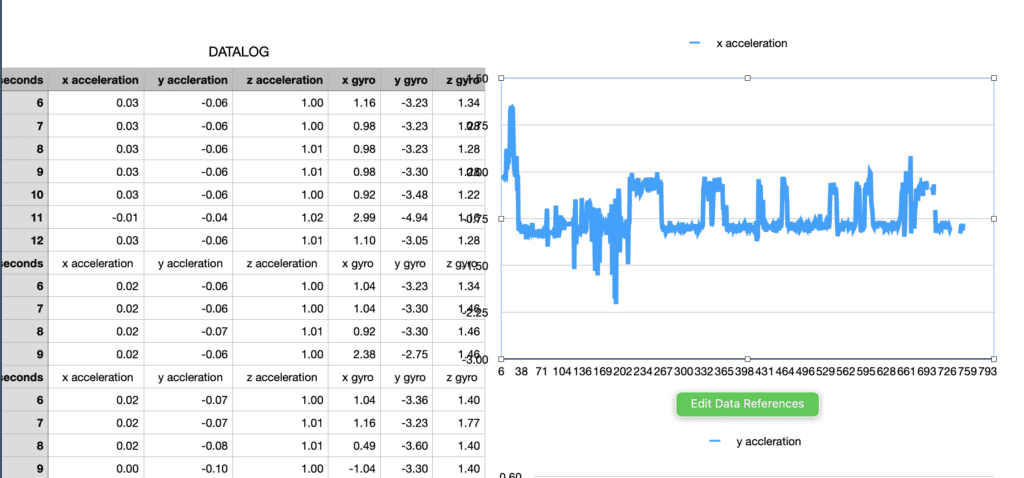
Back home, I was able to upload and explore the data, which all came through!

Data Sheet 1

Data Sheet 2

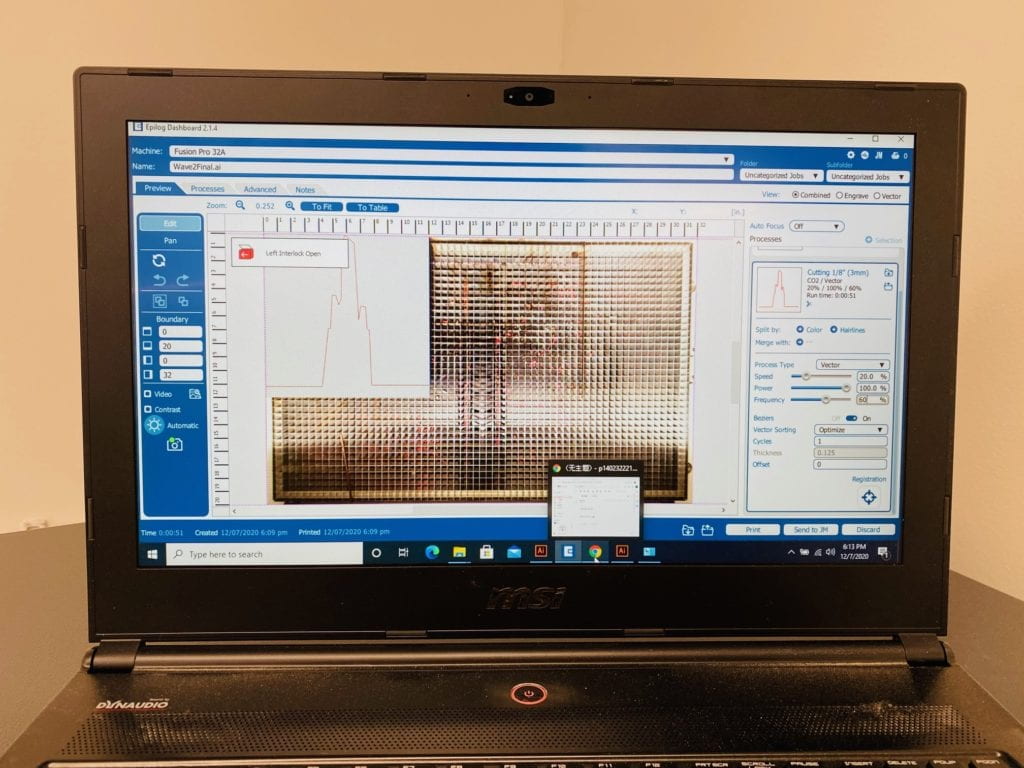
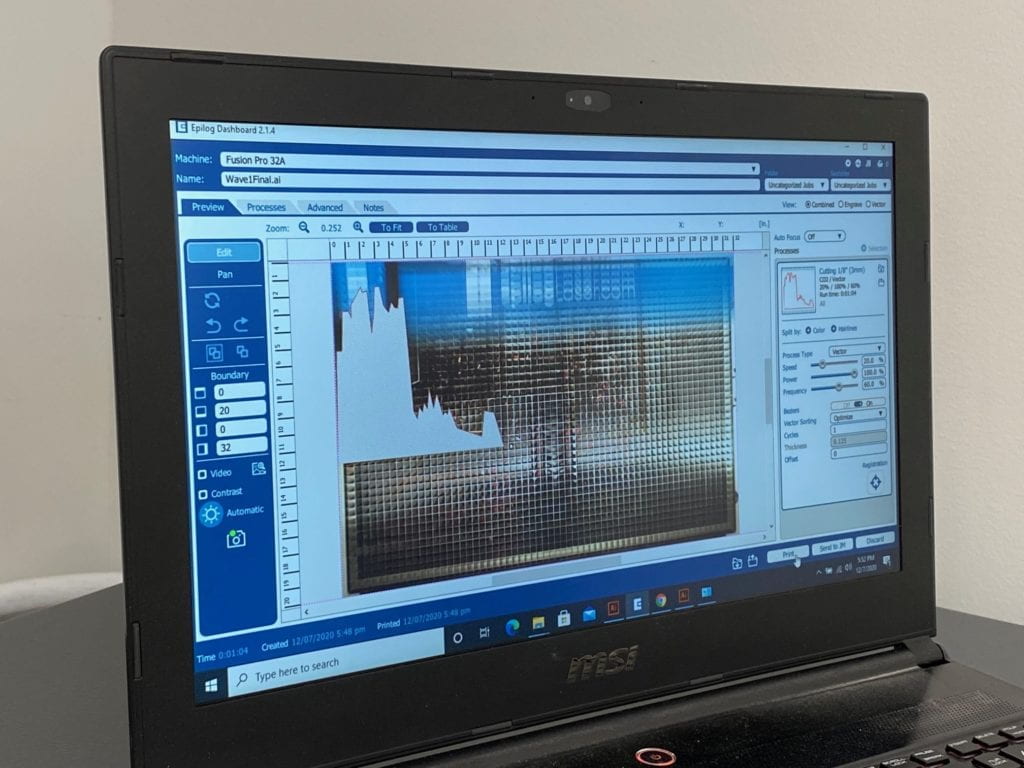
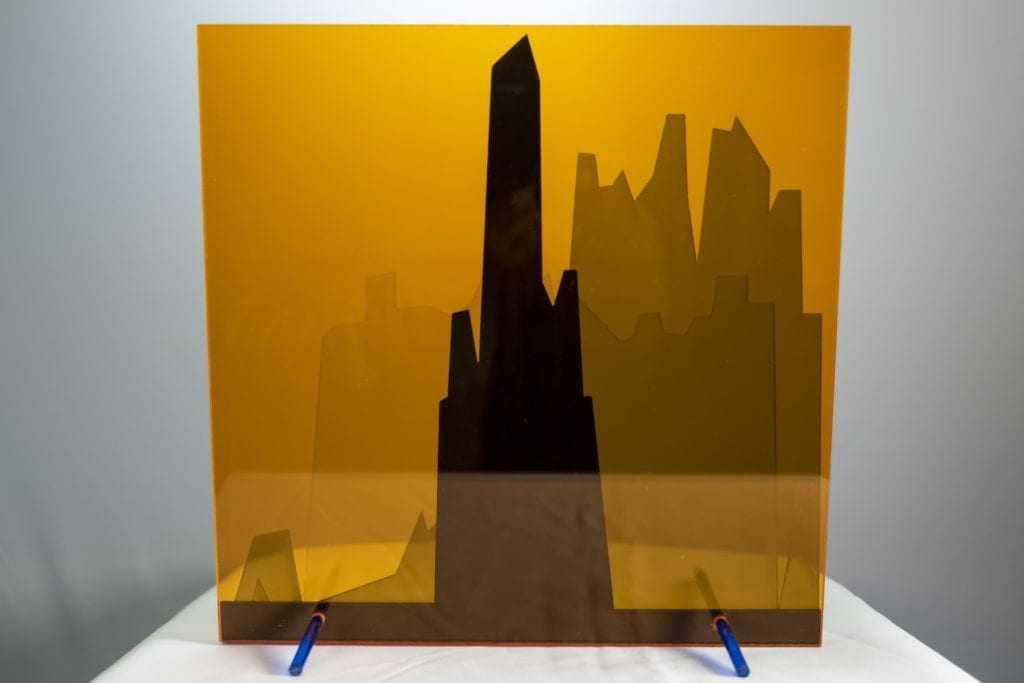
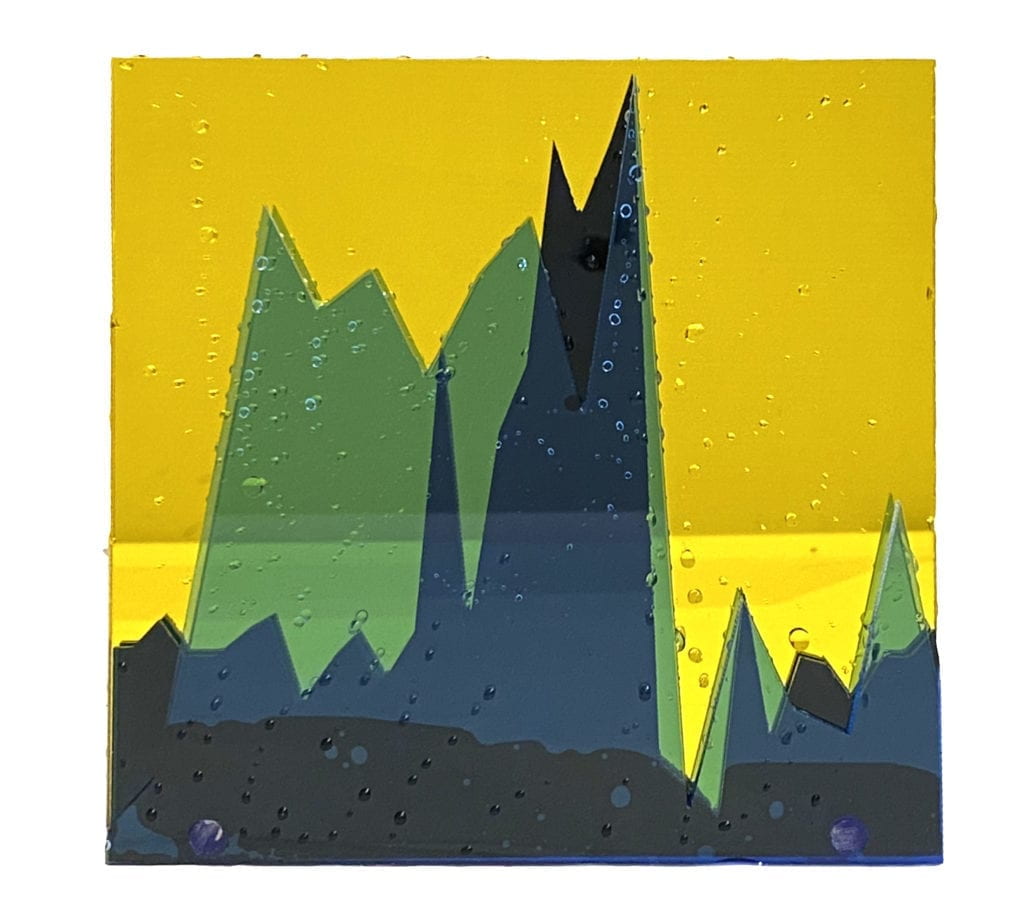
The next step was to make a physical product of the data. In illustrator, I used the Pen Tool to make a path of three waves that I rode in the session. I then put each wave on its own blue acrylic plastic piece and cut them in the laser cutter. 


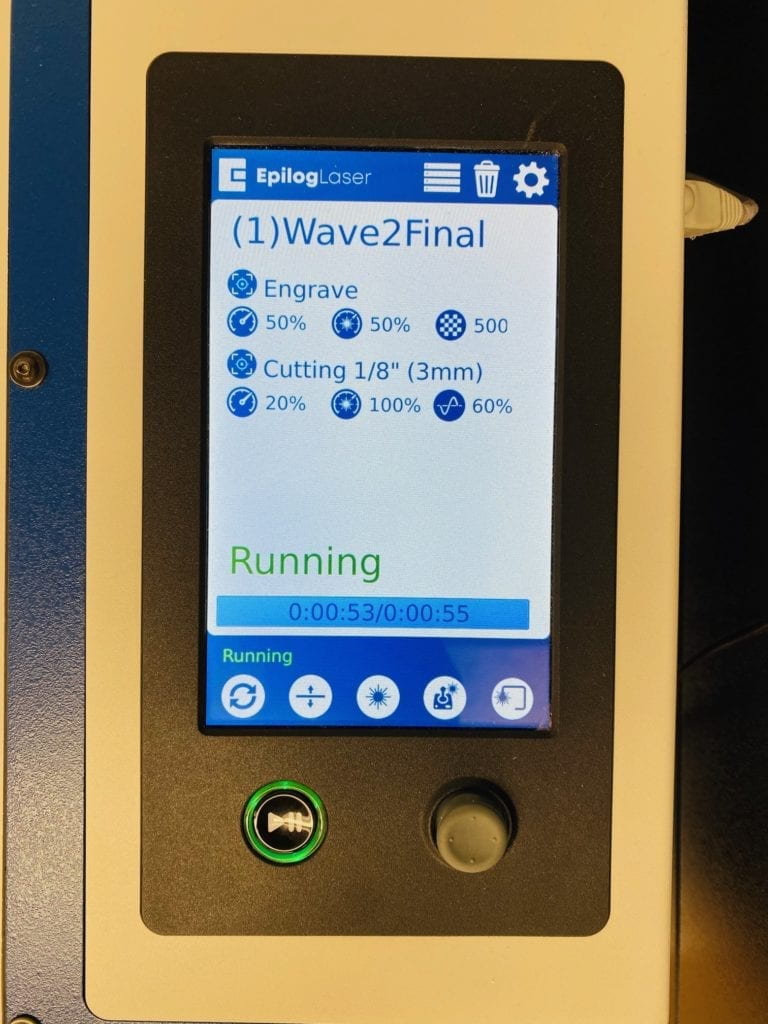
Laser Cutter Screen

Laser Cutter Screen

Laser Cutter Screen

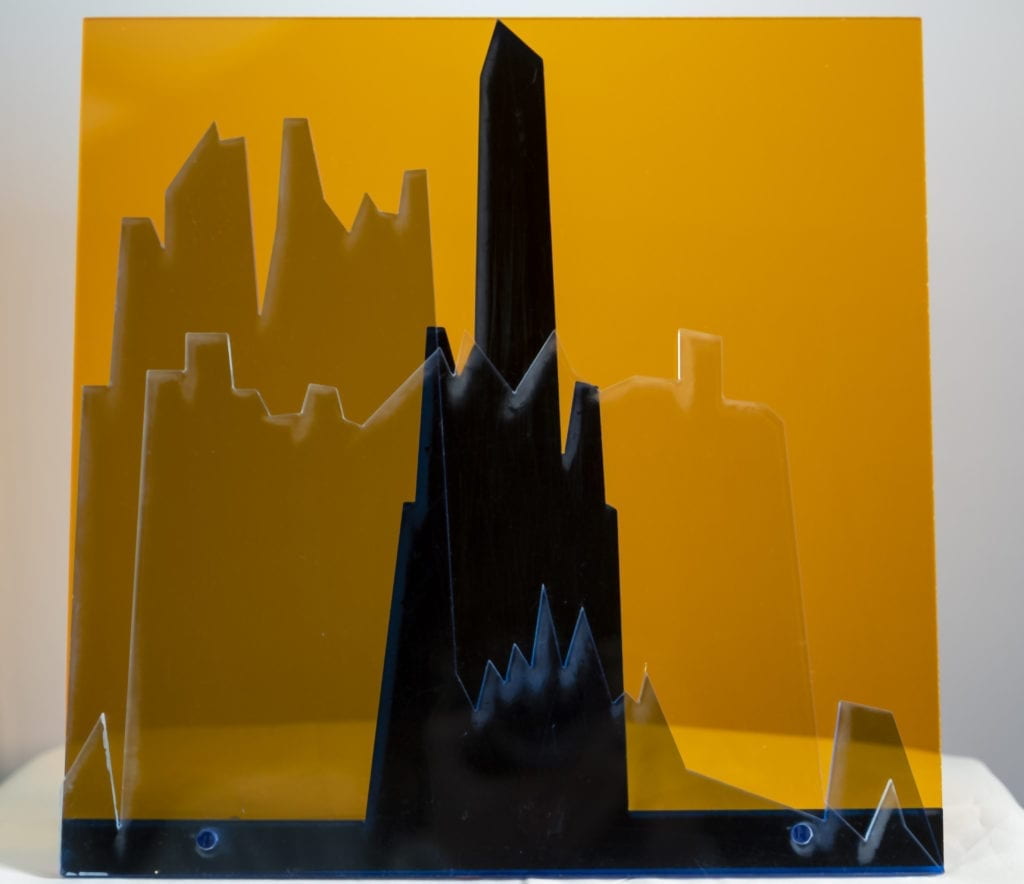
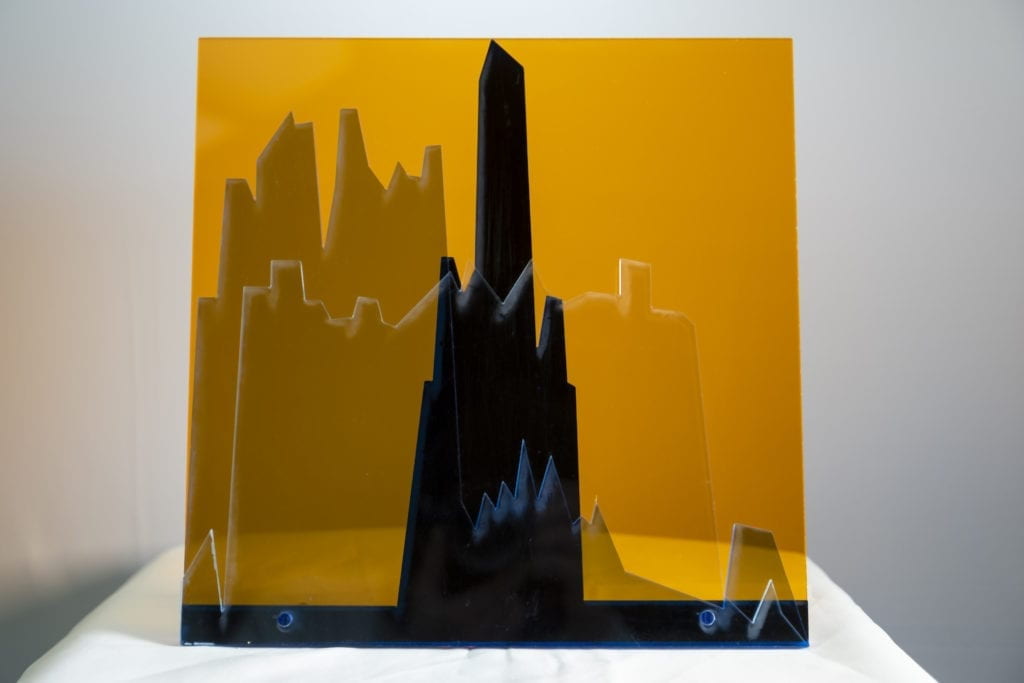
For the final construction, I layered the three-wave diagrams on top of each other and all three on orange backing. 

Final Laser Cut Piece

I laser cut a .23 diameter hole through the pieces and pressed an acyclic dowel in to hold the piece together.

Final Laser Cut Piece

The acrylic dowel was 4 inches long and also acted as a stand for the piece. 

Final Laser Cut Piece

Final Laser Cut Piece

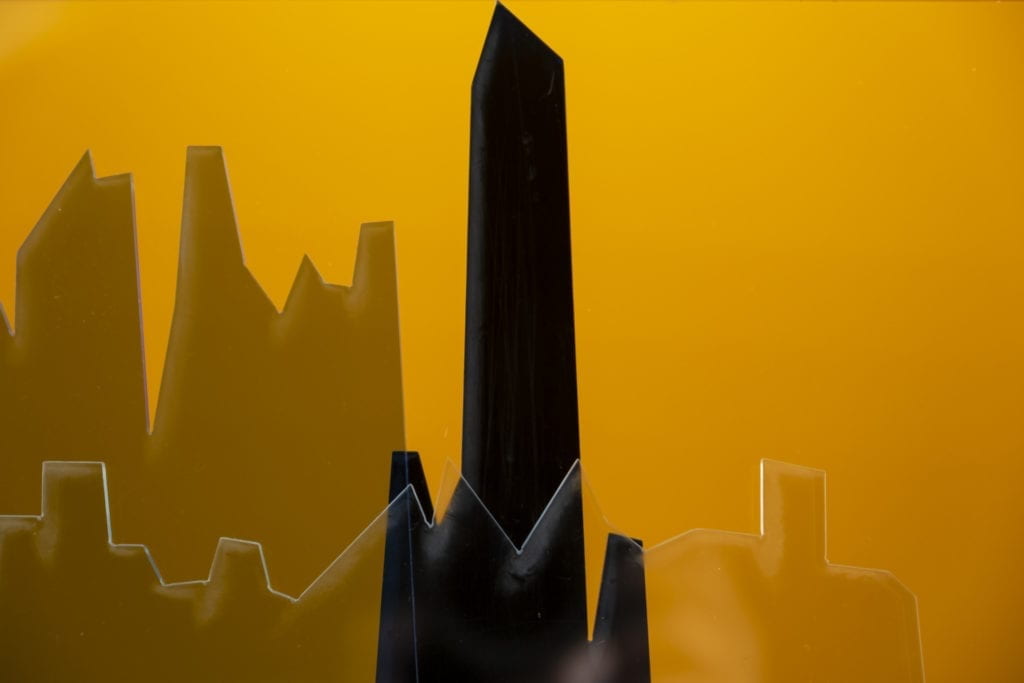
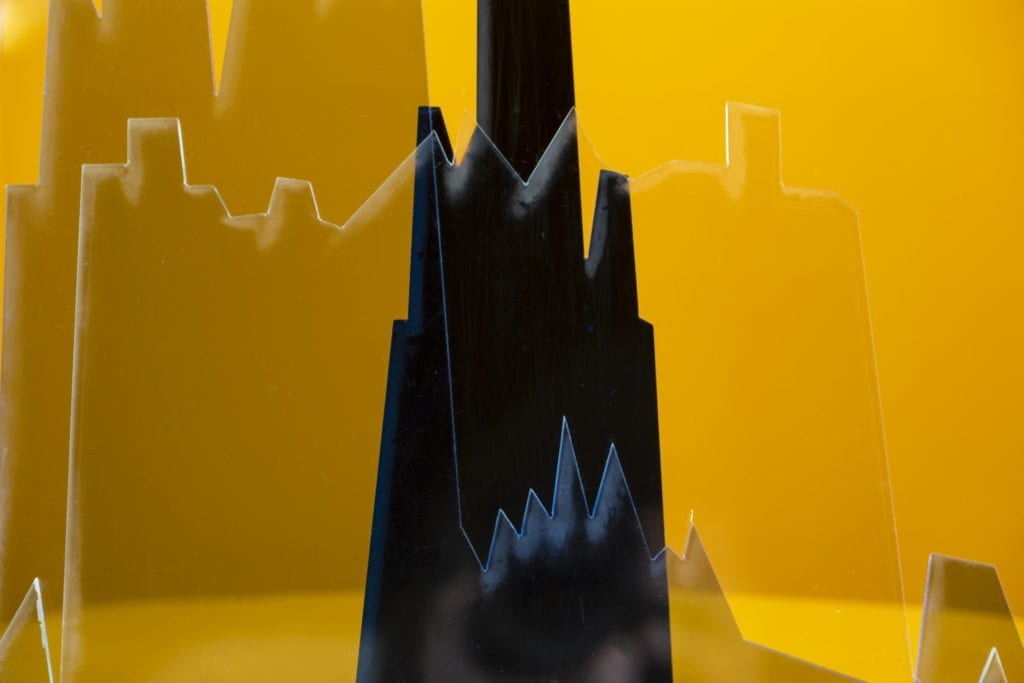
Close up view.

Final Laser Cut Piece

I’m thrilled with how this piece turned out in the end! There are a few things that I would like to consider in future iterations. 

  • Possible build the piece backward – I really like how it looks through the acrylic. 
  • Run a strip of LED lights on the bottom to illuminate the entire piece. 
  • Figure out why the laser cutter leaves a fog around the edge of a cut. 

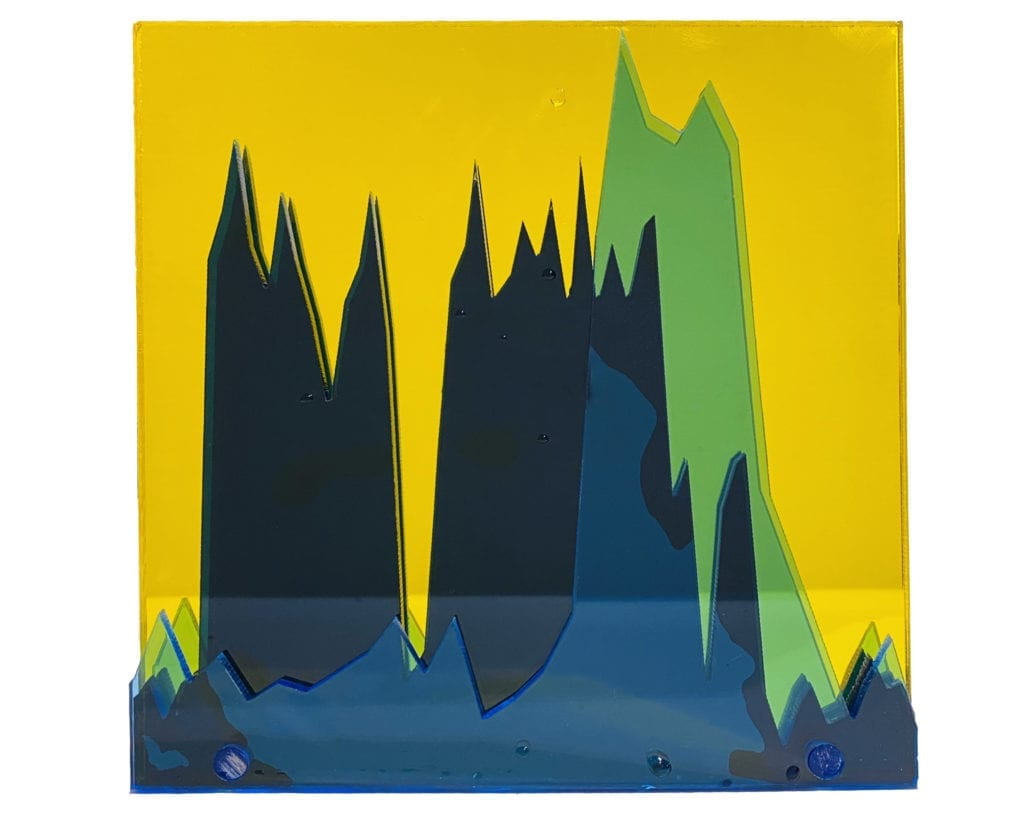
Version 2:

Acrylic waves in blue on a mirrored yellow background Acrylic waves in blue on a mirrored yellow background