Time – Extinction Clock

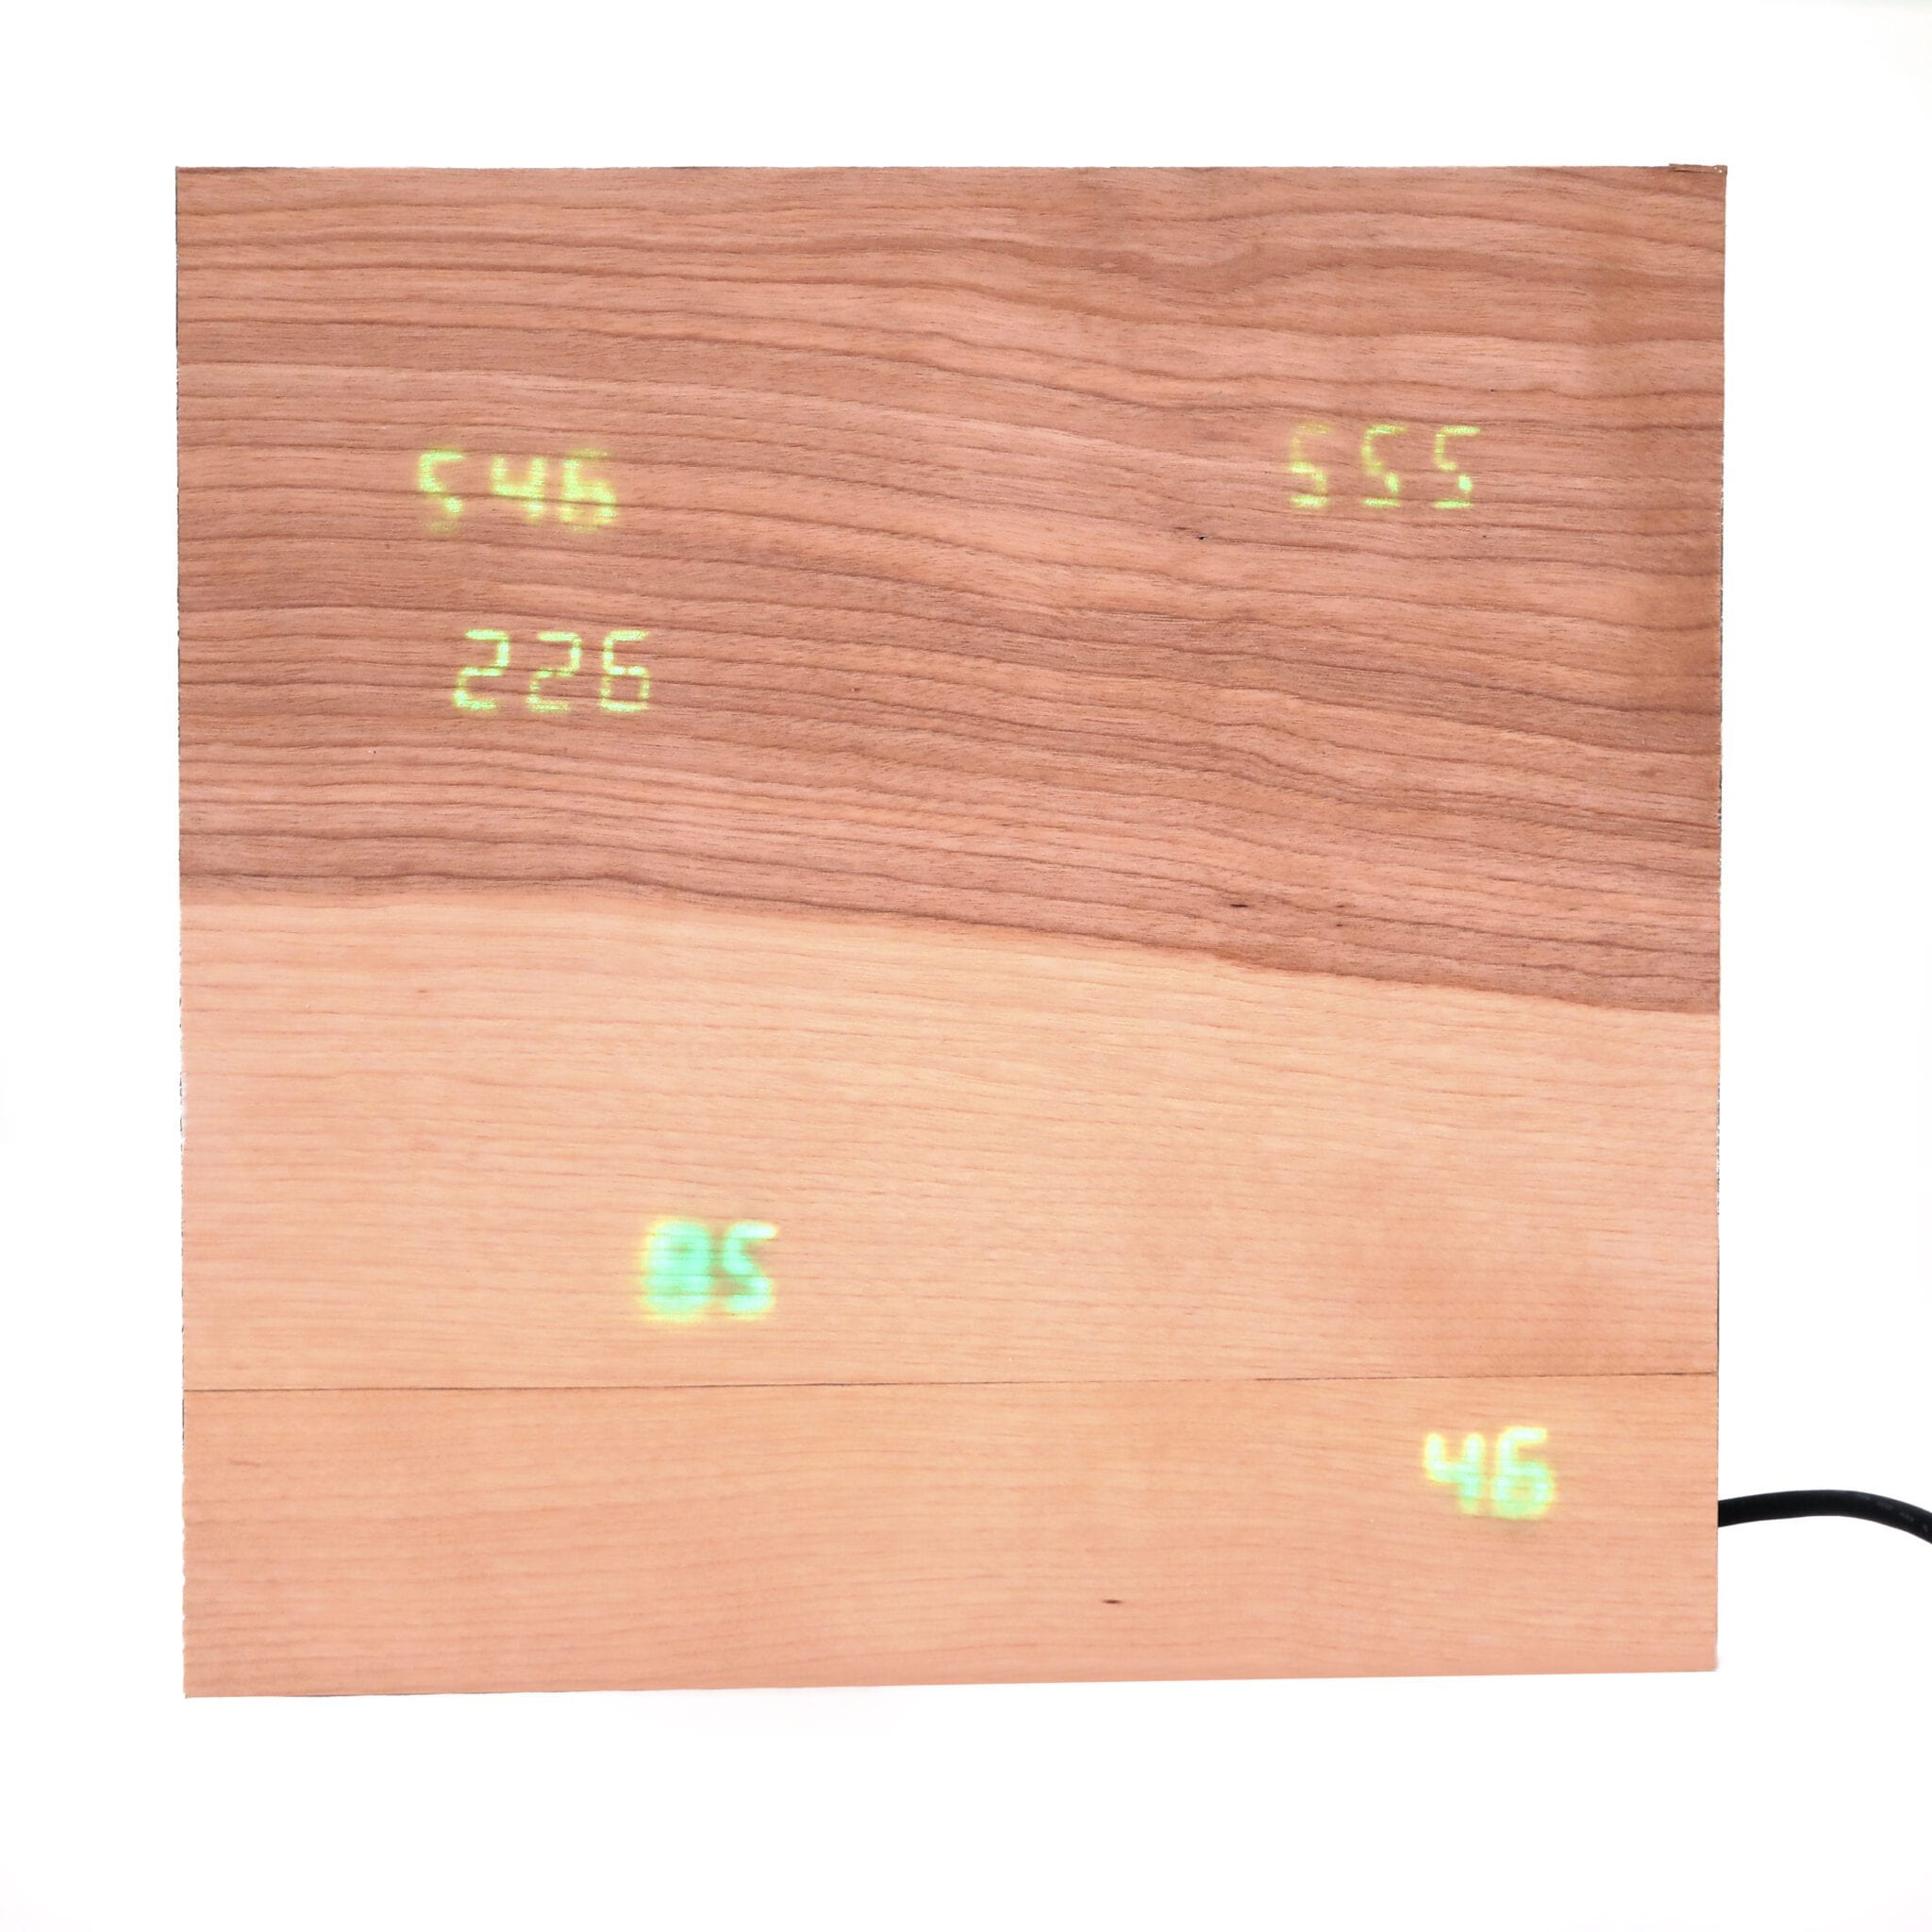
Extinction Clock presents a segment of threatened and endangered species data produced by the IUCN Red List, a non-profit organization founded in 1964 that makes a “comprehensive inventory of the global conservation status of biological species.” – IUCN. 

For this piece, I am focusing on mammals data. 

The clock is broken into five faces: 

  • Vulnerable Mammals
  • Endangered Mammals
  • Critically Endangered Mammals
  • Extinct Mammals (since the last update)
  • Days until the list is updated

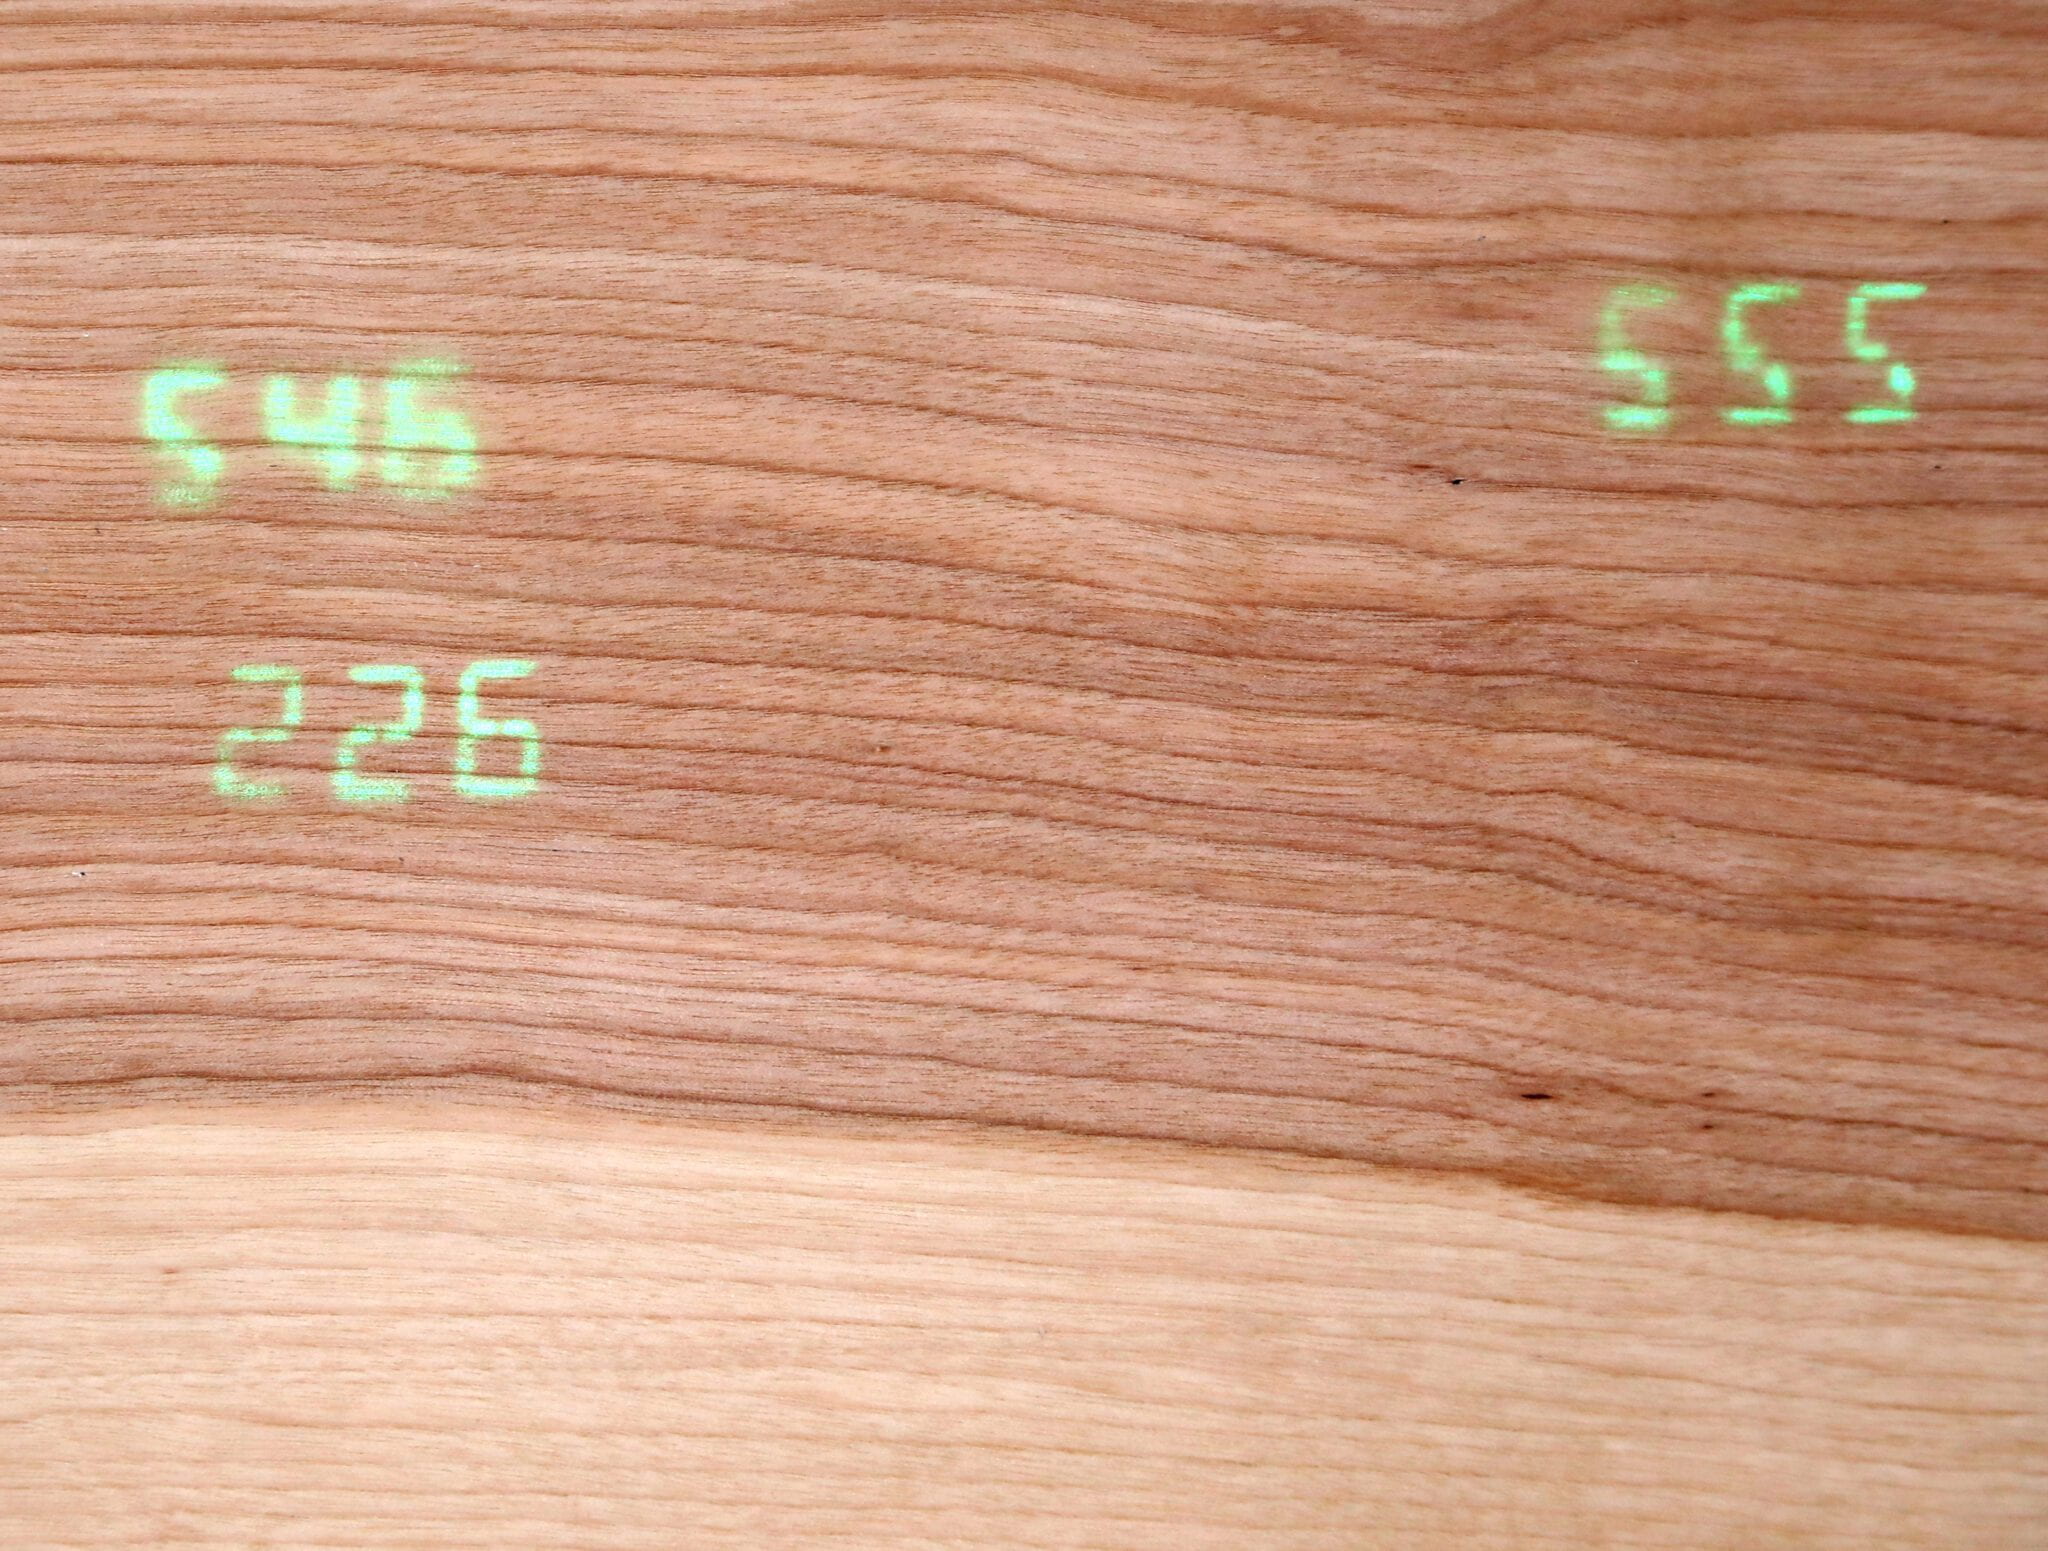
The combined surface area of the clock faces makes up 23% of the overall clock face. This represents a new study stating that only 23% of land remains “wild”, excluding Antarctica. According to the survey, this remaining wildland is primarily concentrated in Canada, the United States, Russia, Brazil, and Australia. The placement of the faces loosely represents the location of these countries on a flat map. 

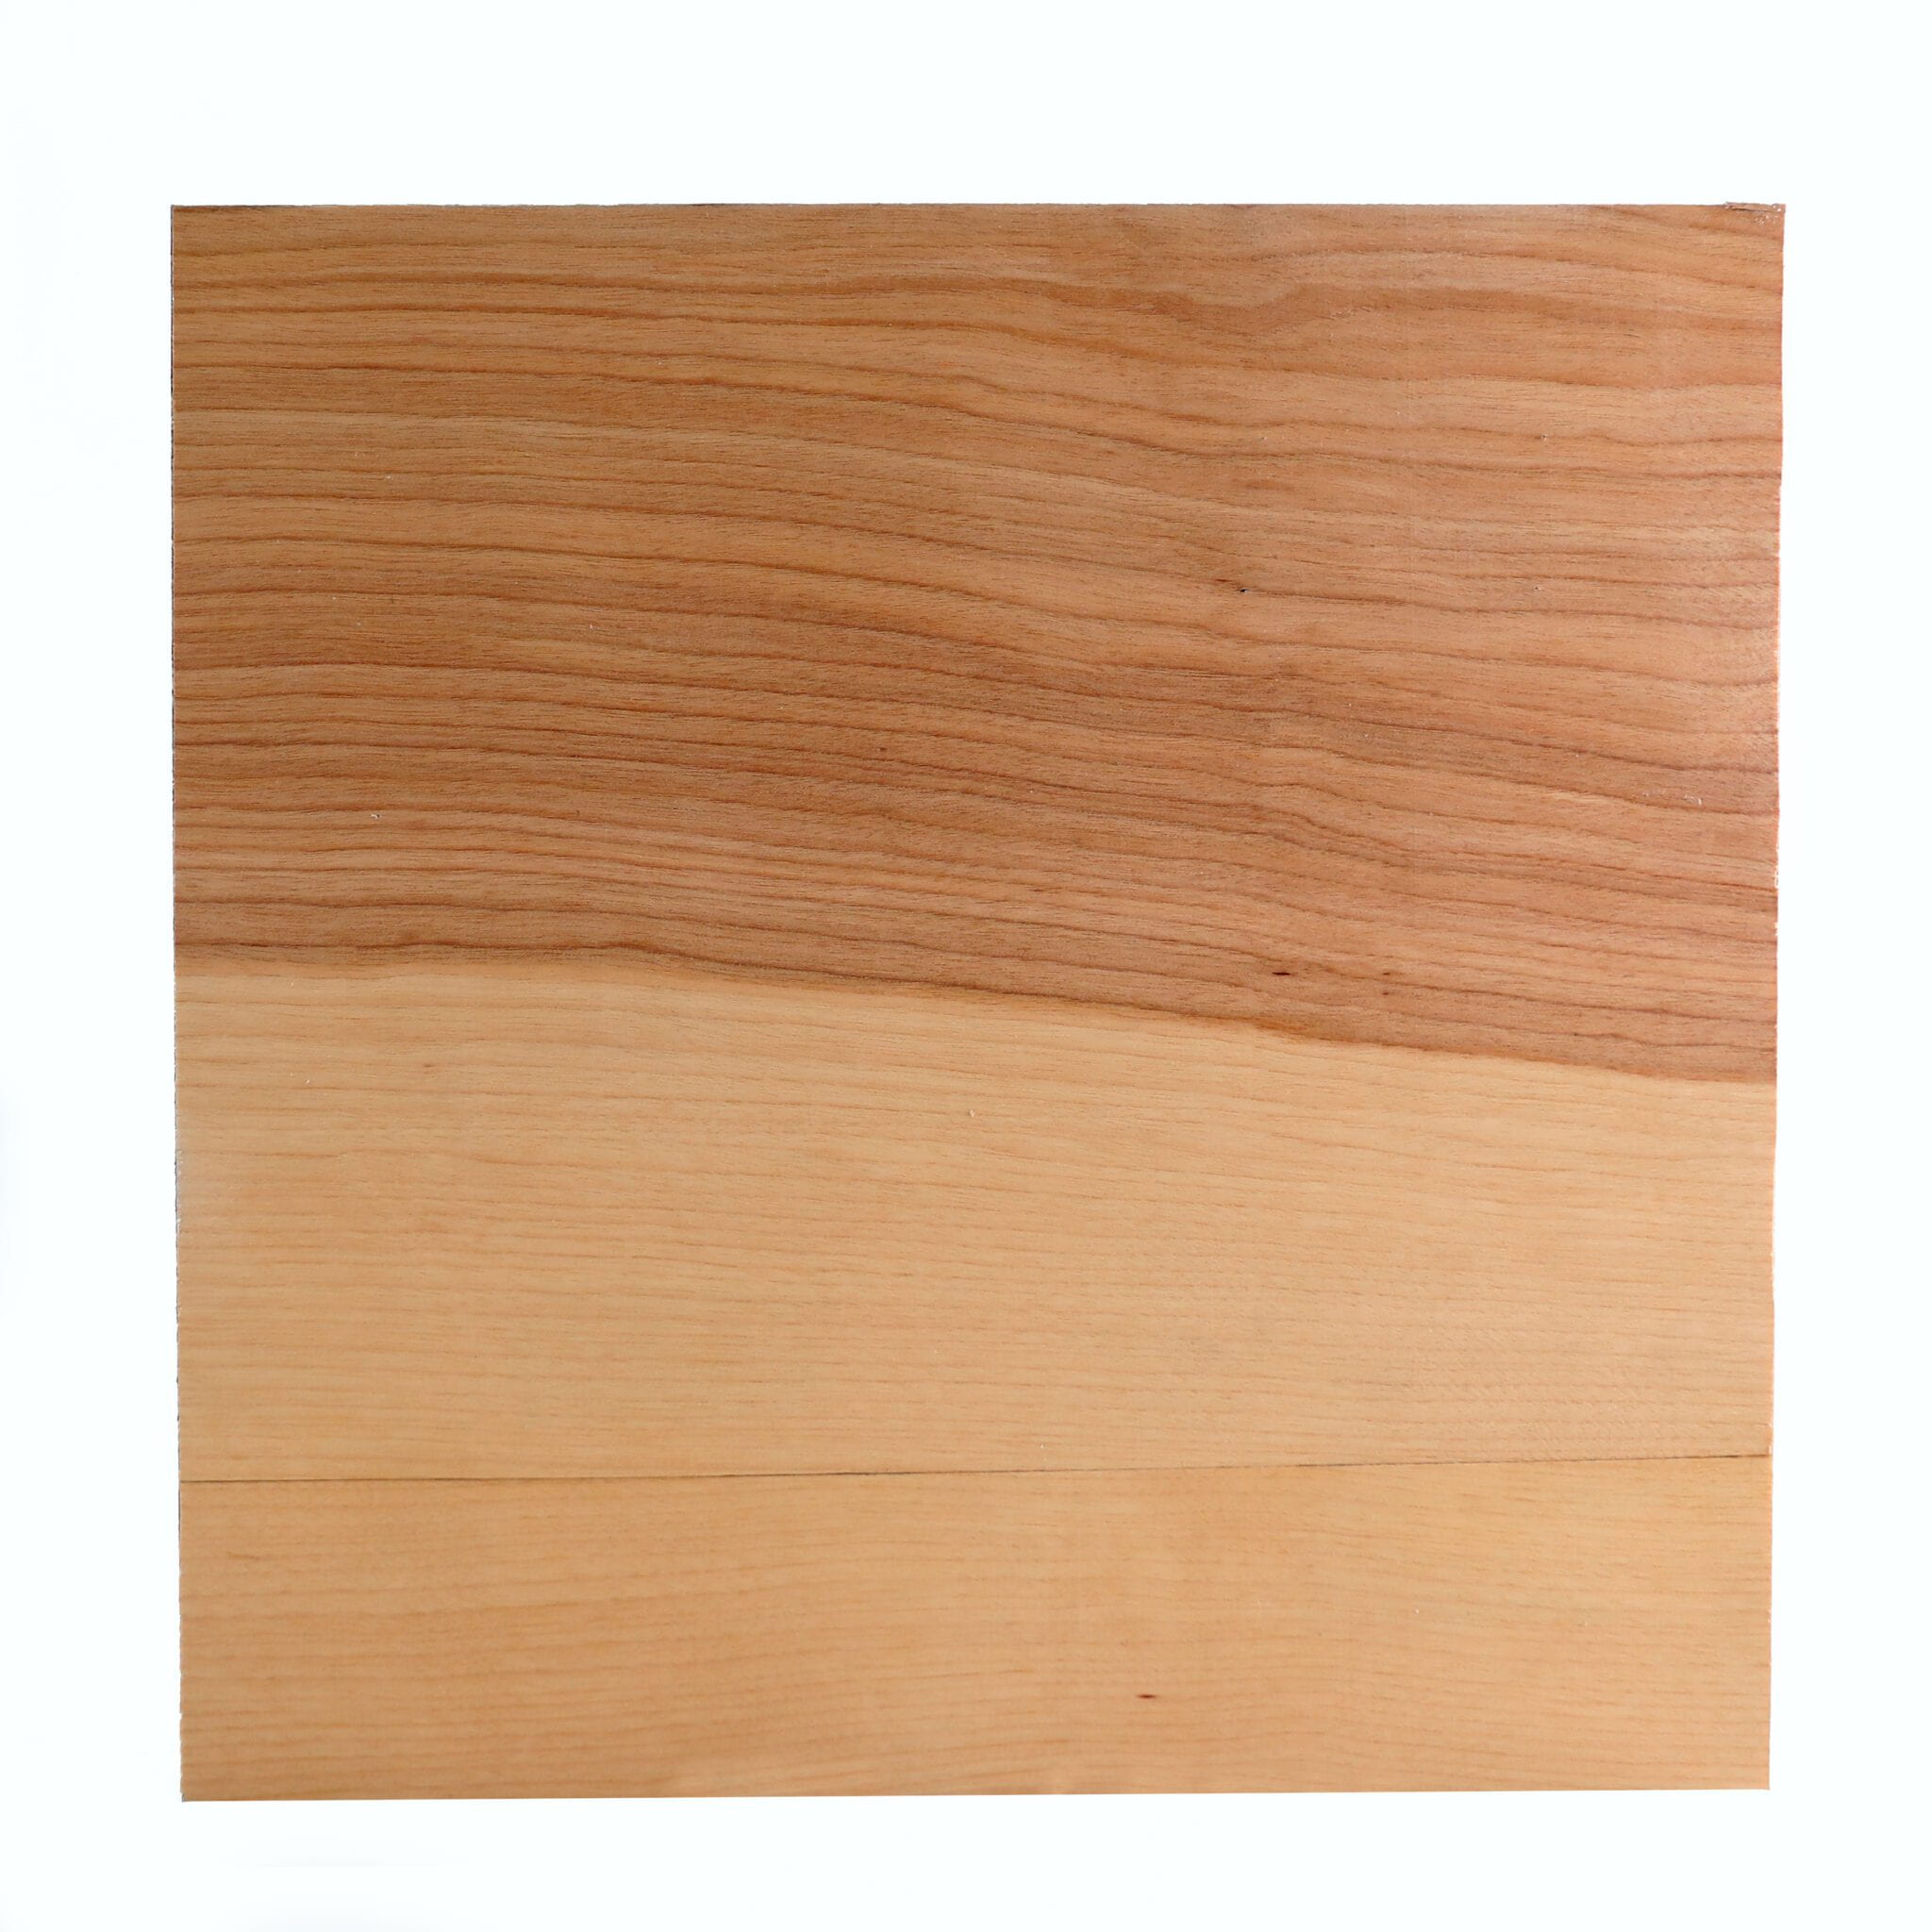
A thin layer of wood veneer obscures the digital faces. This was both an aesthetic decision and to explore the idea that humans can easily overlook the continued and rapidly increasing extinction of species without conscious actions. 

The clock was intentionally left to be obscure to encourage viewers to read its documentation.

Extinction Clock

Extinction Clock

Extinction ClockExtinction Clock

Extinction Clock

Extinction Clock II

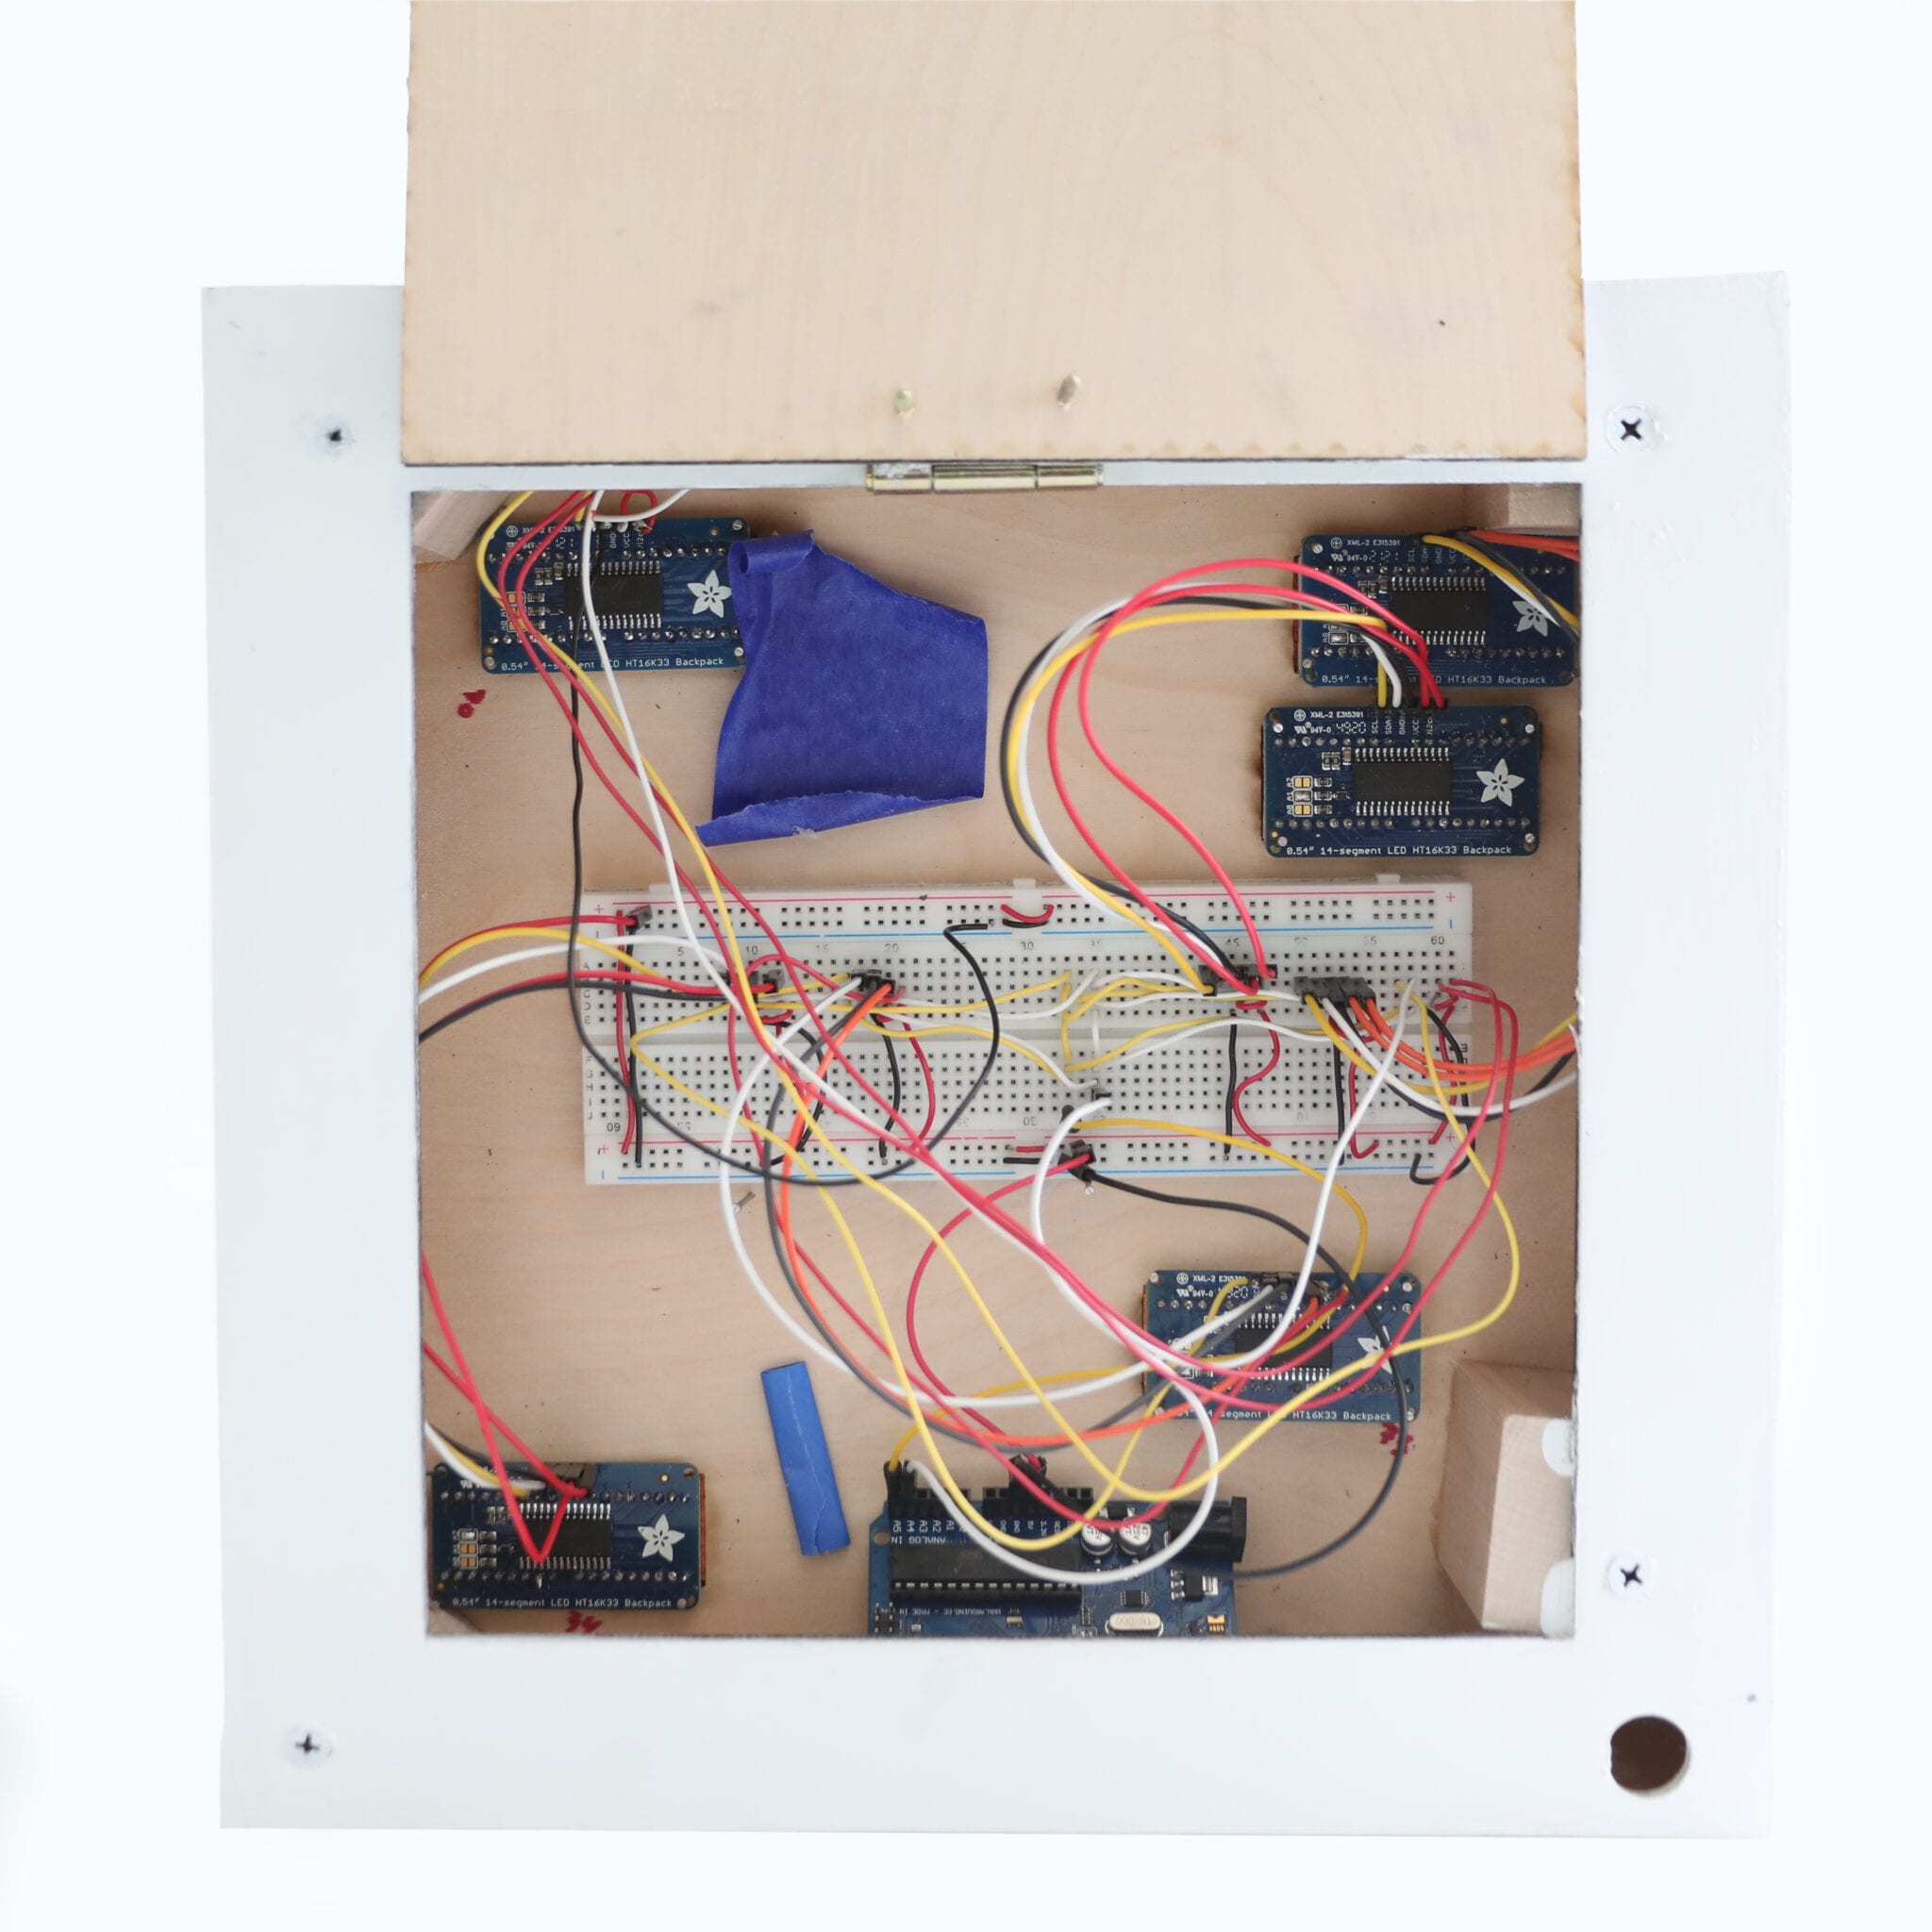
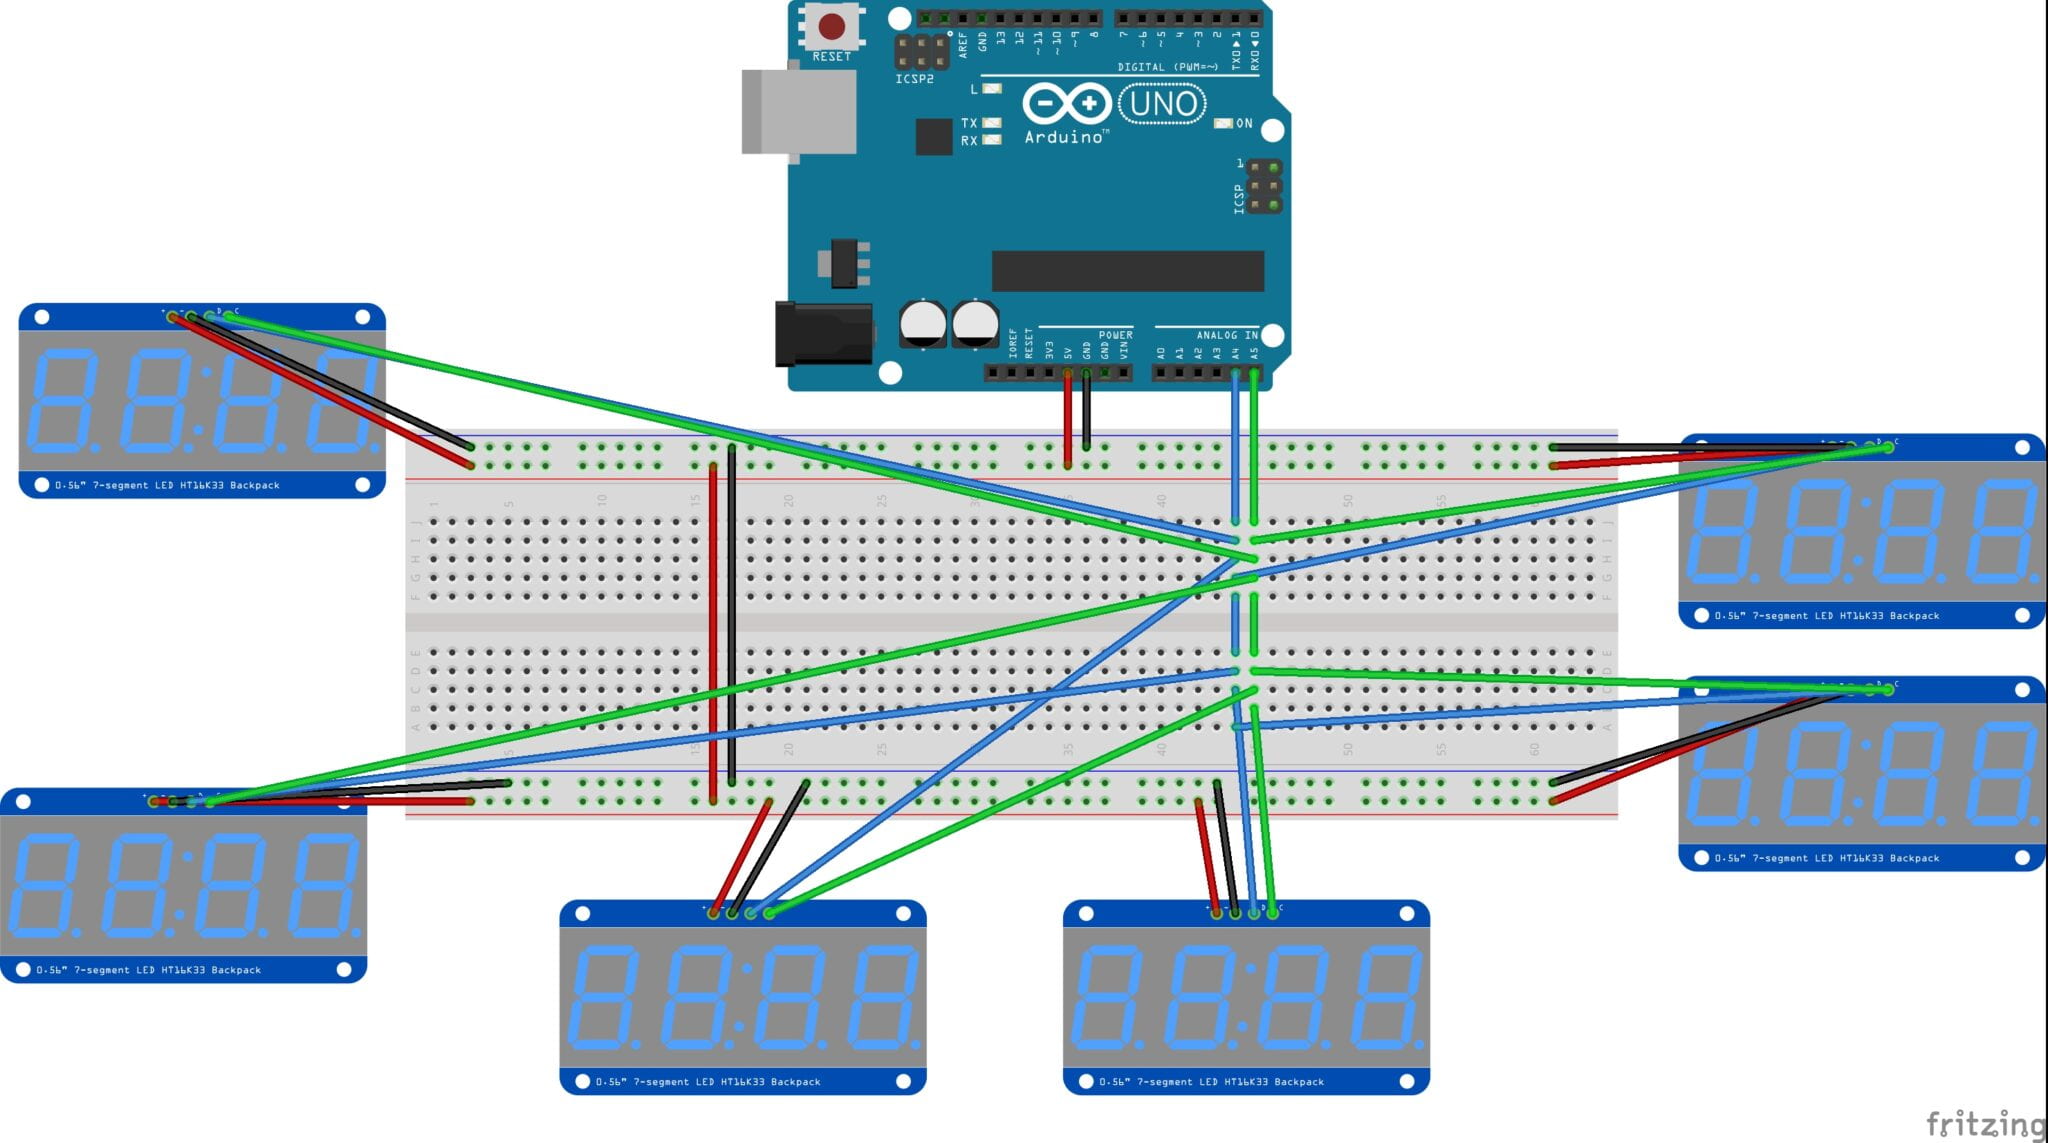
Drawing of a circuit


Extinction clock part II: 

I have been thinking a lot about my extinction clock and maintaining simplicity but still share essential information. For this piece, I’ll be using the IUCN Red List of threatened species as a reference. 

The clock will have five screens, all displaying different numbers. 

1 – # of critically endangered mammals in the world
2- # of endangered mammals in the world
3- # of vulnerable mammals in the world
4 – # of extinct mammals since the last count
5- when the list will be updated

The five faces will take up 23% of the clock’s face representing how much “wild” land is left in the world, according to a recent study. 

The placement of the faces is a rough representation of where the 23% is globally US, Canada, Russia, Brazil, Australia.

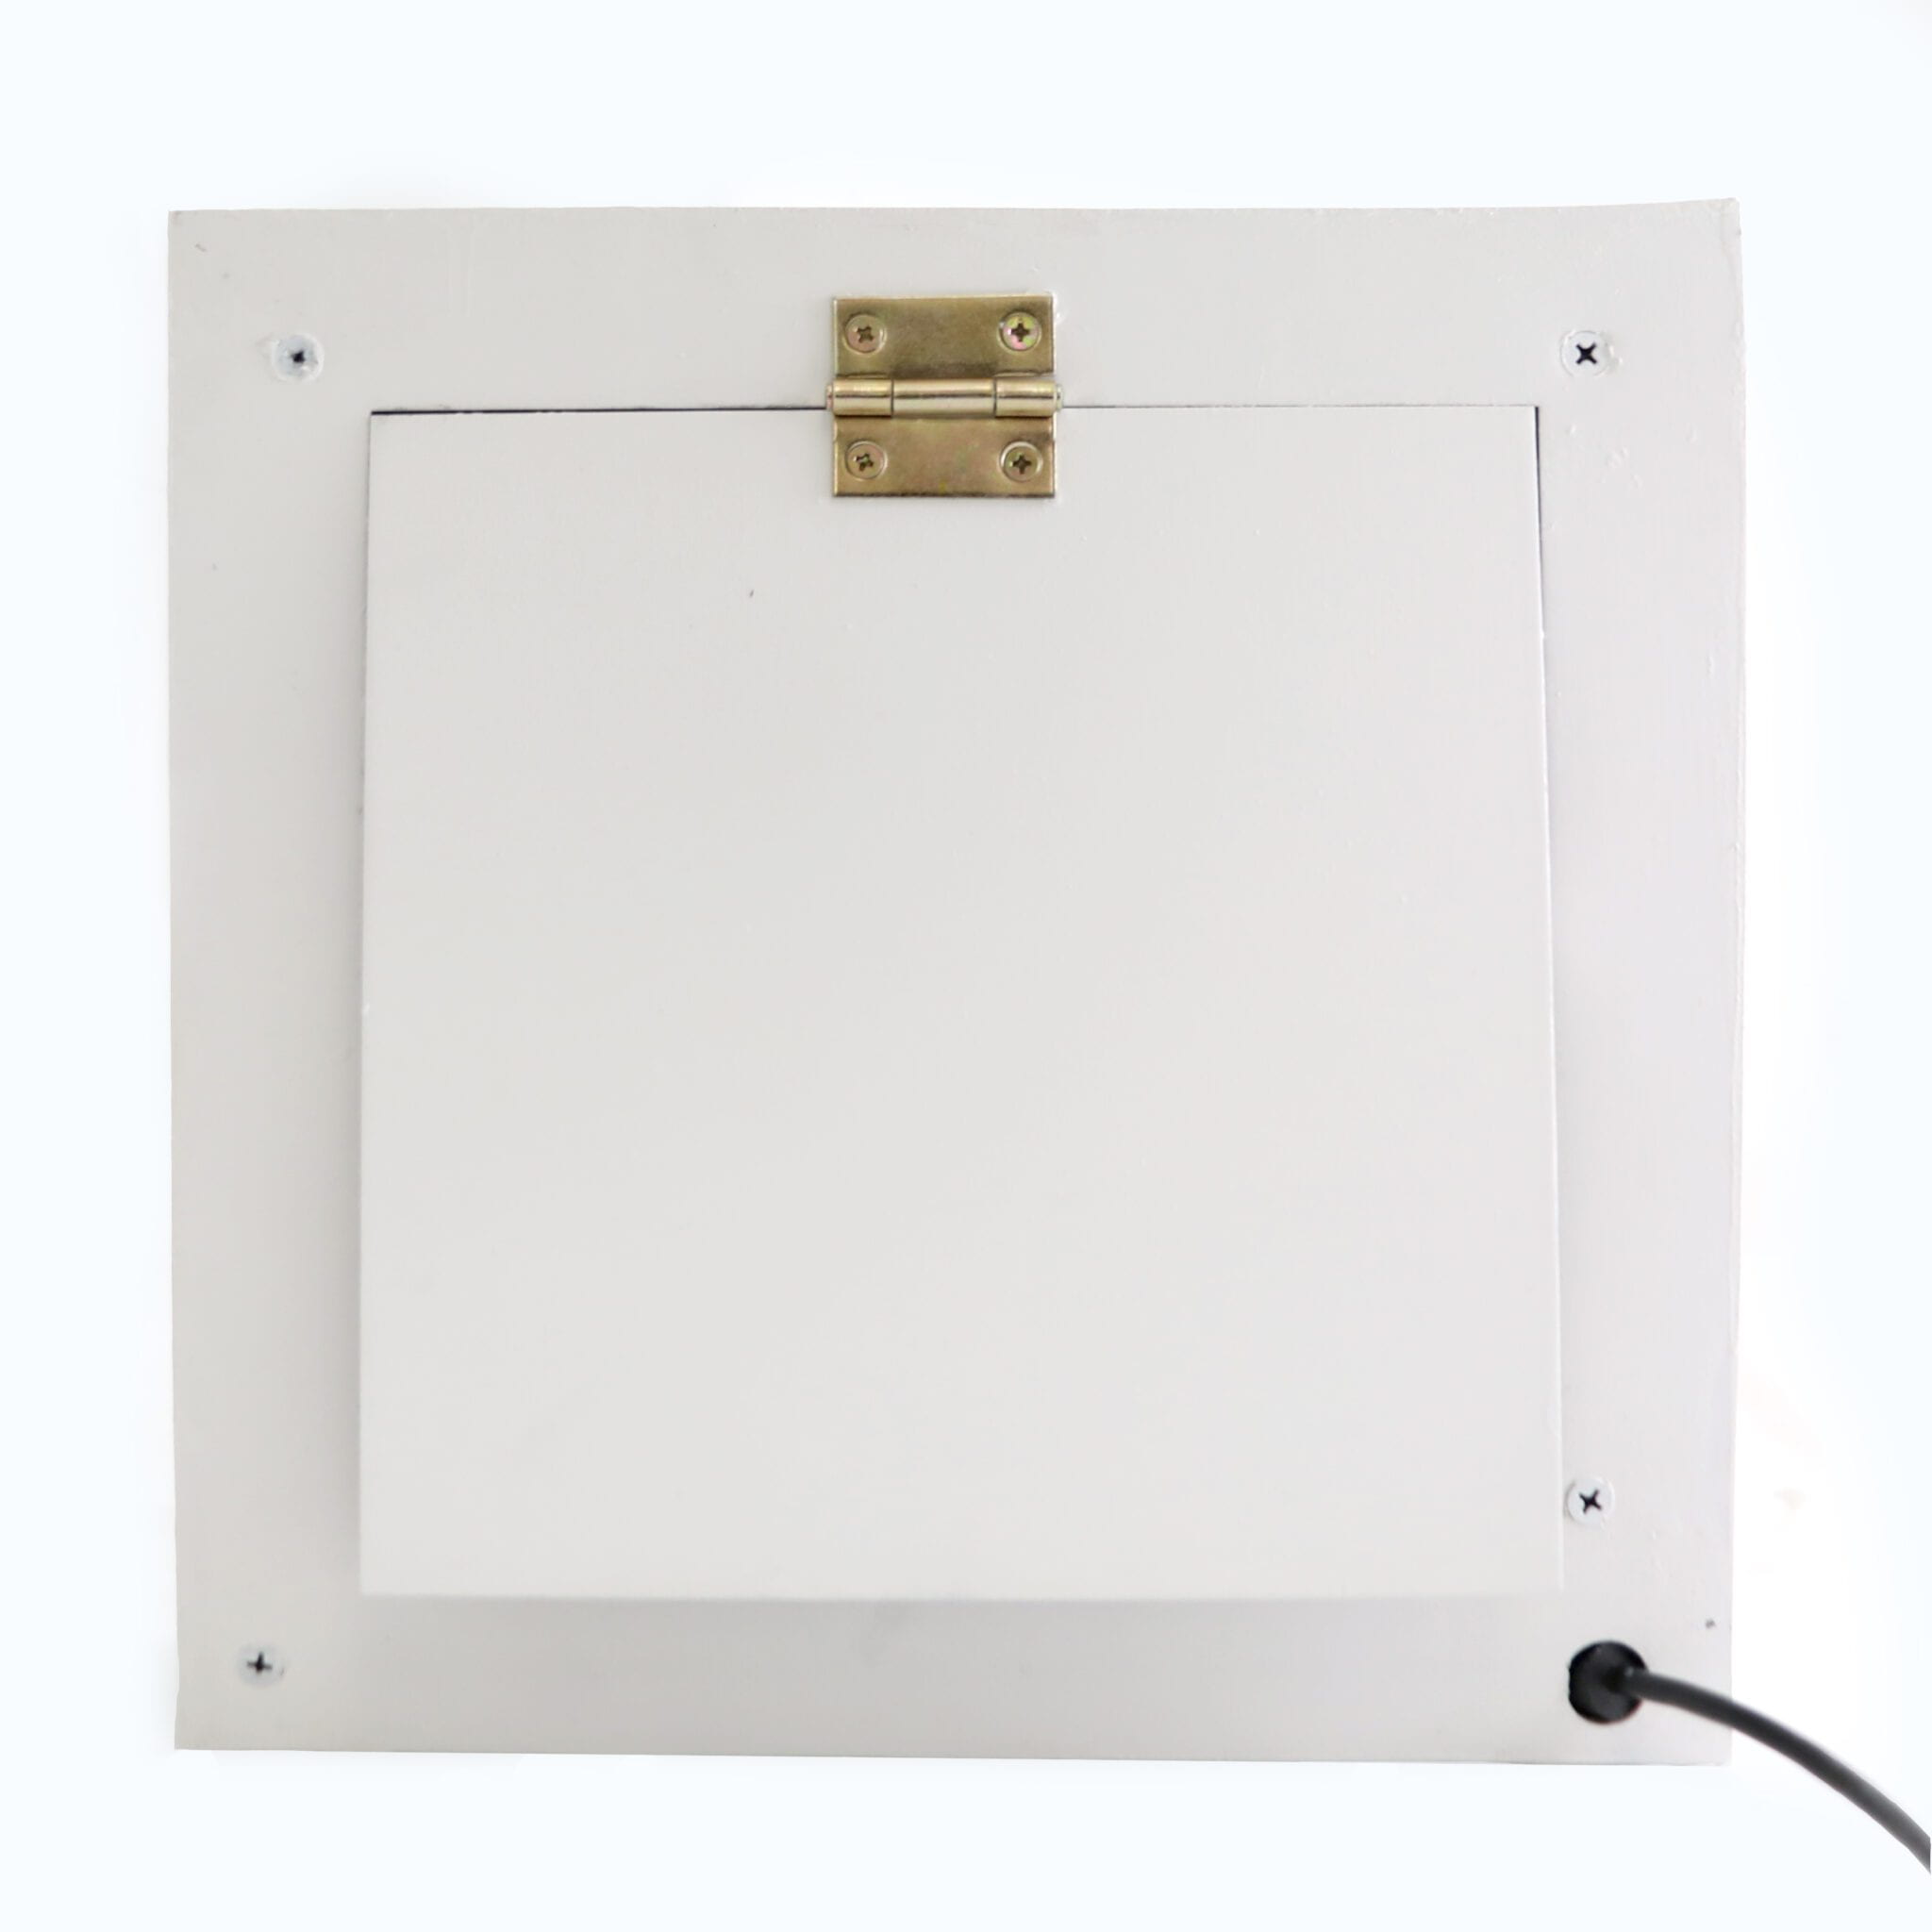
I also want to include a compartment on the back that has an explanation document. 

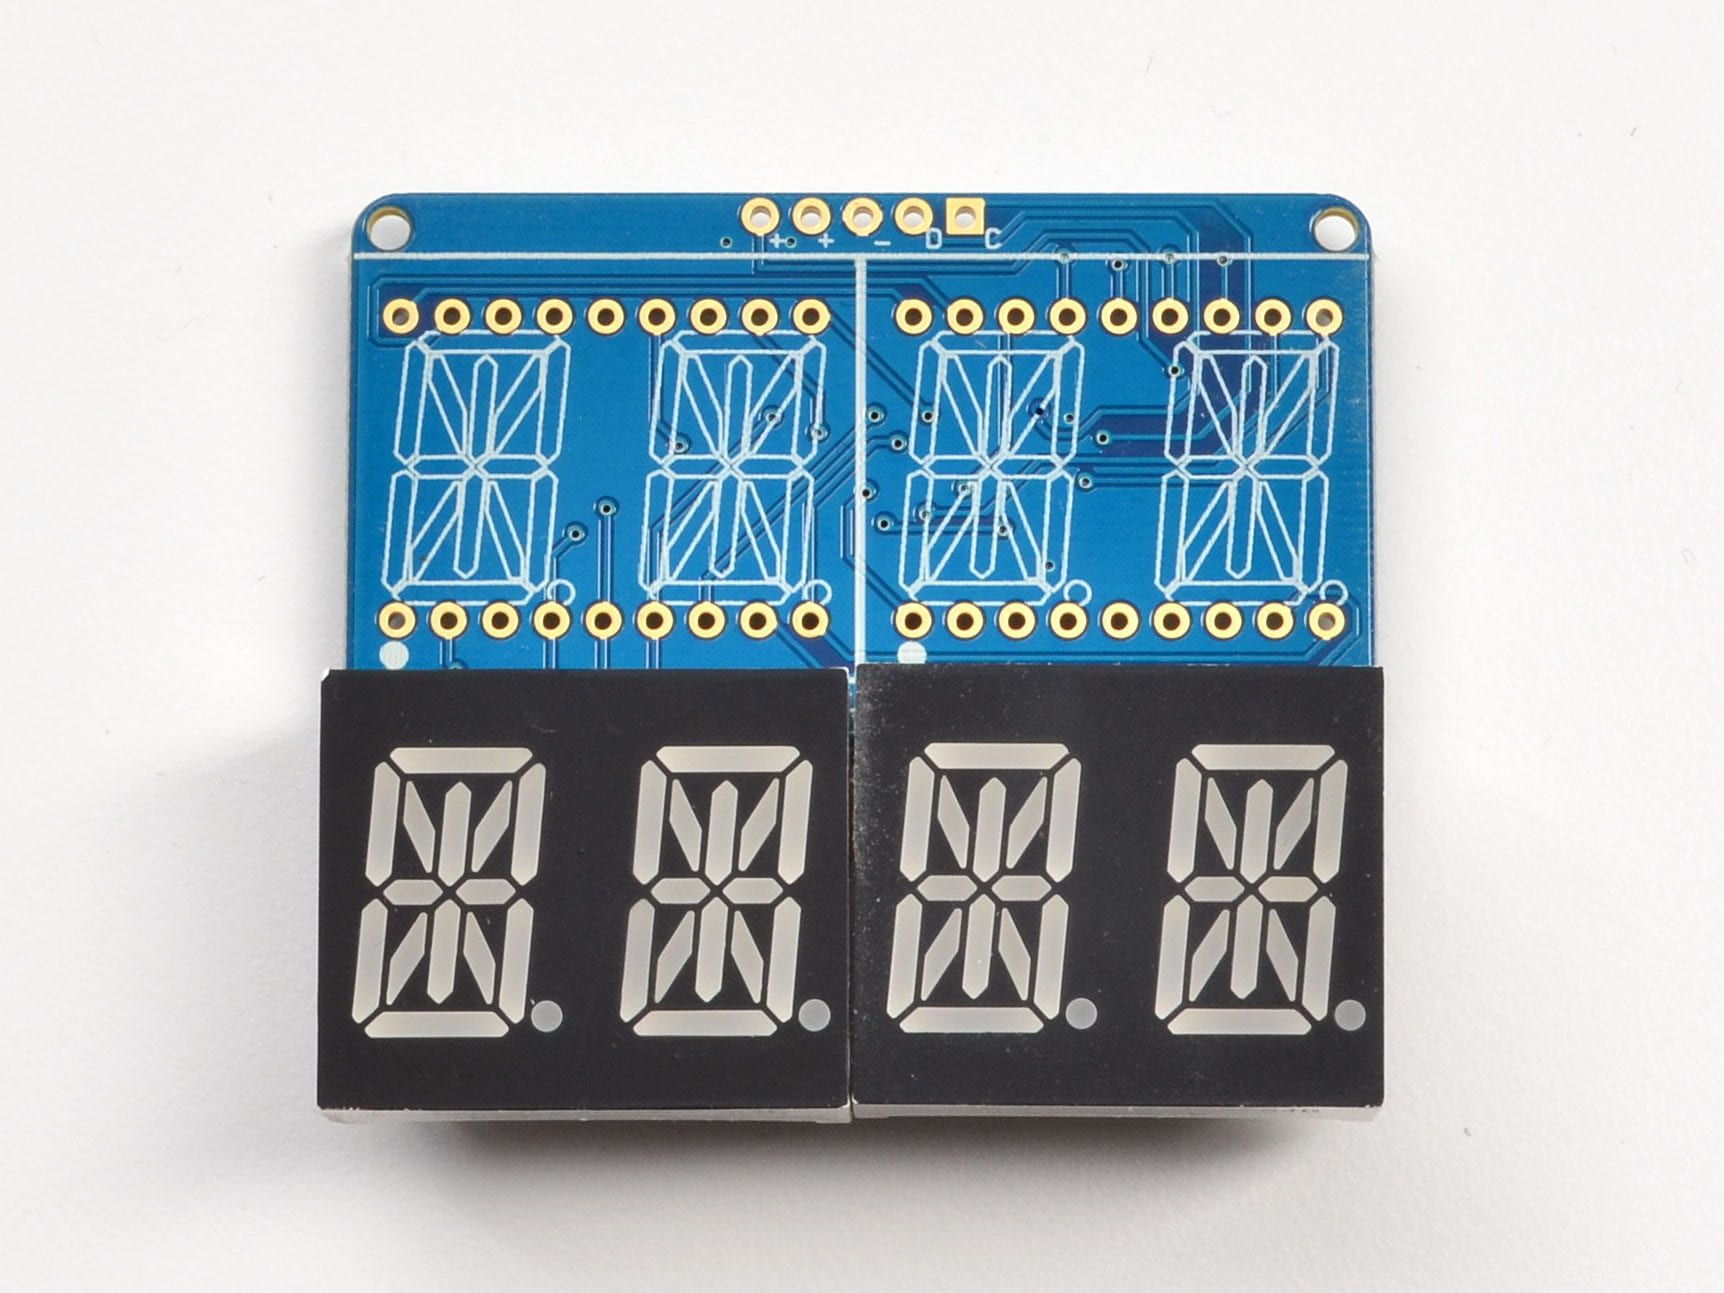
Next is to order my parts and study how to change 12C addresses on LED backpacks to run multiple LED panels on the same two pins.


Exploring Time

I think a lot about threatened and endangered species and have been working on an interactive piece centered on the topic for several years. For the piece, the image fades based on the predicted extinction rate of the species. Viewers can bring the idea back by standing and looking at the photo. 

I want to continue to work with endangered species; however, for this new piece, I would like to move away from the use of images and build something that can be permanently displayed and not necessarily convey what it’s keeping time of unless the viewer investigates.