The Greatest Show On Earth

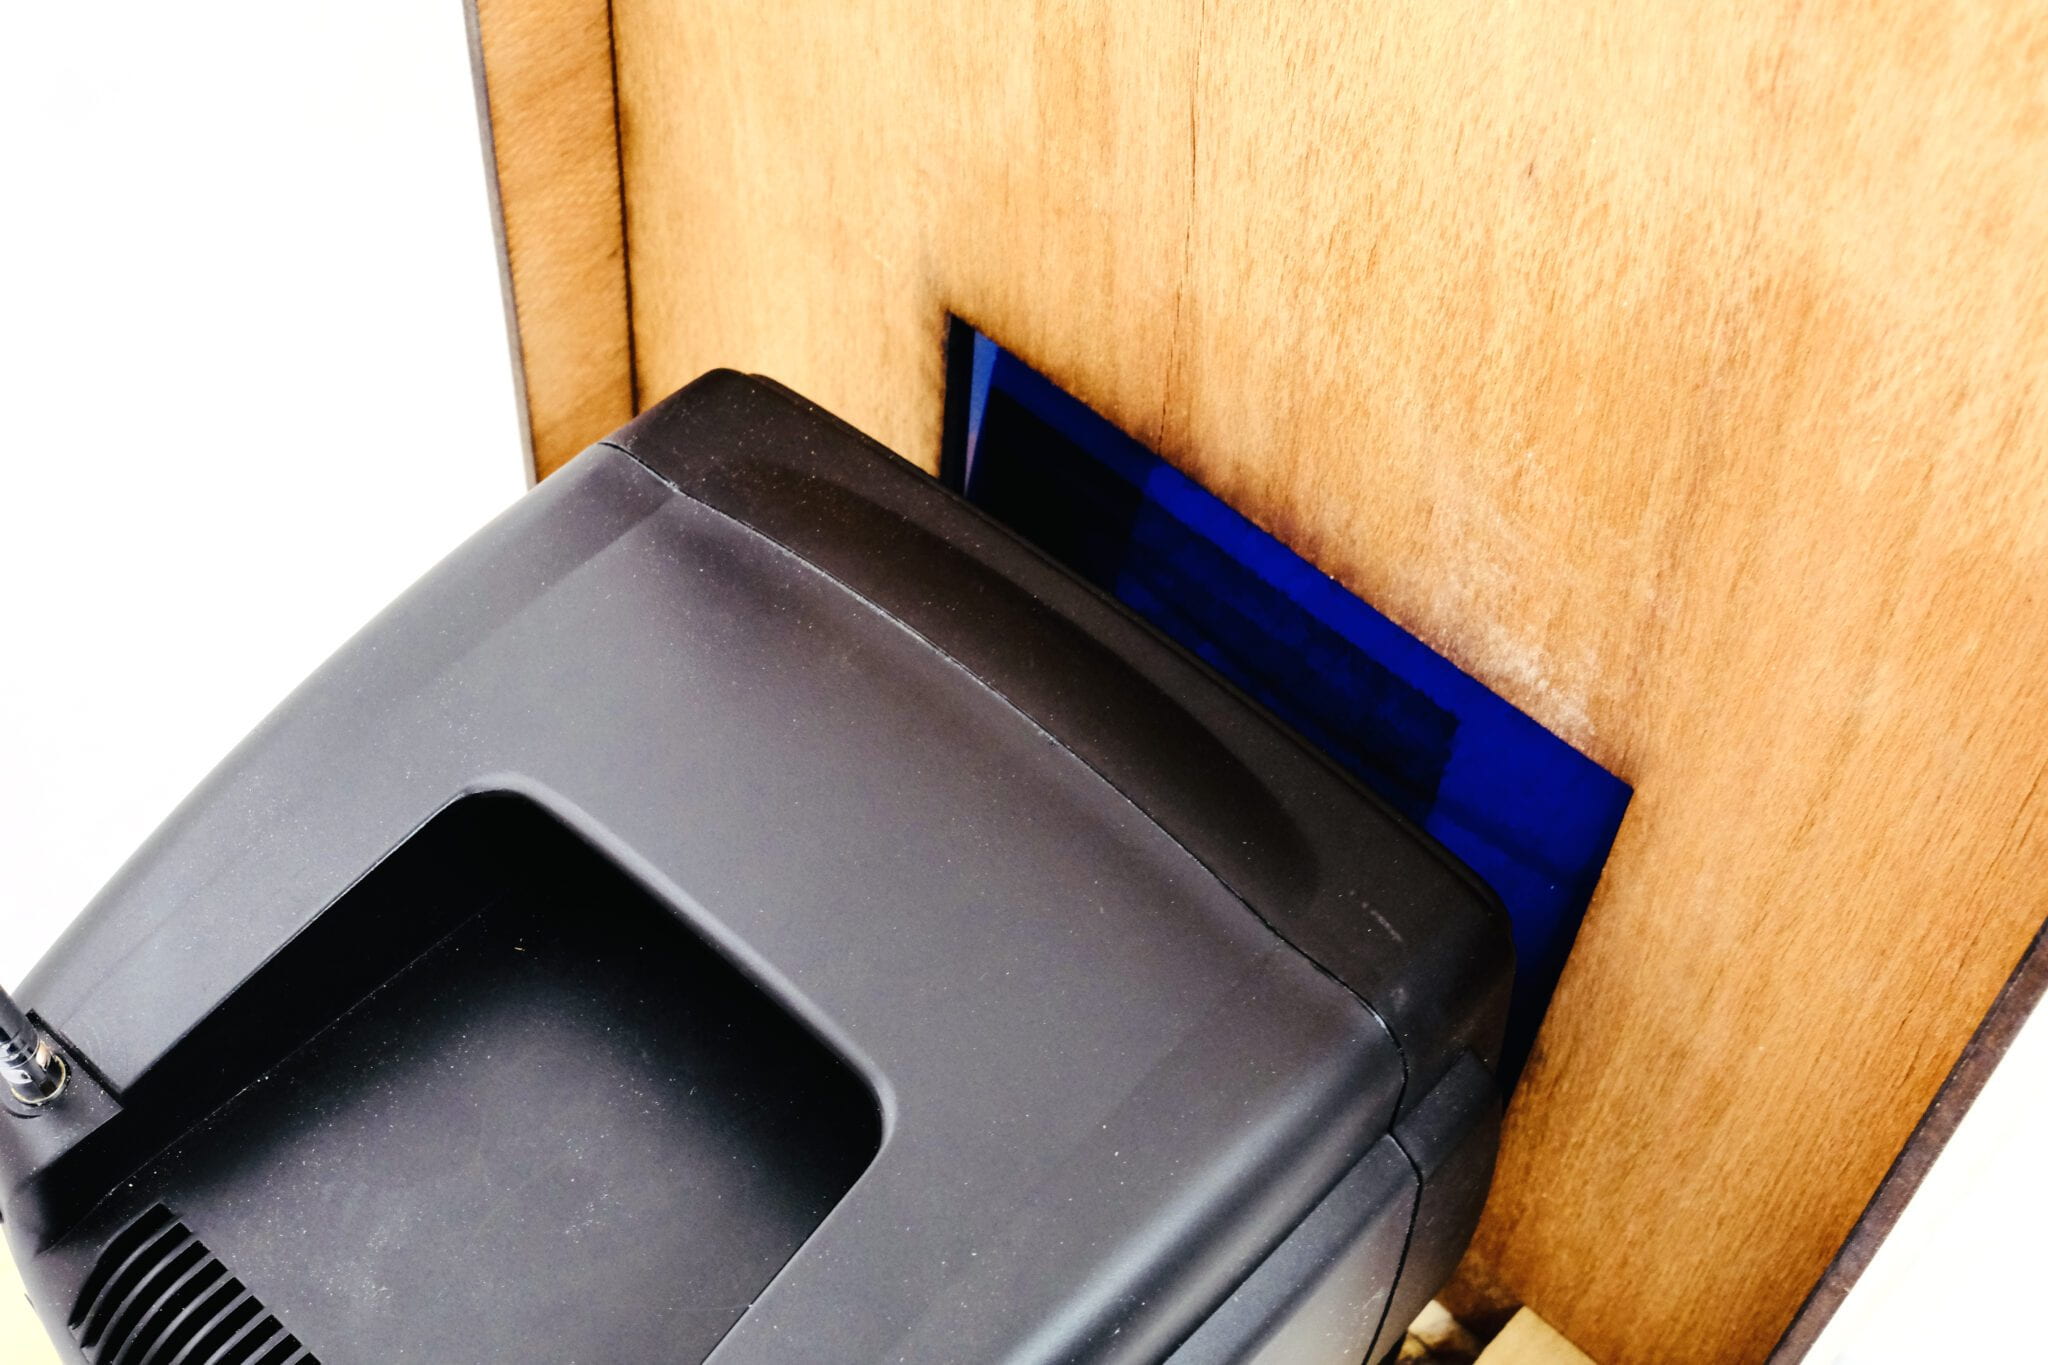
Television on sculpture

Television on sculpture
Peep hole in sculpture

Television on sculpture

The Big Bang’s Playing on TV
“Several members of the NASA Goddard COBE teamwork on WMAP. Like COBE, WMAP scans the sky repeatedly, soaking up the ancient light from the Big Bang known as the cosmic microwave background. Microwaves are a low-energy form of radiation but higher in energy than radio waves. The cosmic microwave background blankets the universe and is responsible for a sizeable amount of static on your television set–well, before the days of cable. Turn your television to an “in-between” channel, and part of the static you’ll see is the afterglow of the big bang.” – Background Explorer and the Science of John Mather – NASA.Gov

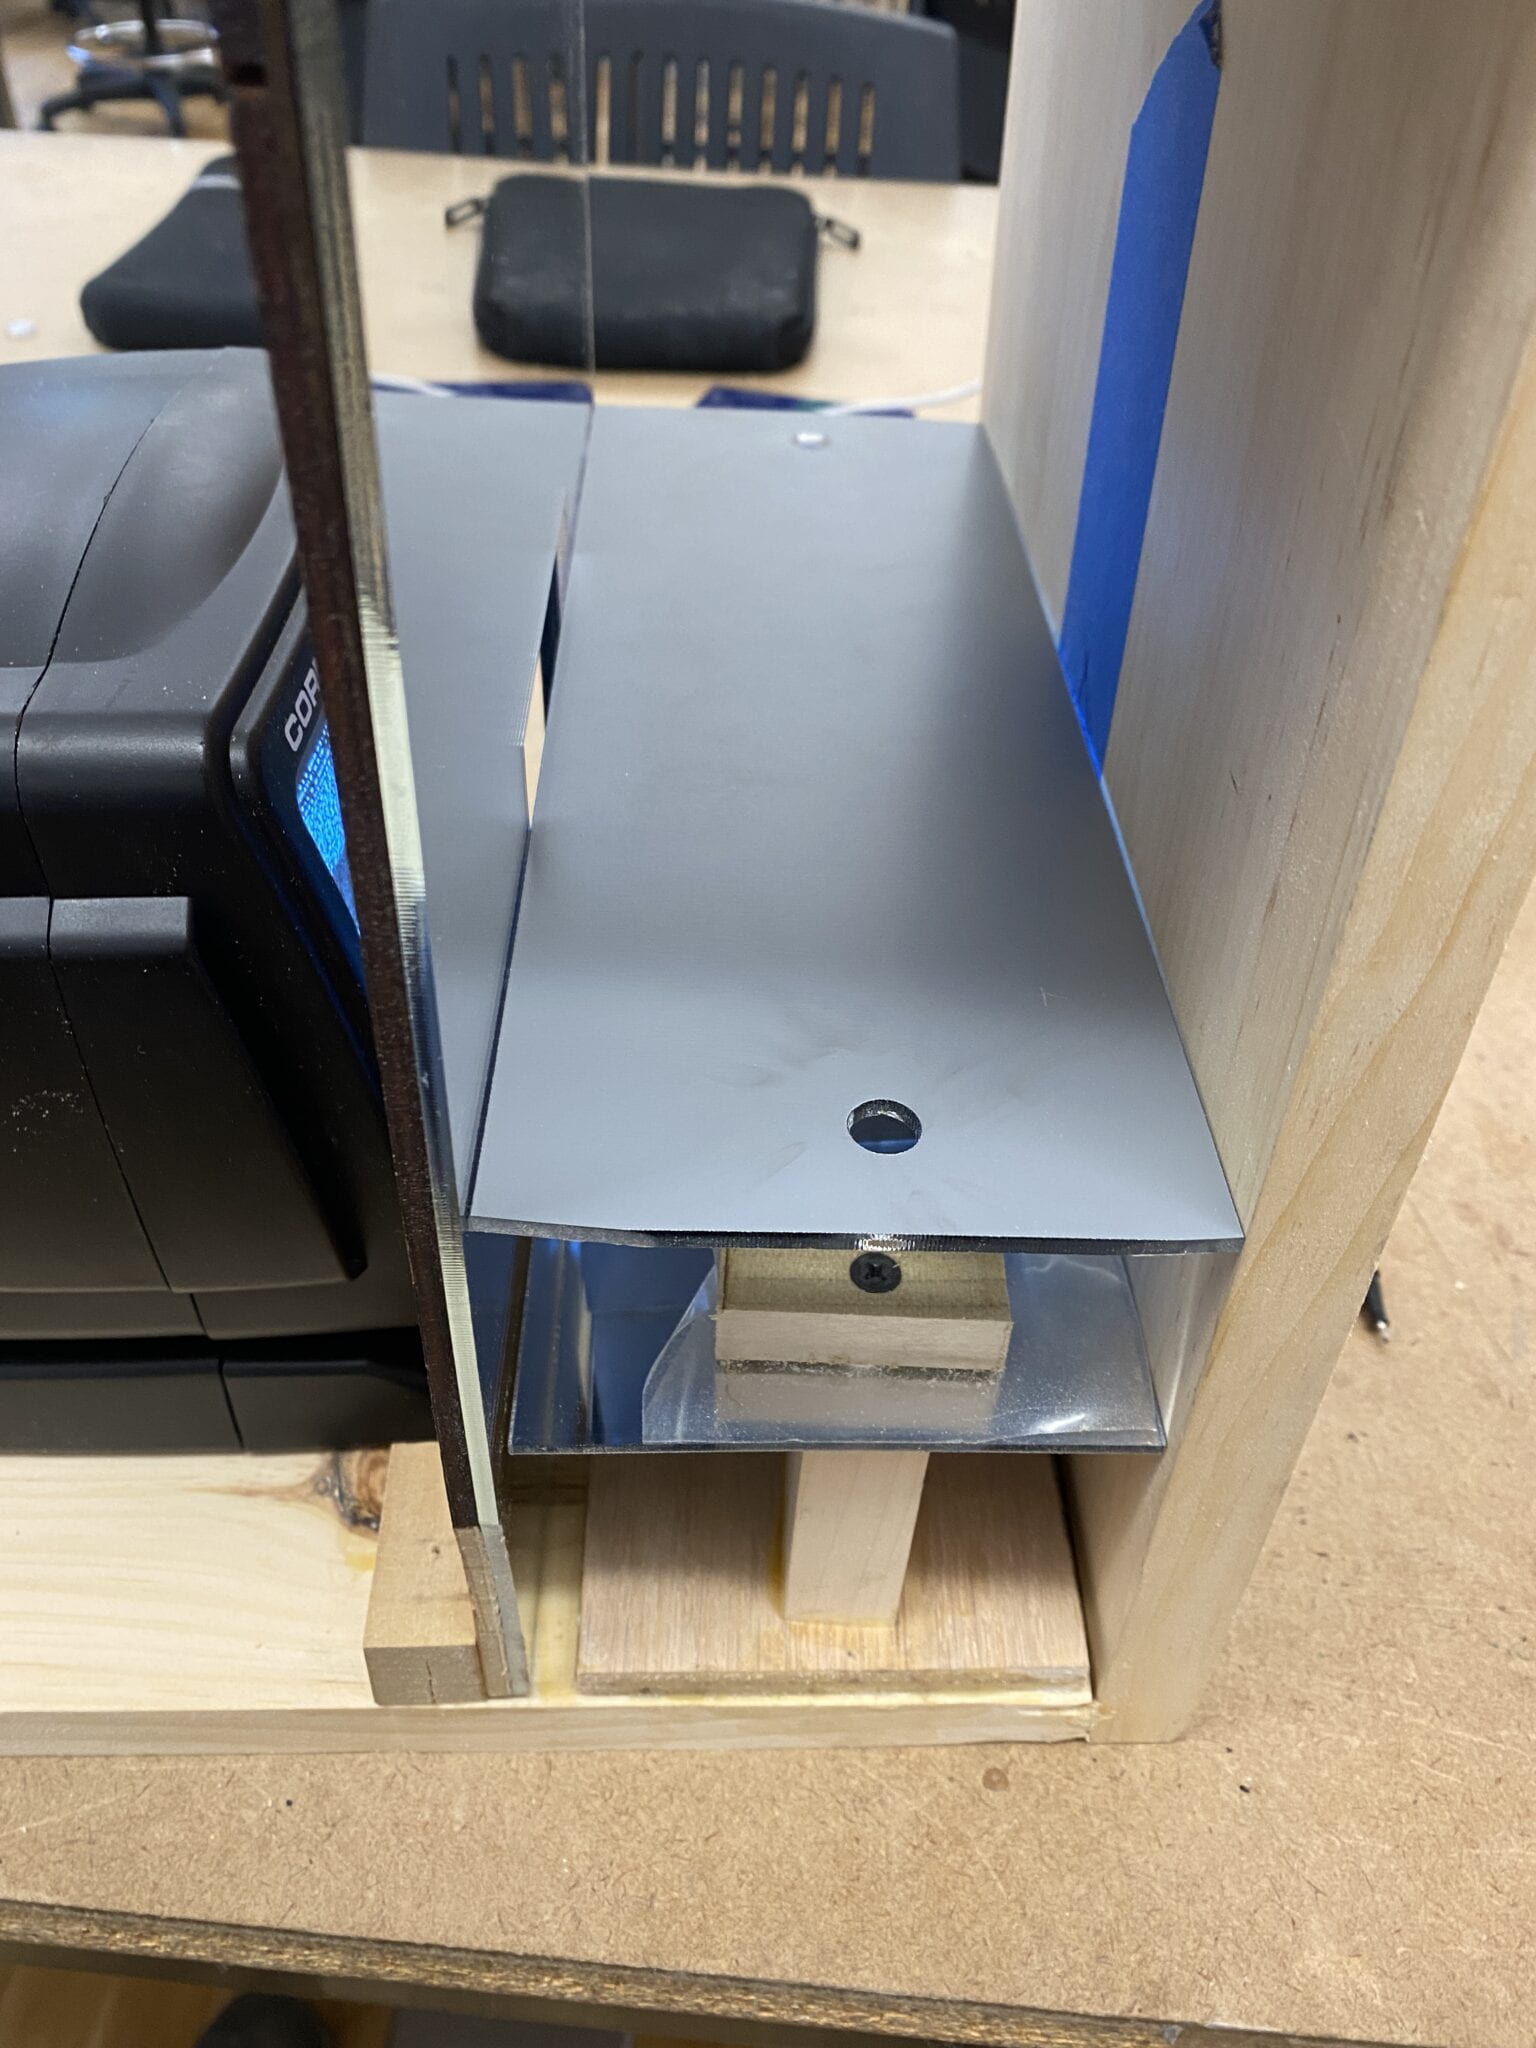
For this piece, I wanted to explore the idea of the cosmos and the formation of our solar system. While researching, I came across a fact that made my head spin; a portion of the static on old analog televisions is radiation from the big bang. This is truly the most incredible show on TV. After acquiring an old tv on eBay, I built an infinity mirror inside a wood housing for the static to be projected into. The viewer looks through the peephole and is surrounded by static. I filtered it blue to cut down on the overall luminosity. I’m hoping the viewer takes a moment to reflect on their existence and the formation of everything around them. I intentionally left the television exposed, so the viewer has a familiar object to relate to. 

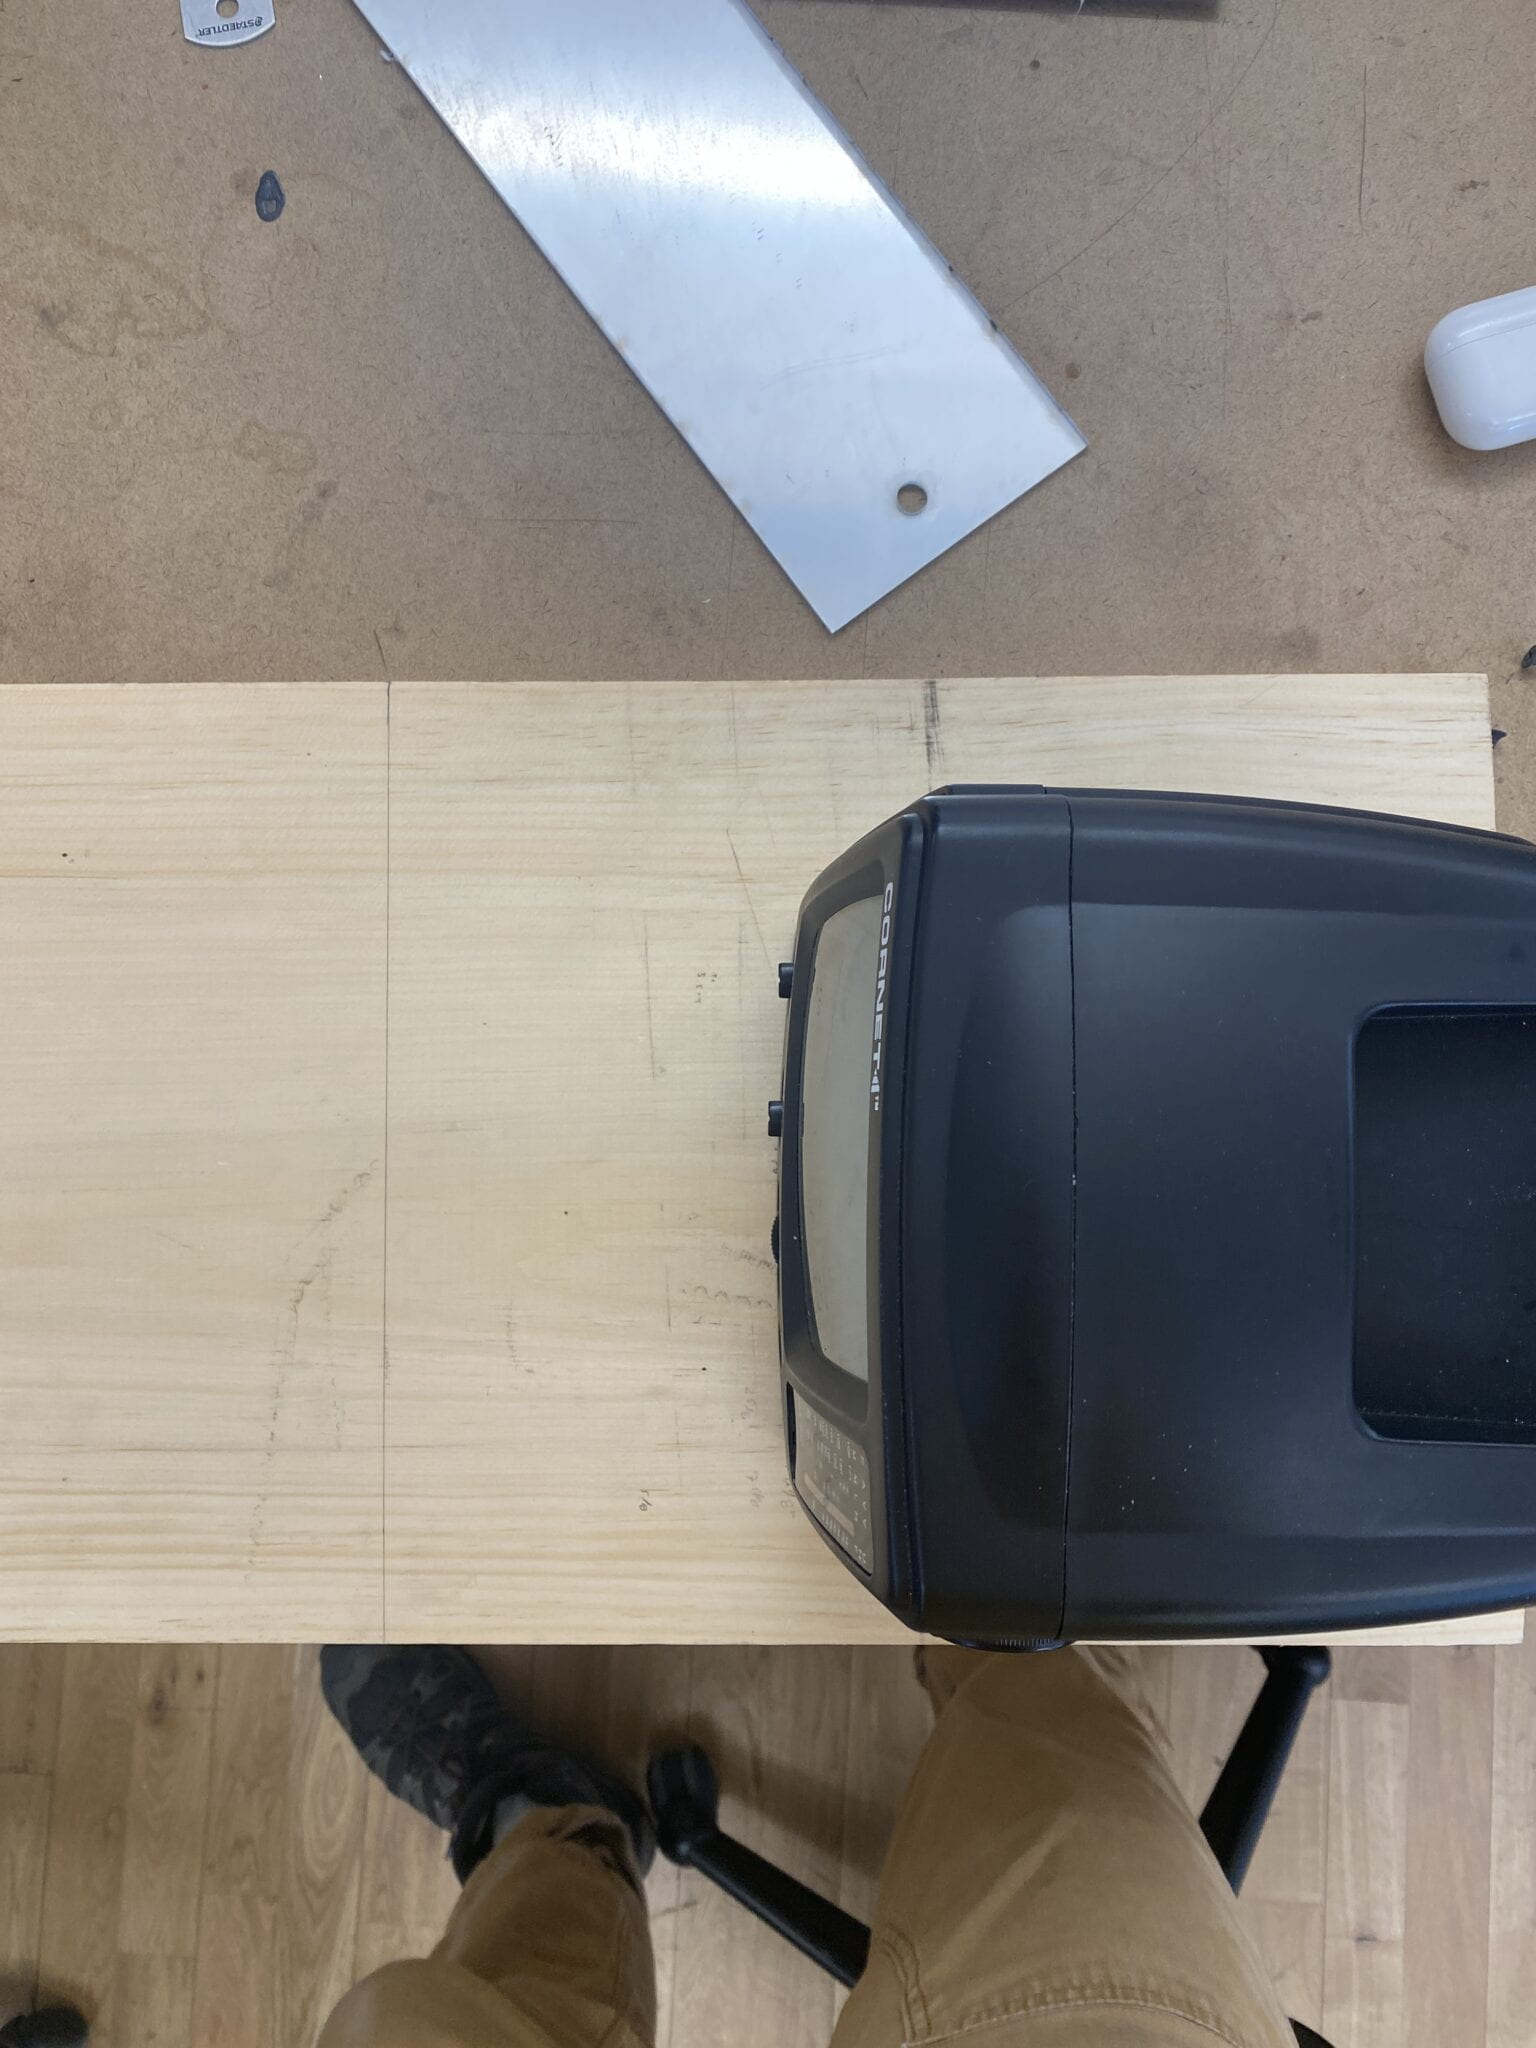
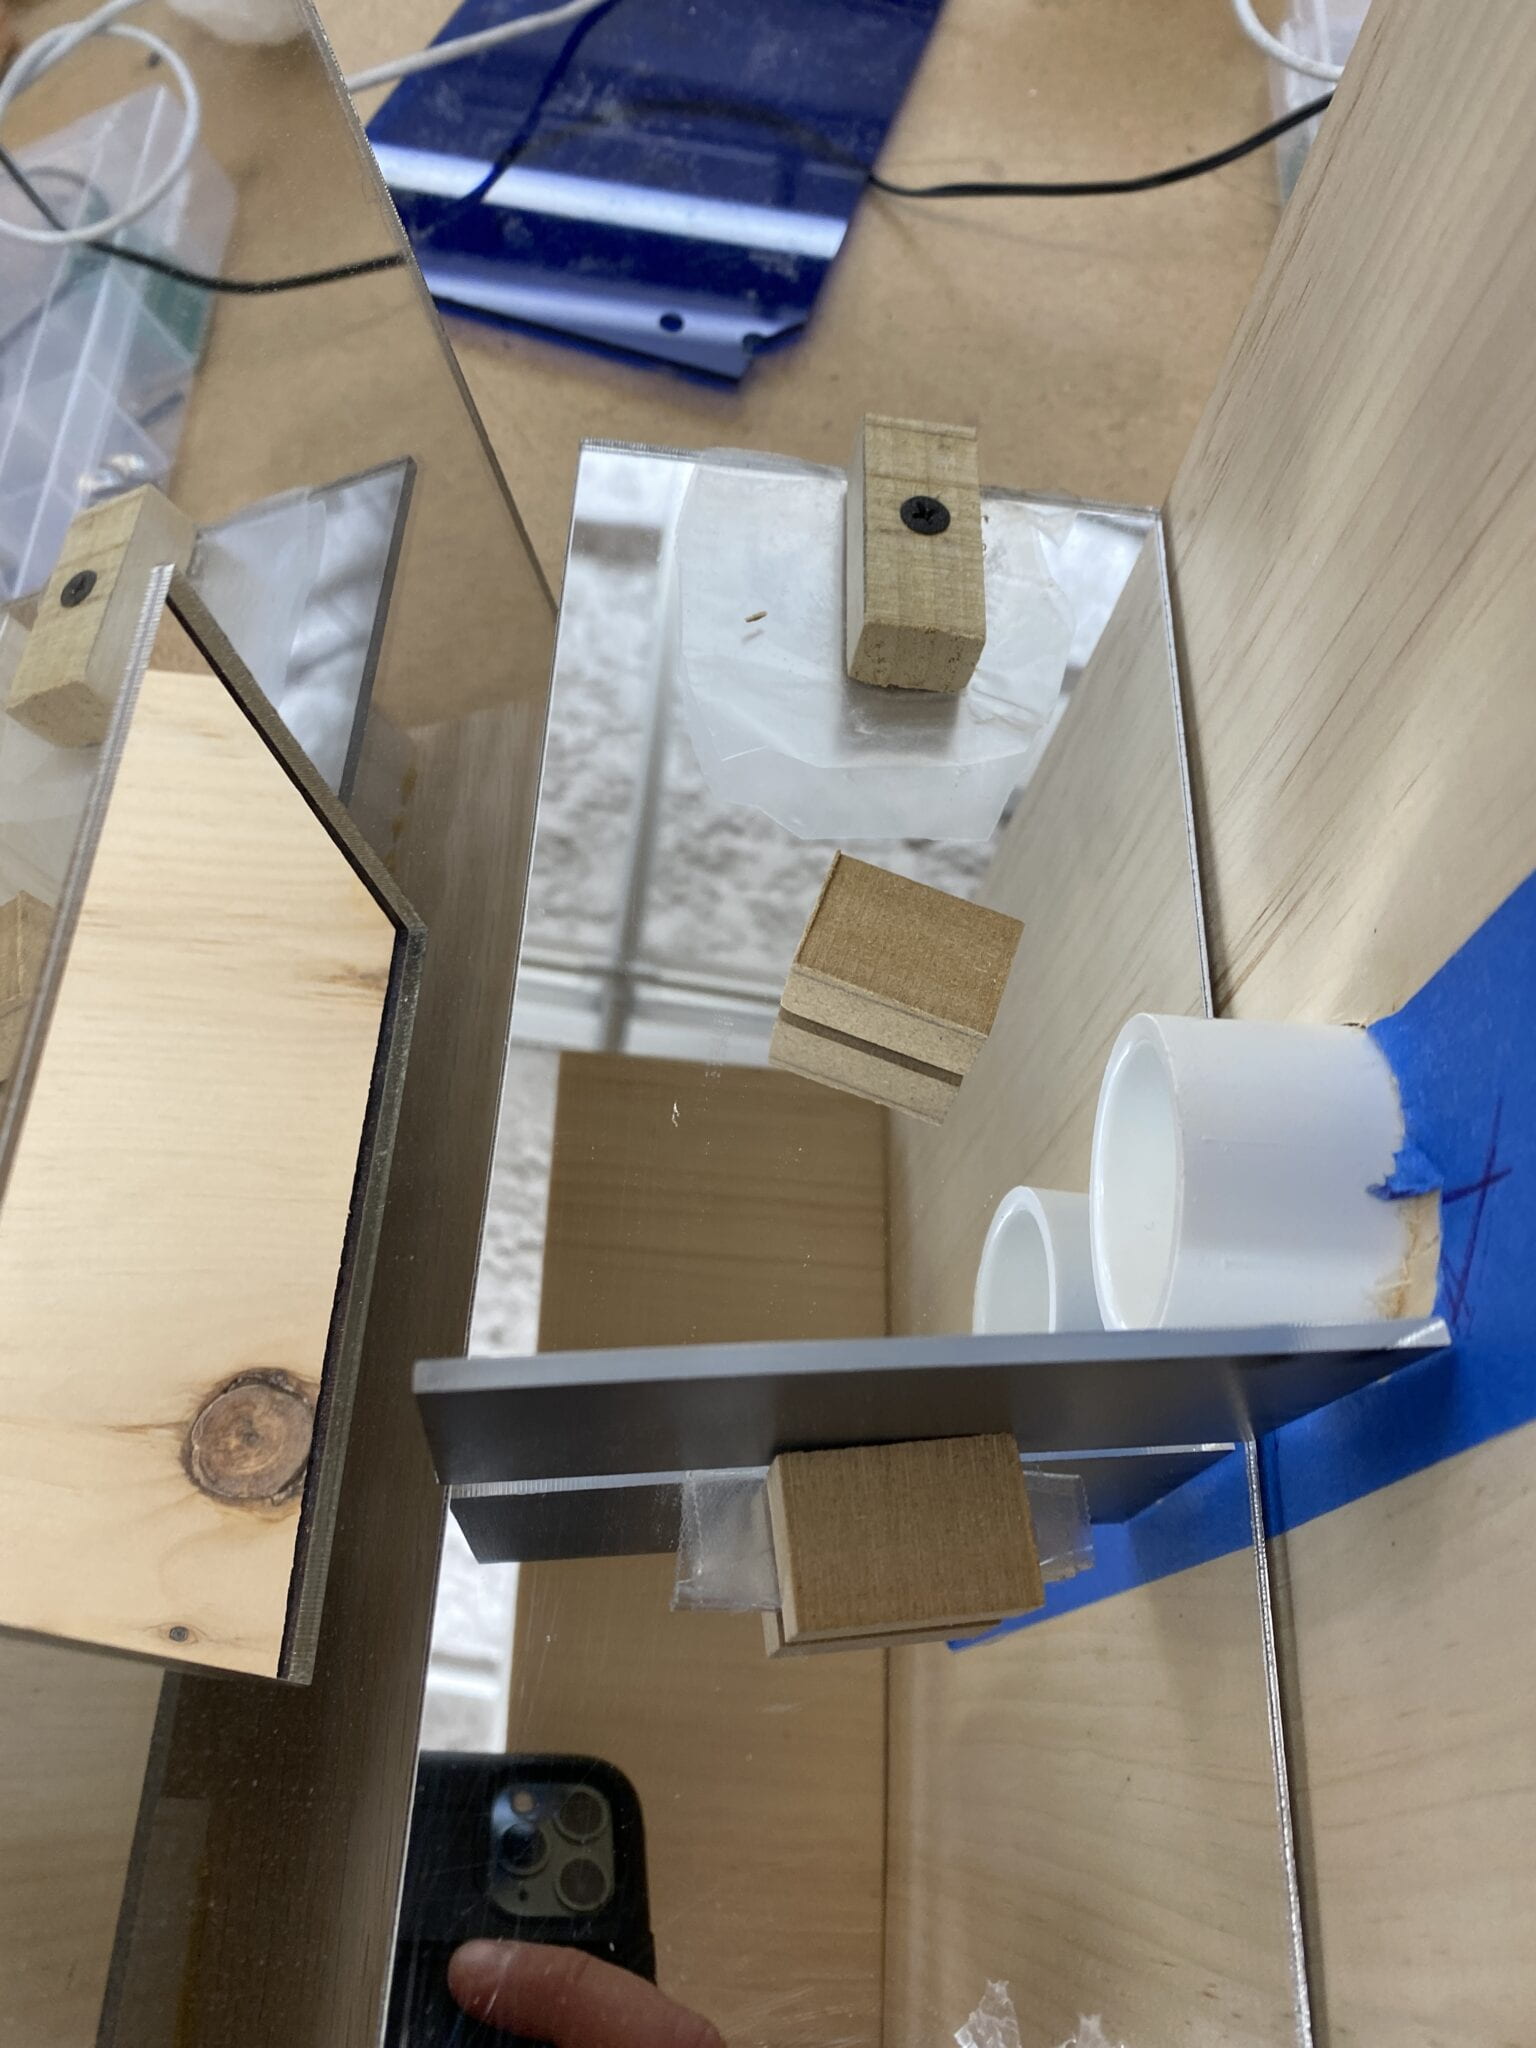
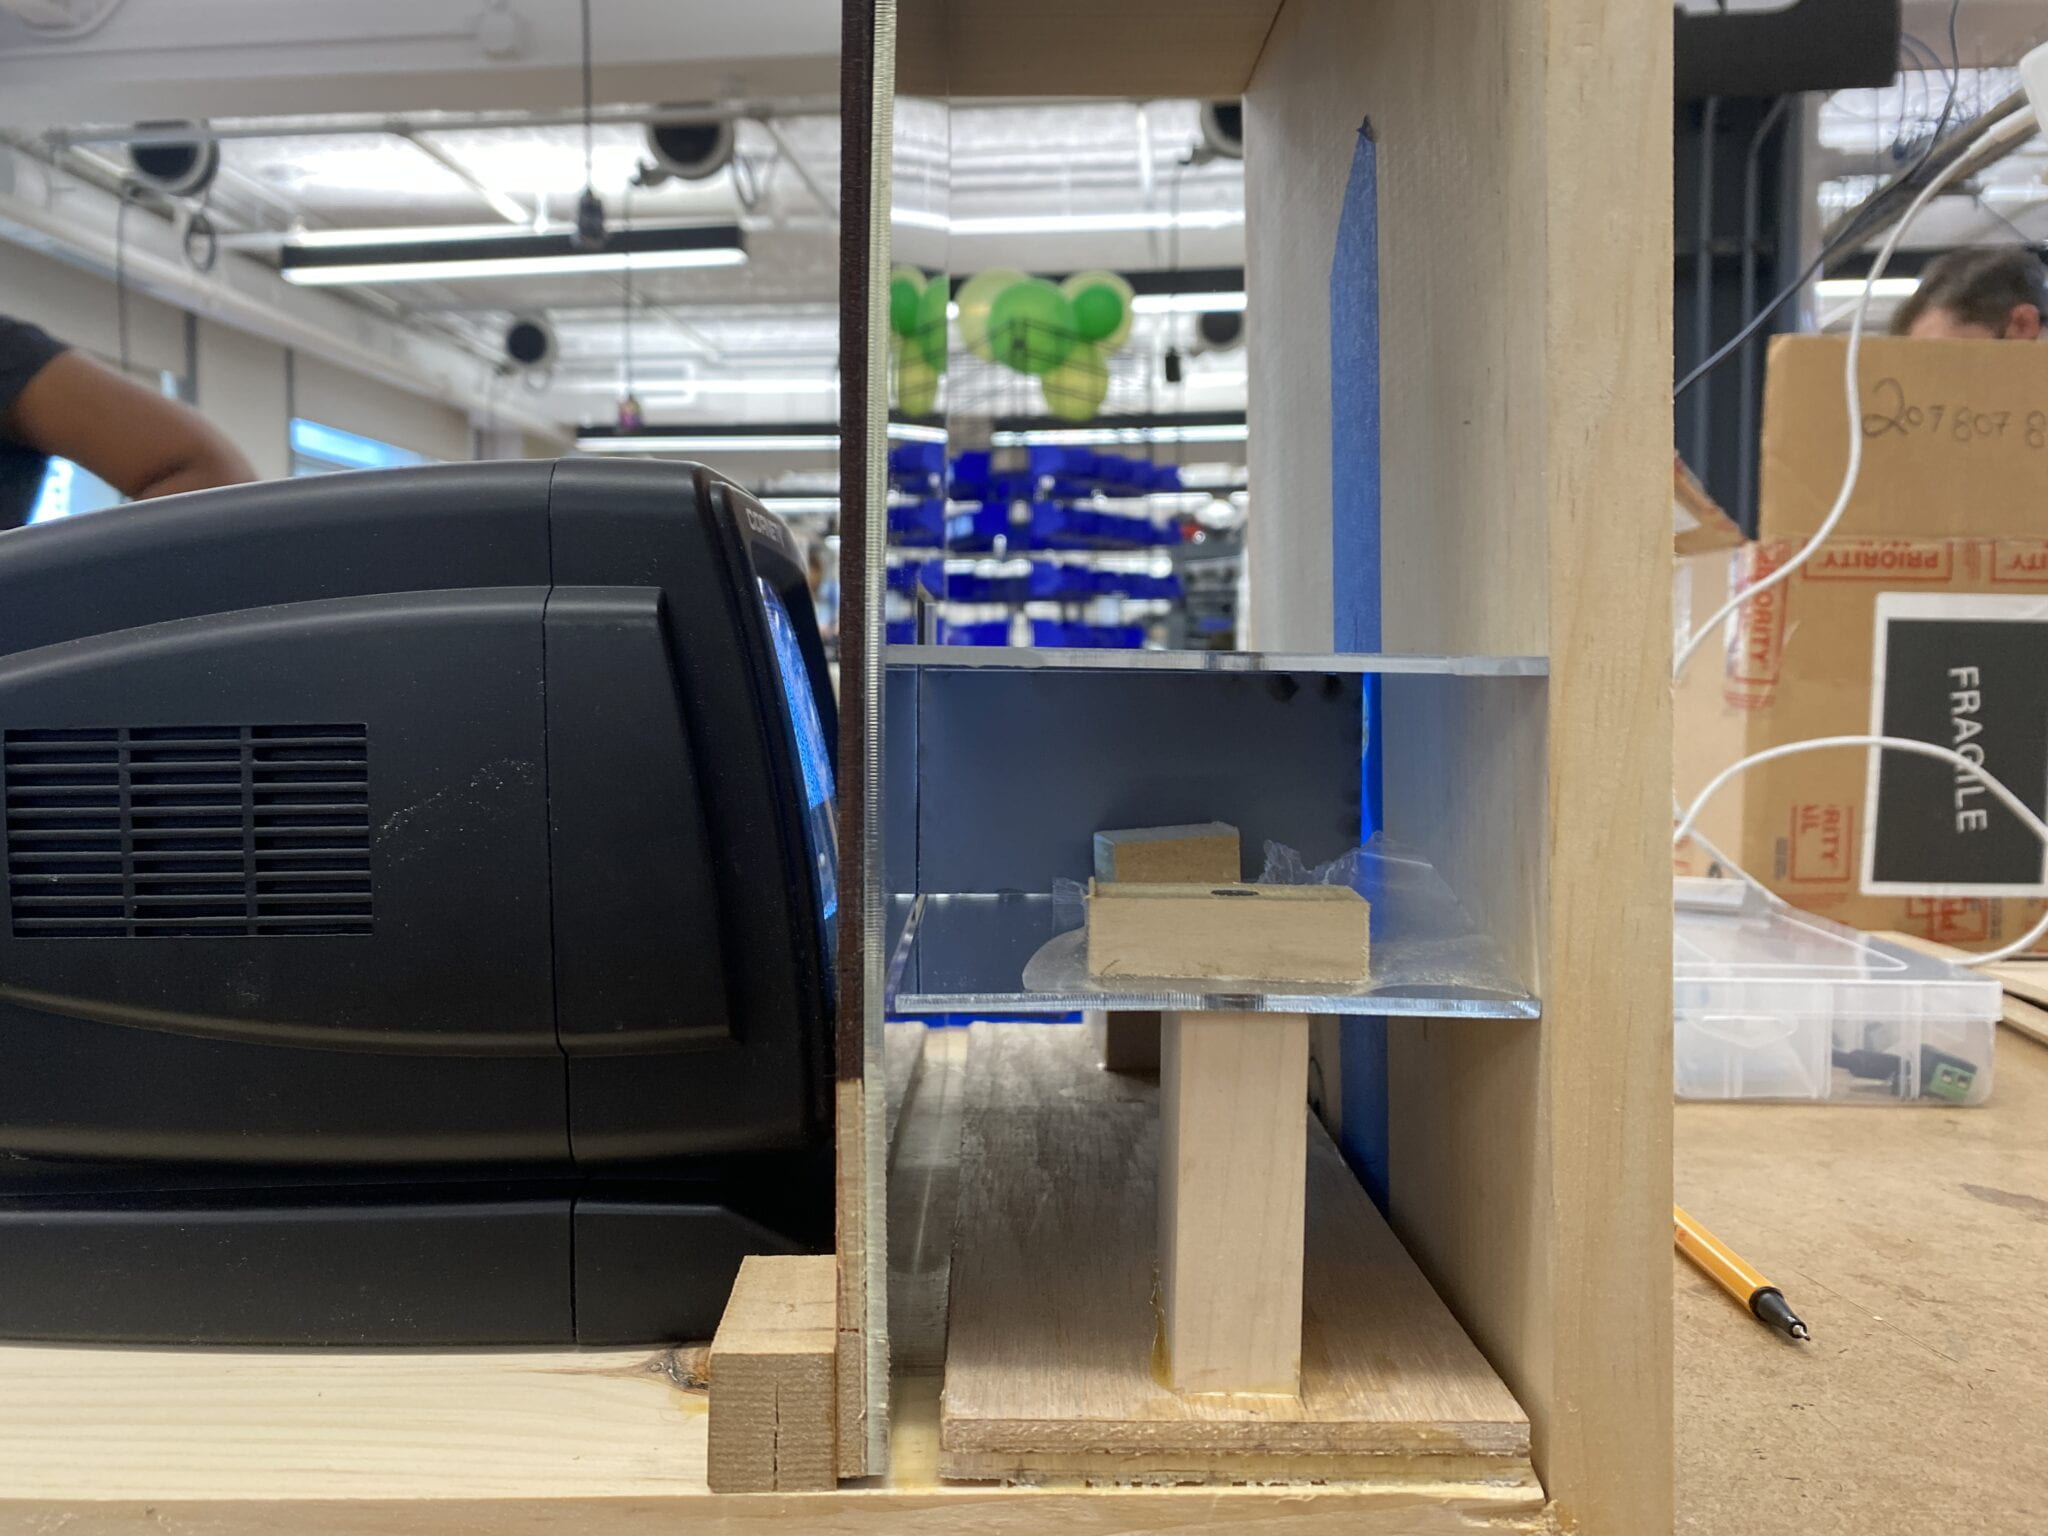
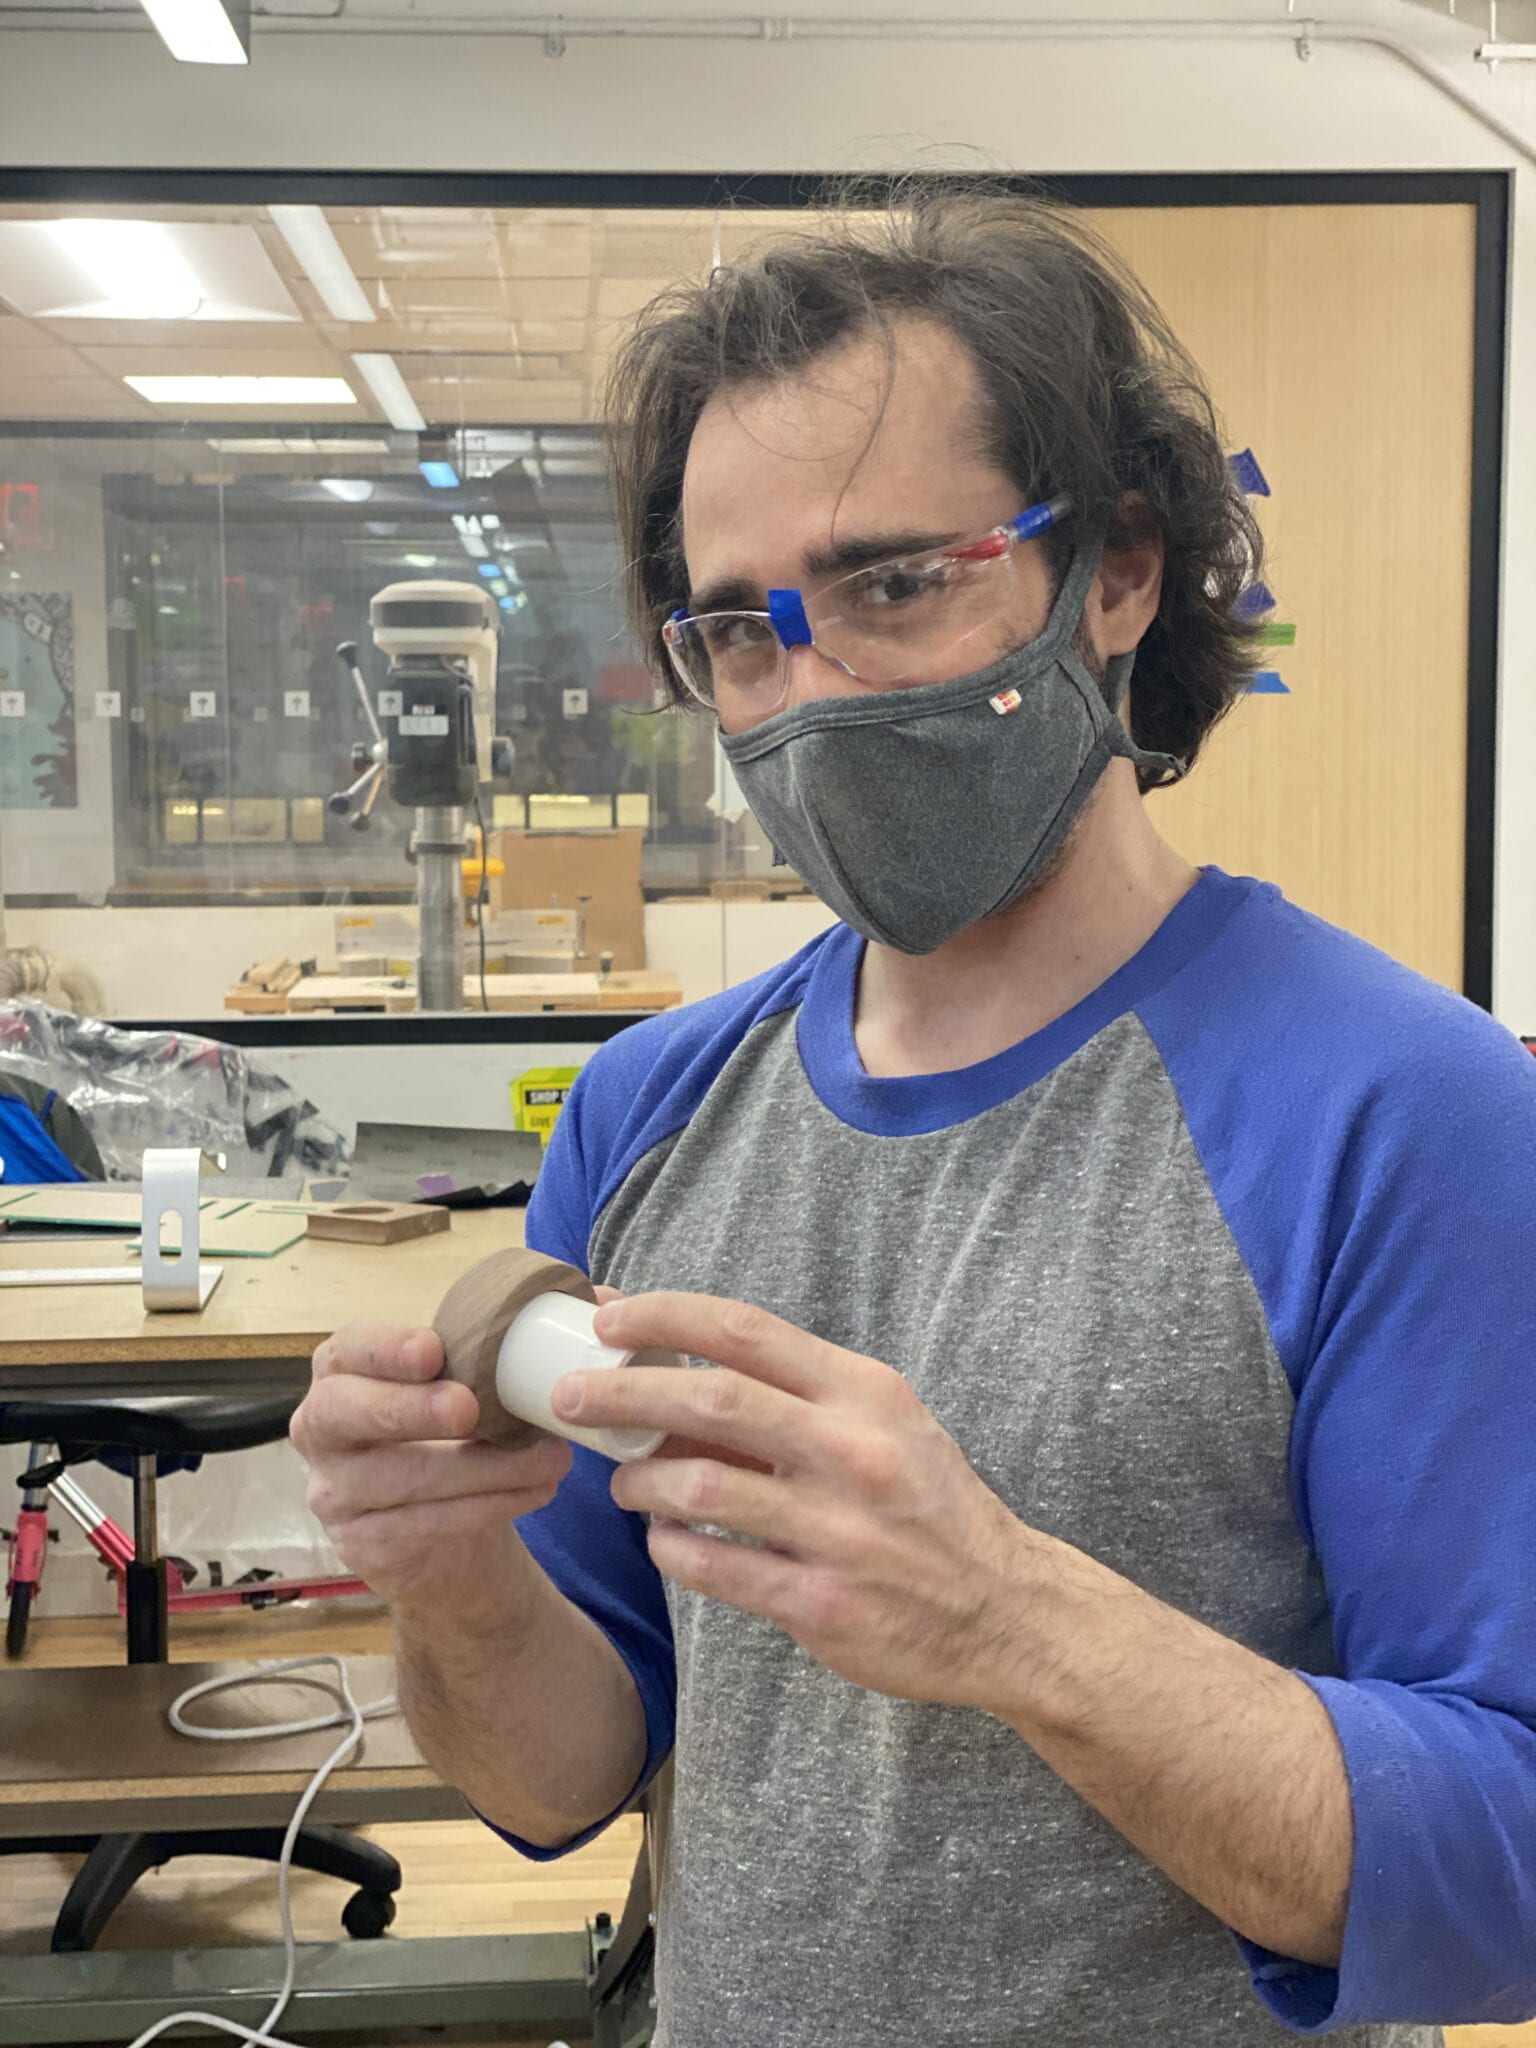
Below are some construction and process images. A huge thank you to Eric Kelab for helping me construct the walnut peephole. 

Sculpture Constructionr Sculpture Construction

Sculpture Construction

Sculpture Construction

Sculpture Construction


Time Final

I’m tossing around two ideas for my final project. 

The first idea is a solar-powered television, set to a static channel. I find it fascinating that 1% of the static on old television screens is the leftover glow from the big bang. To power, the display with the sun seems to be fitting. I would build a custom housing to place the television in and leave it permanently on a static channel playing the most incredible show on earth. 

Reference article here

My second idea is to carve a globe on the lathe. I’m thinking of creating two bowls that can fit together inside the bowls will be the circuit to power a light. The light will rotate around the globe like the sun. 

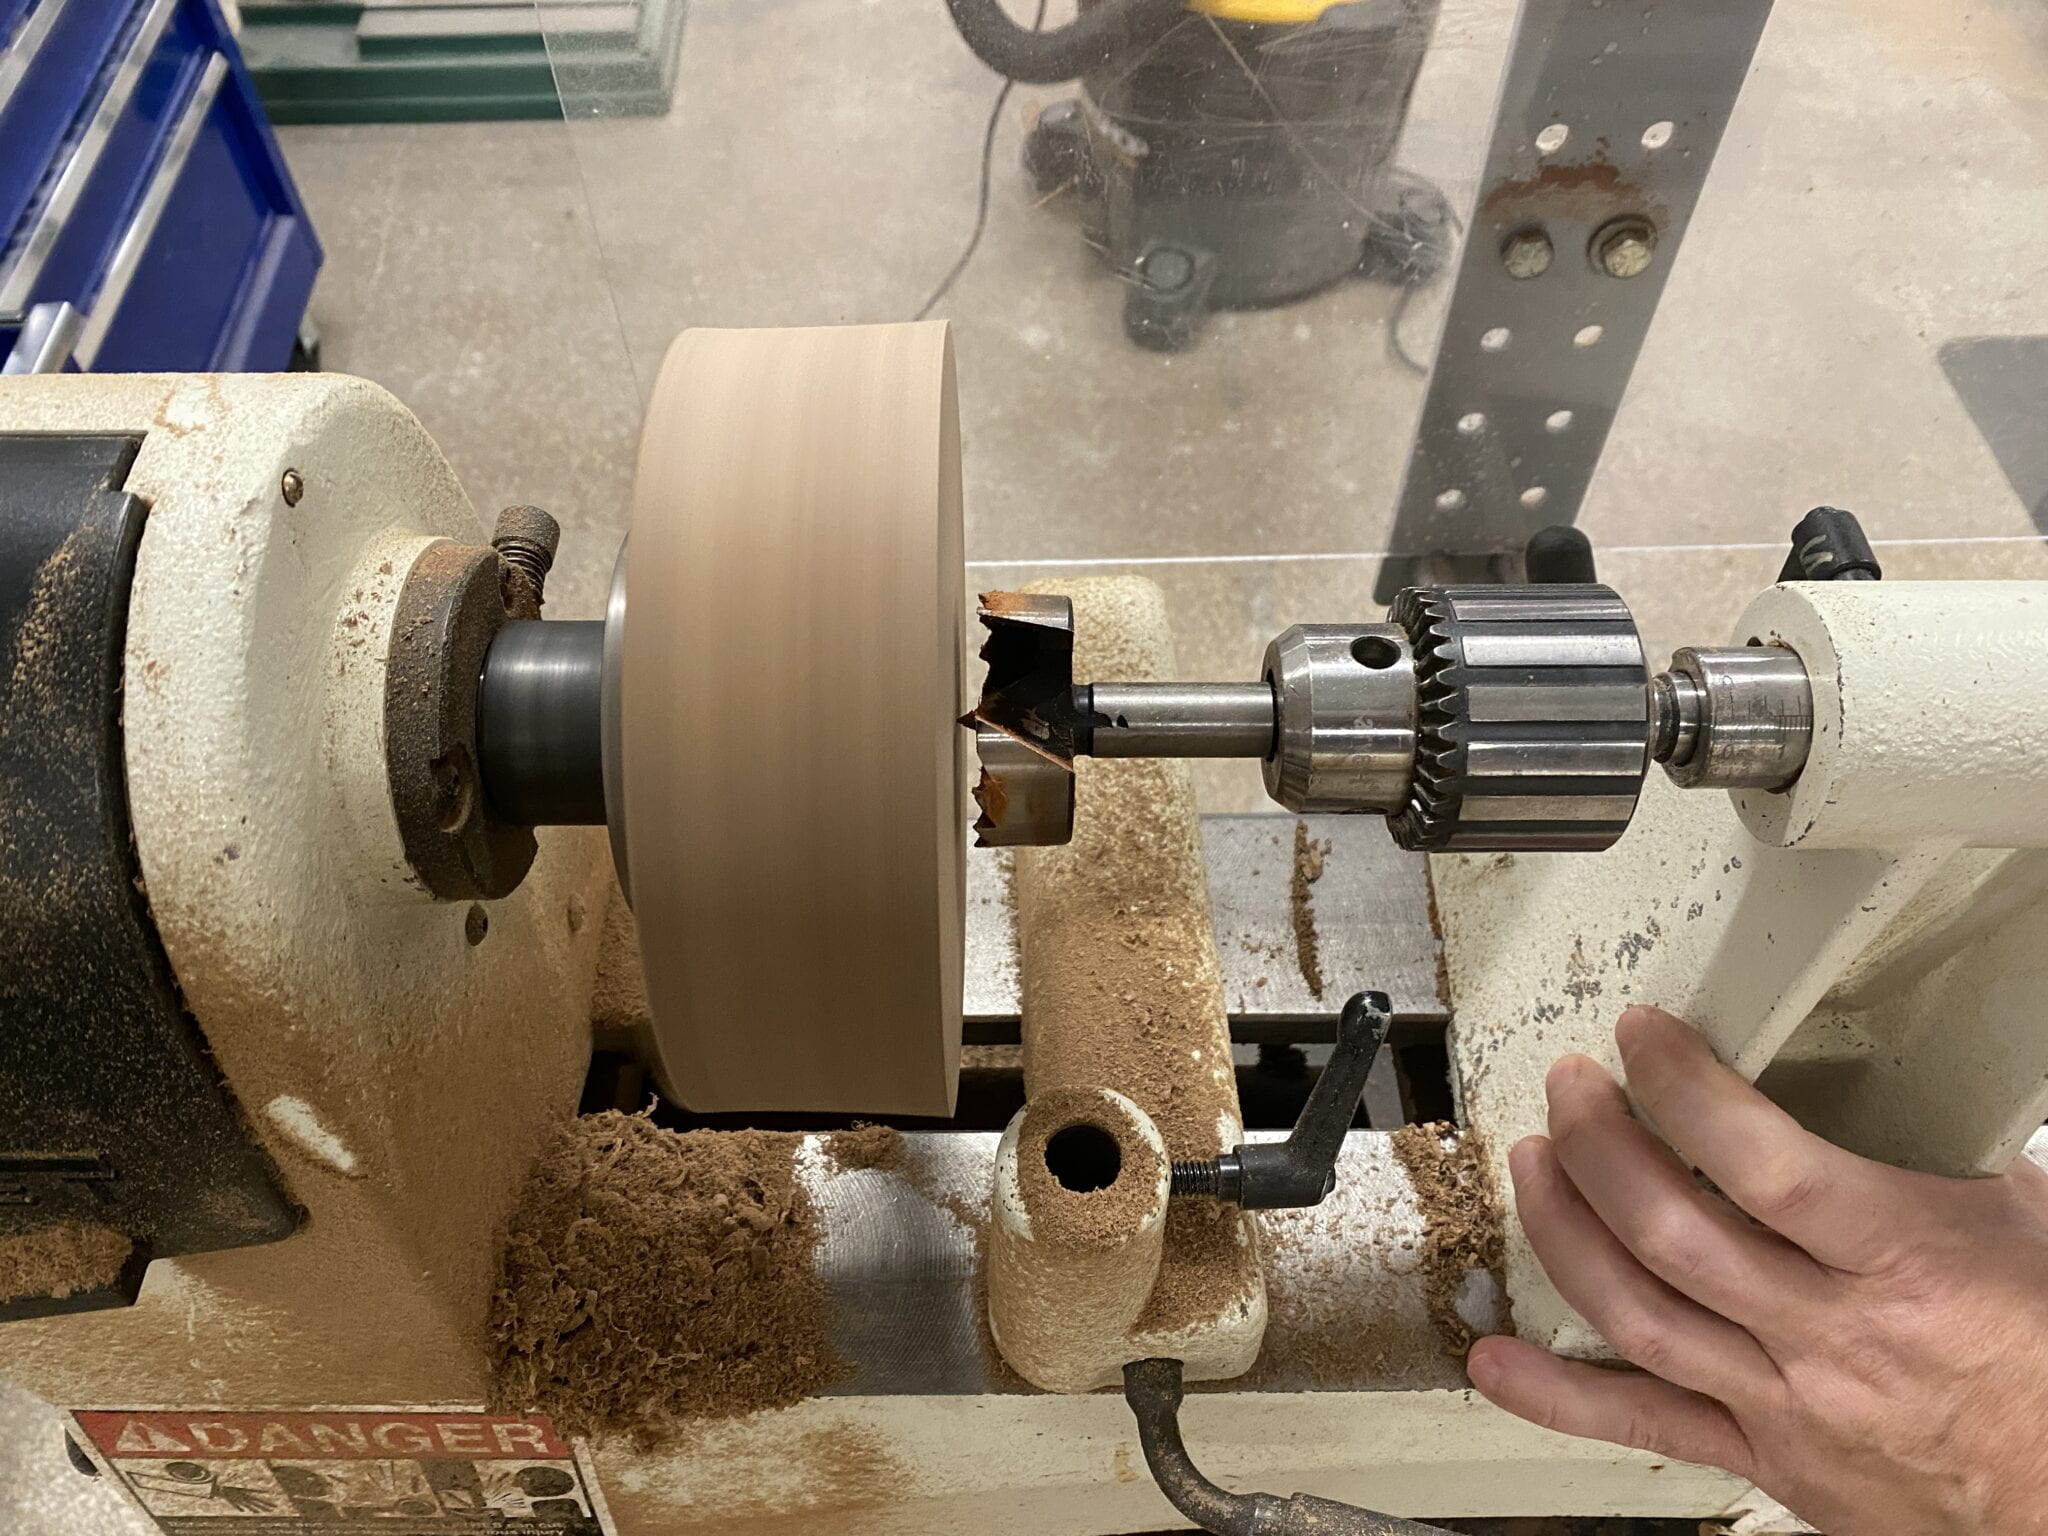
I started testing my lathe skills today and like the results.

turning wood on a lathe

Sketch 4

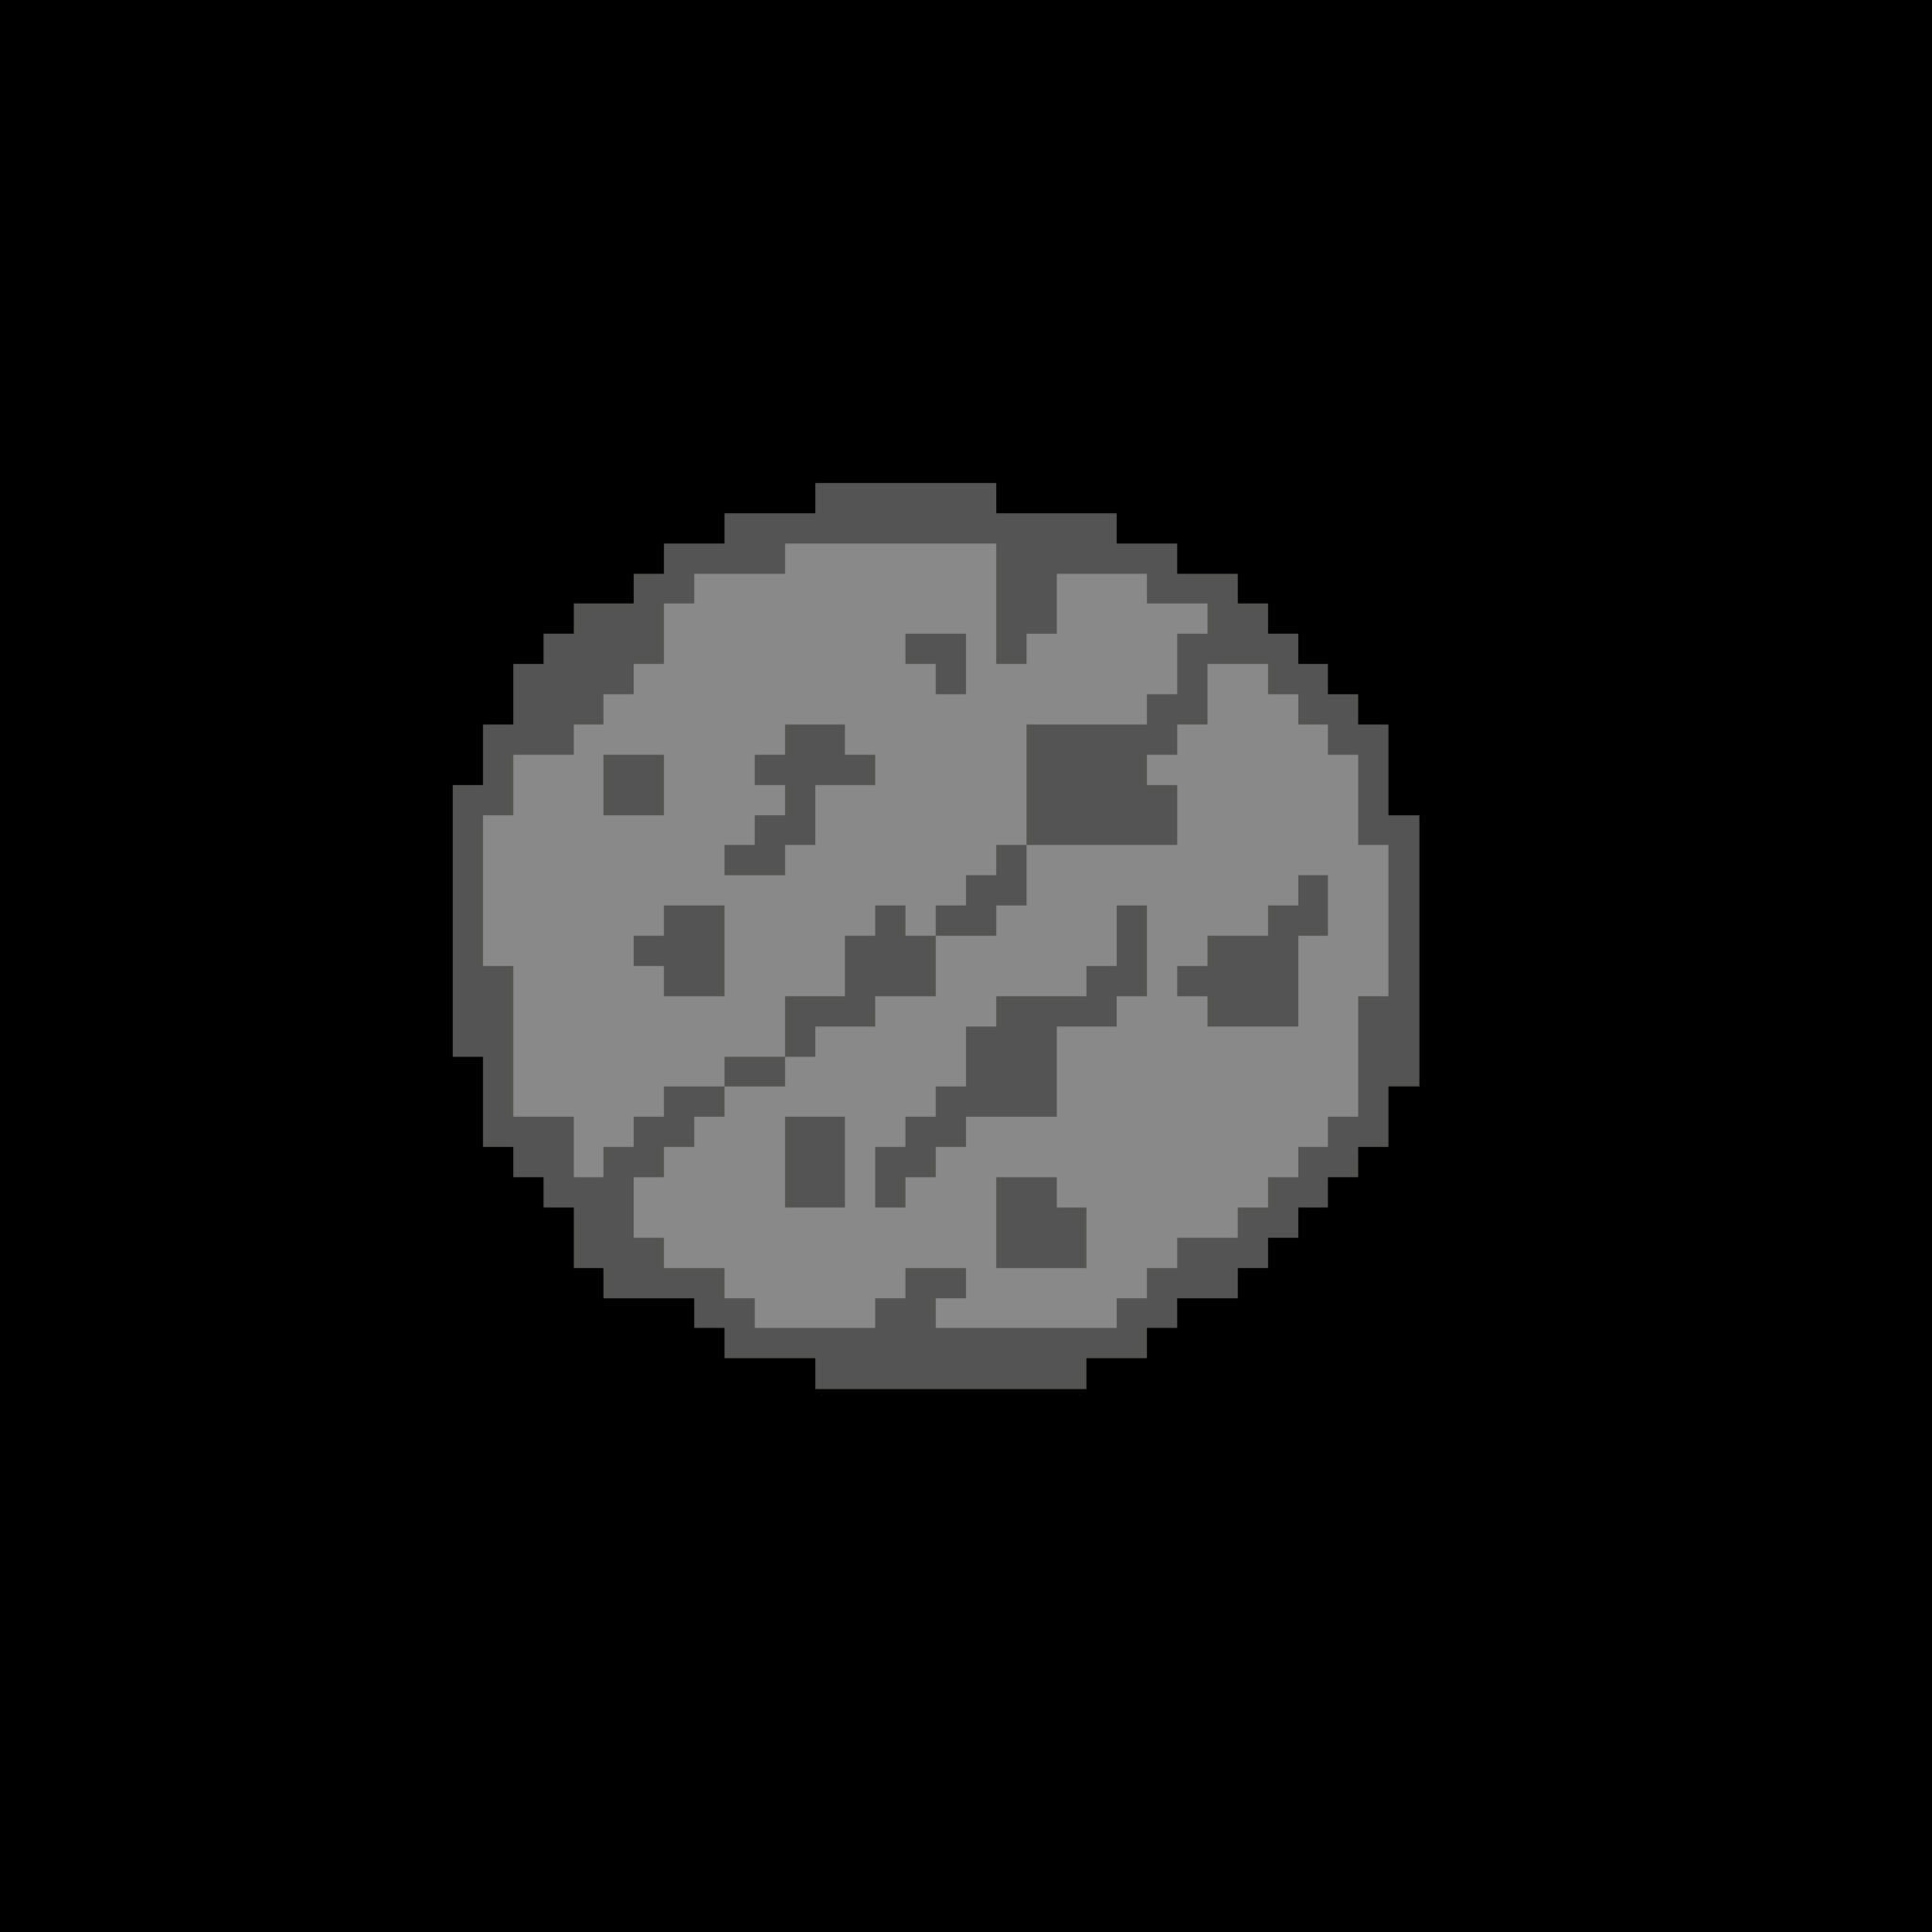
This sketch escalated quickly! I have been toying around with the idea of pixel art. I love the simple aesthetic. I was drawing the other day and thought how pixel art might be a fun way to represent the sun and planets in our solar system. The blurred, fractured surfaces of my sketches reminded me of looking at the stars through an old telescope I had as a child. While drawing the planets, I got to thinking about traveling to each one and the vast open space that is space. This led me to do a little research on the distance between each planet. I found this fun calculator. The lengths are insane and difficult to wrap my head around to make it more manageable; I decided to make a “short” film of traveling through space. I calculated out 100,000 miles for every second of time. When it was all said and done, I have an 8 + hour-long piece. I’m still shocked at the magnitude of the solar system, but this sketch helped me wrap my head around the time it would take to explore it. Below are the pixel art sketches if you don’t have 8 hours to watch the film. 


pixel art of a planet

Sun

pixel art of a planet

Mercury

pixel art of a planet

Venus

pixel art of a planet

Earth

pixel art of a planet

Mars

pixel art of a planet

Jupiter

pixel art of a planet

Saturn

pixel art of a planet

Uranus

pixel art of a planet

Neptune


Time – Extinction Clock

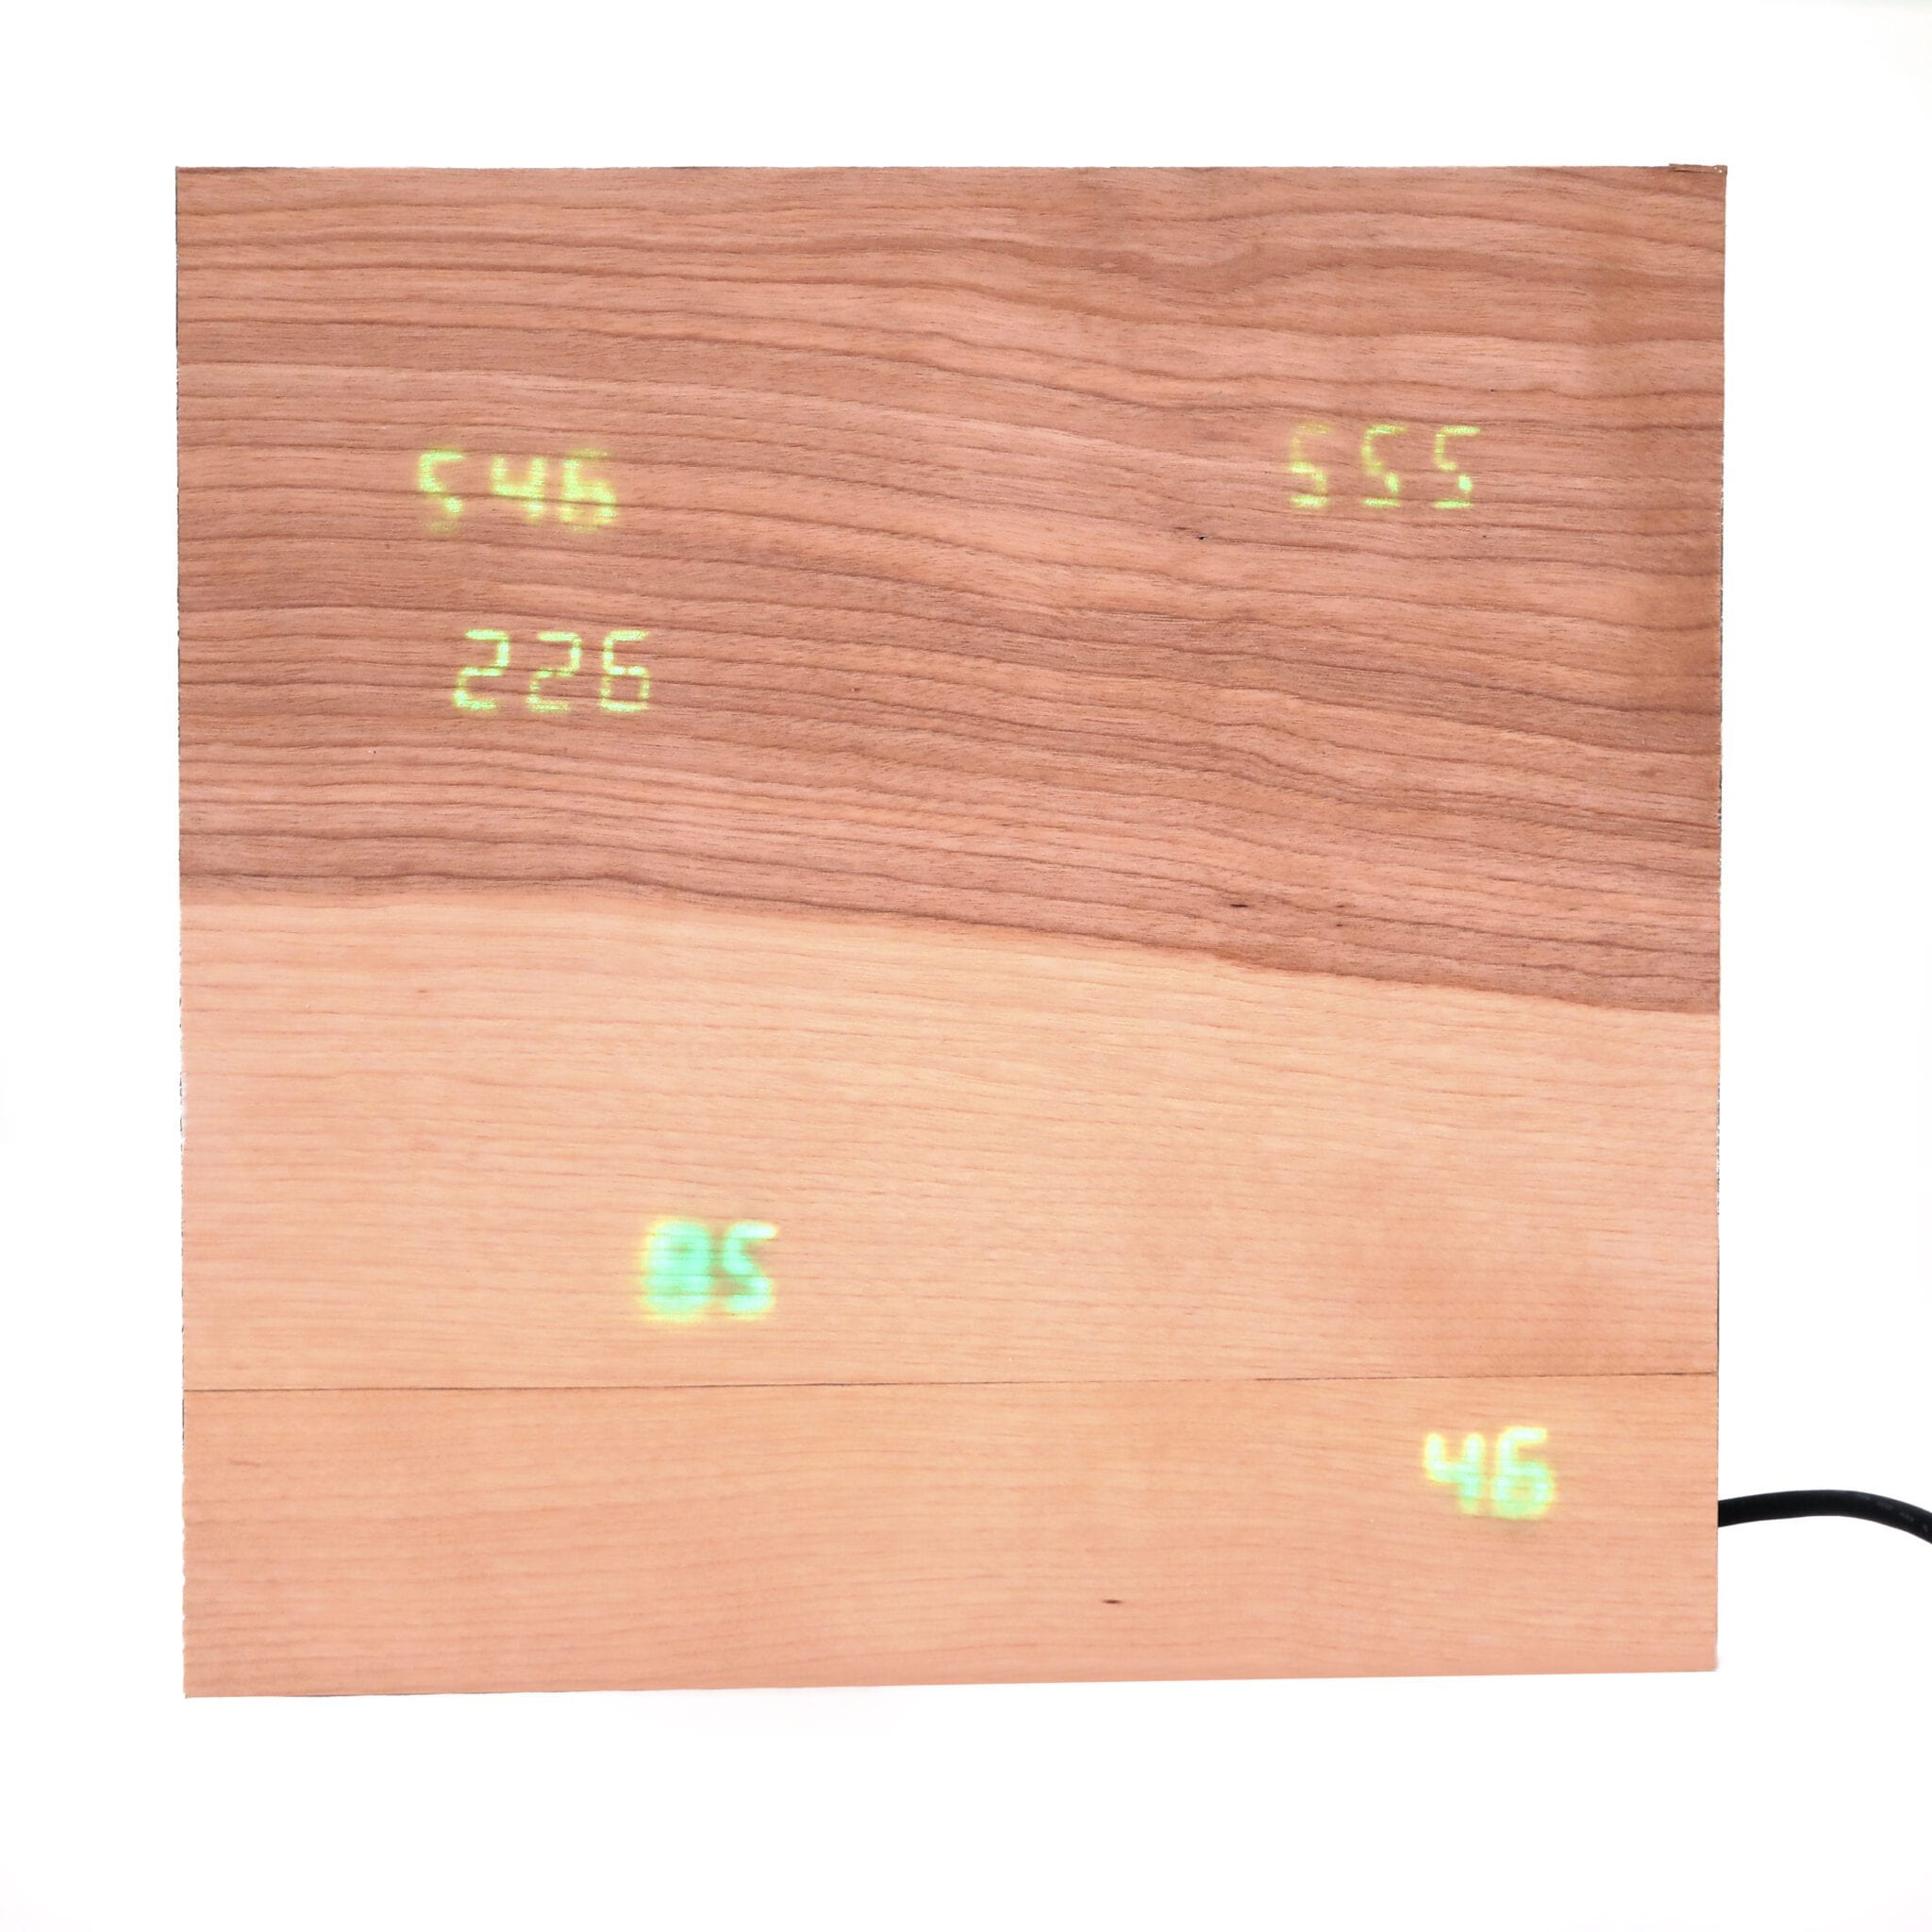
Extinction Clock presents a segment of threatened and endangered species data produced by the IUCN Red List, a non-profit organization founded in 1964 that makes a “comprehensive inventory of the global conservation status of biological species.” – IUCN. 

For this piece, I am focusing on mammals data. 

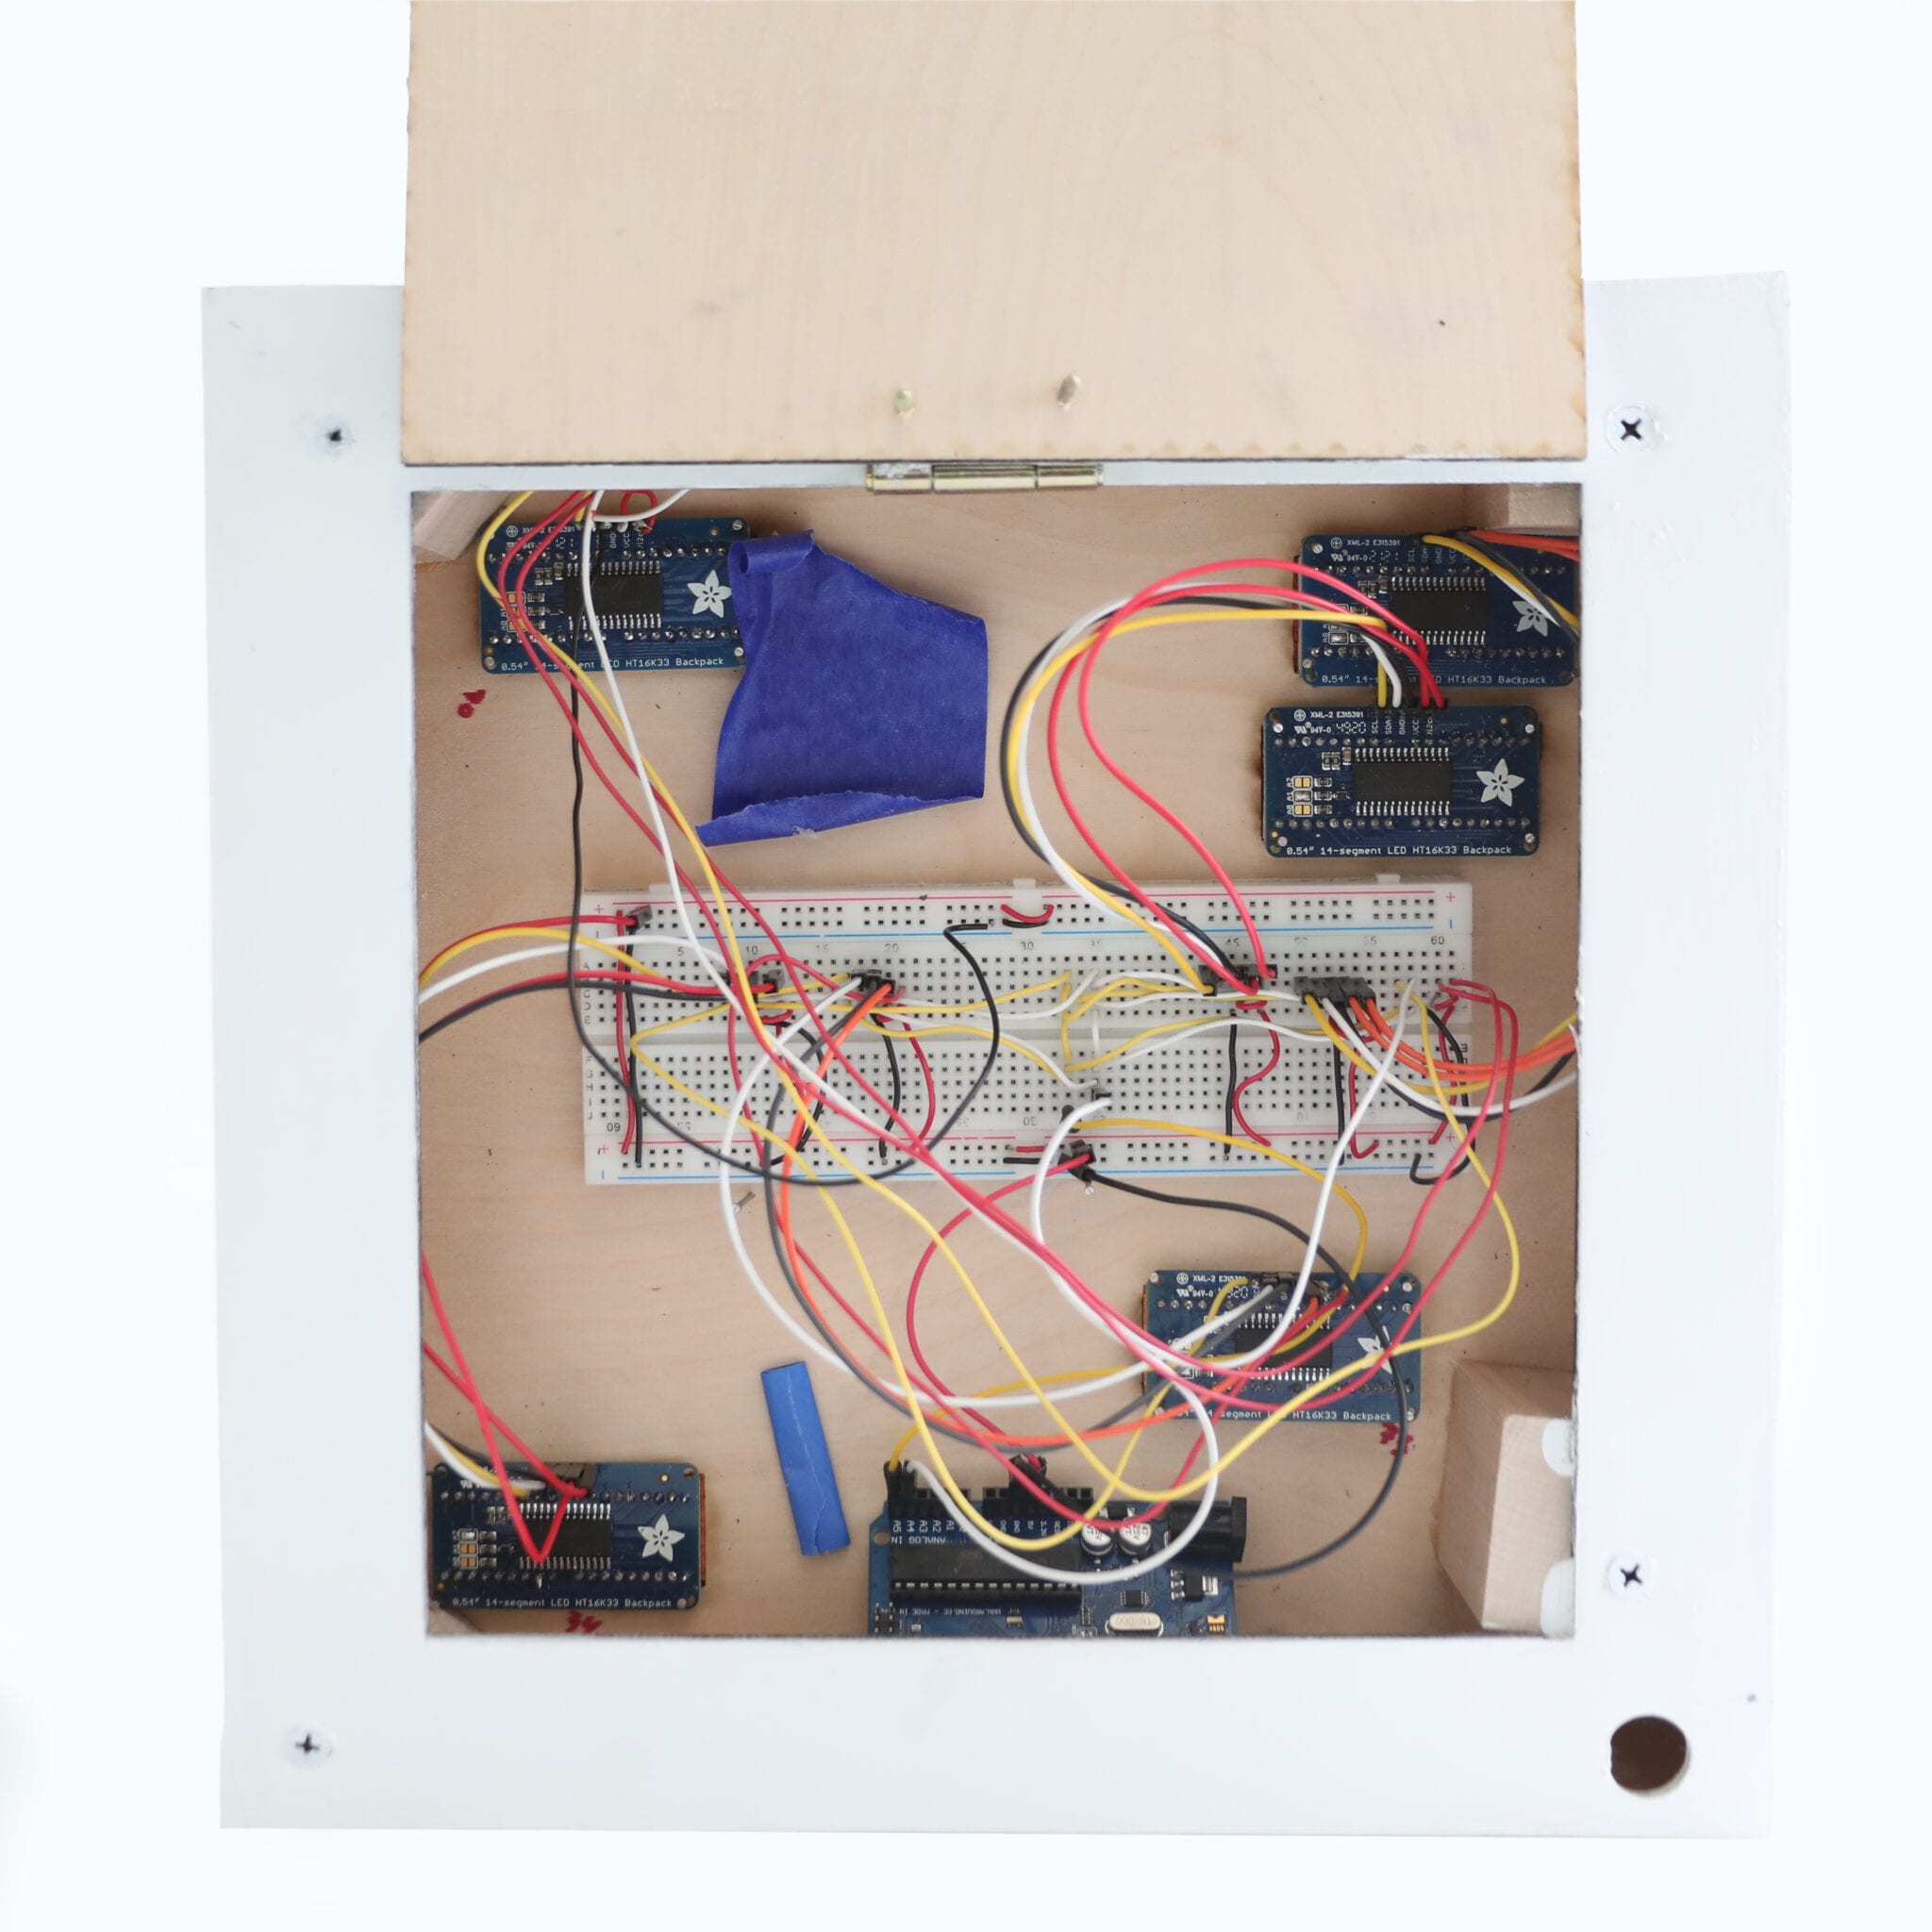
The clock is broken into five faces: 

  • Vulnerable Mammals
  • Endangered Mammals
  • Critically Endangered Mammals
  • Extinct Mammals (since the last update)
  • Days until the list is updated

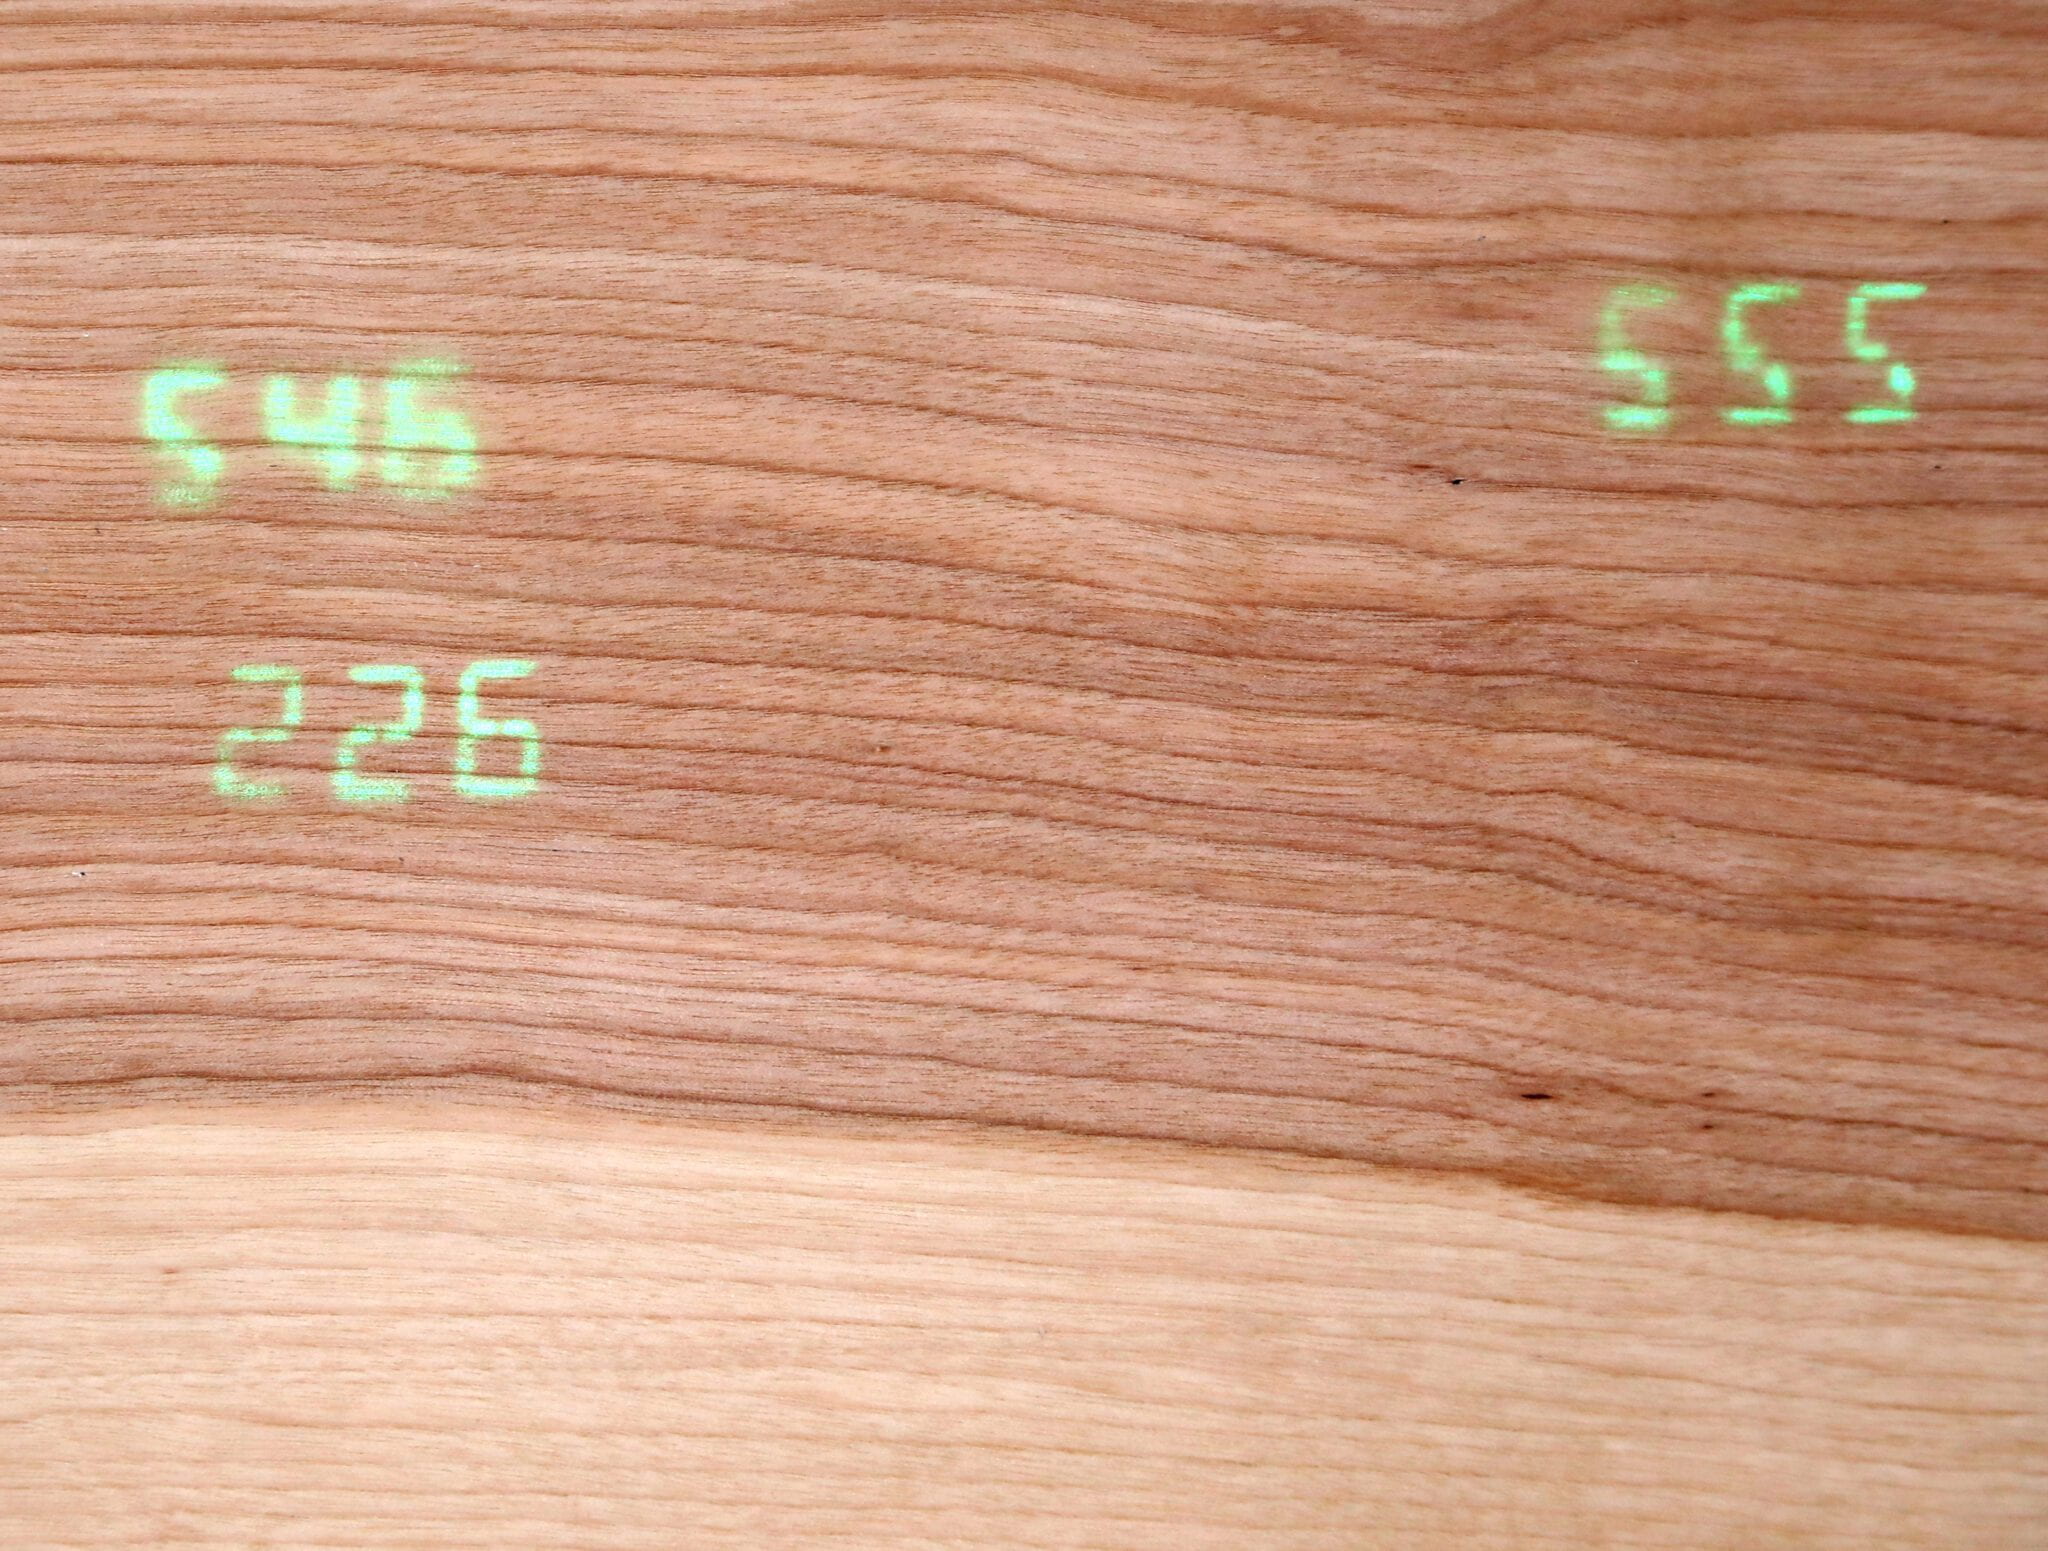
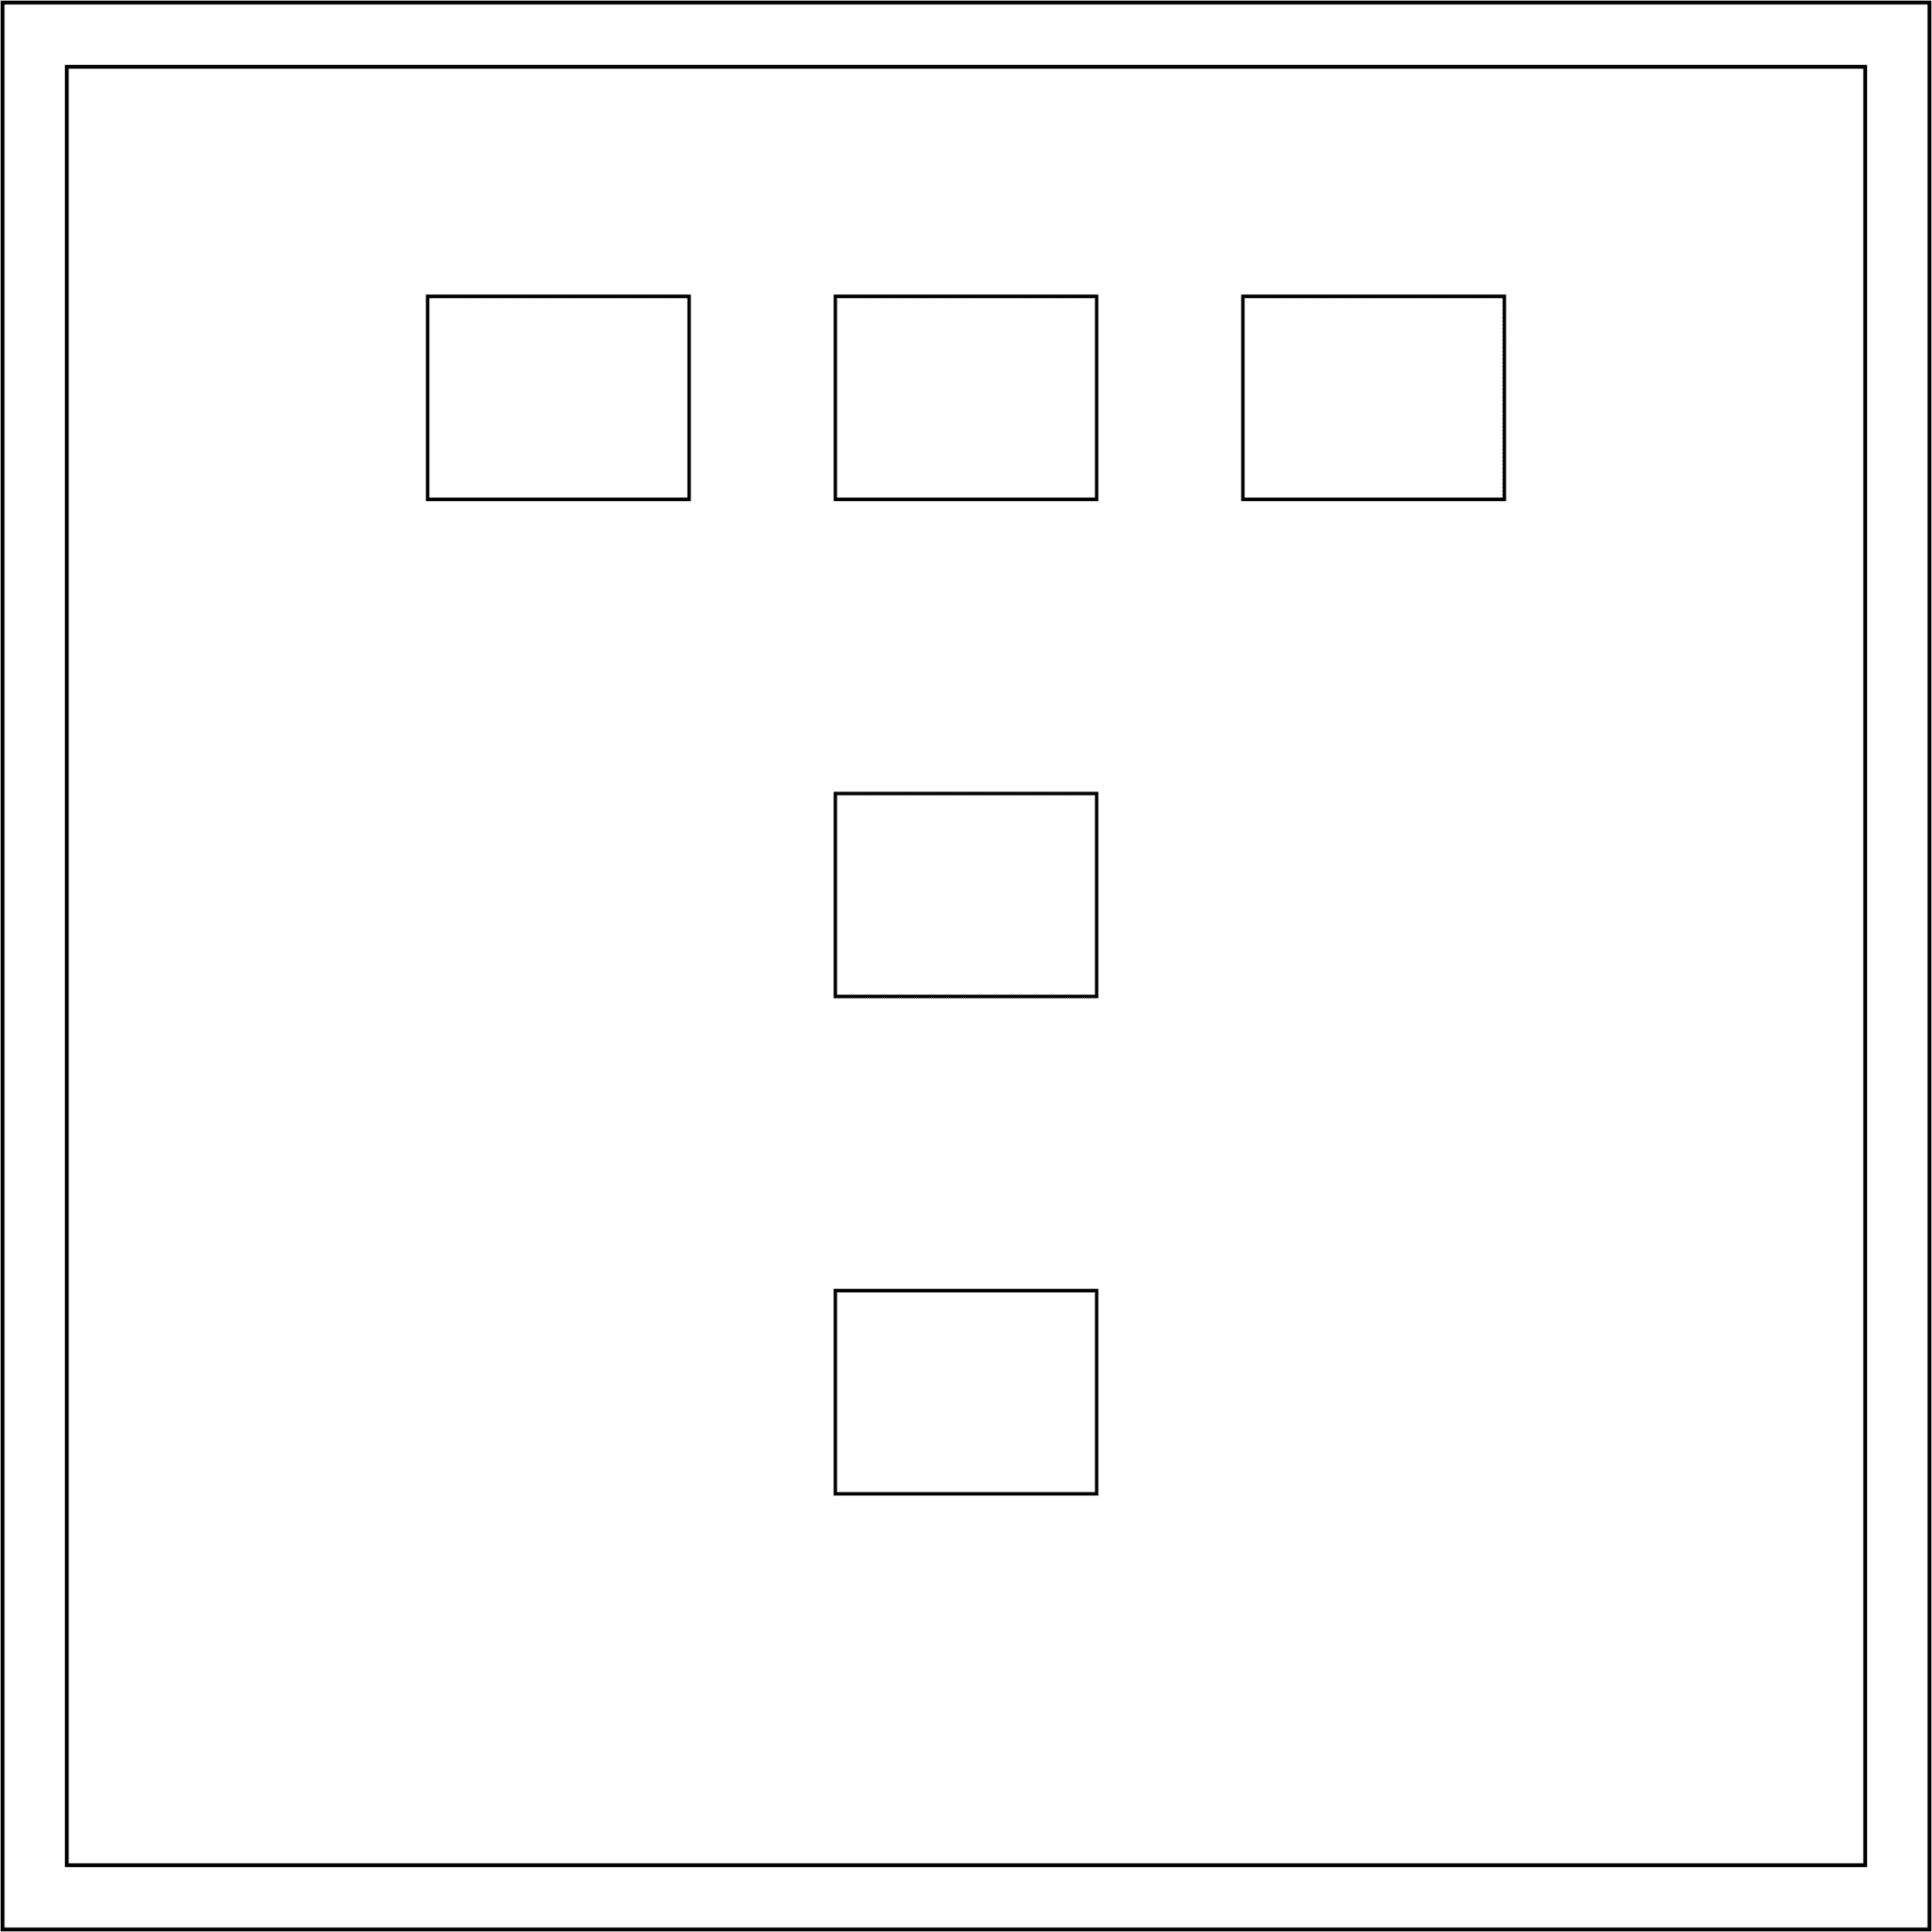
The combined surface area of the clock faces makes up 23% of the overall clock face. This represents a new study stating that only 23% of land remains “wild”, excluding Antarctica. According to the survey, this remaining wildland is primarily concentrated in Canada, the United States, Russia, Brazil, and Australia. The placement of the faces loosely represents the location of these countries on a flat map. 

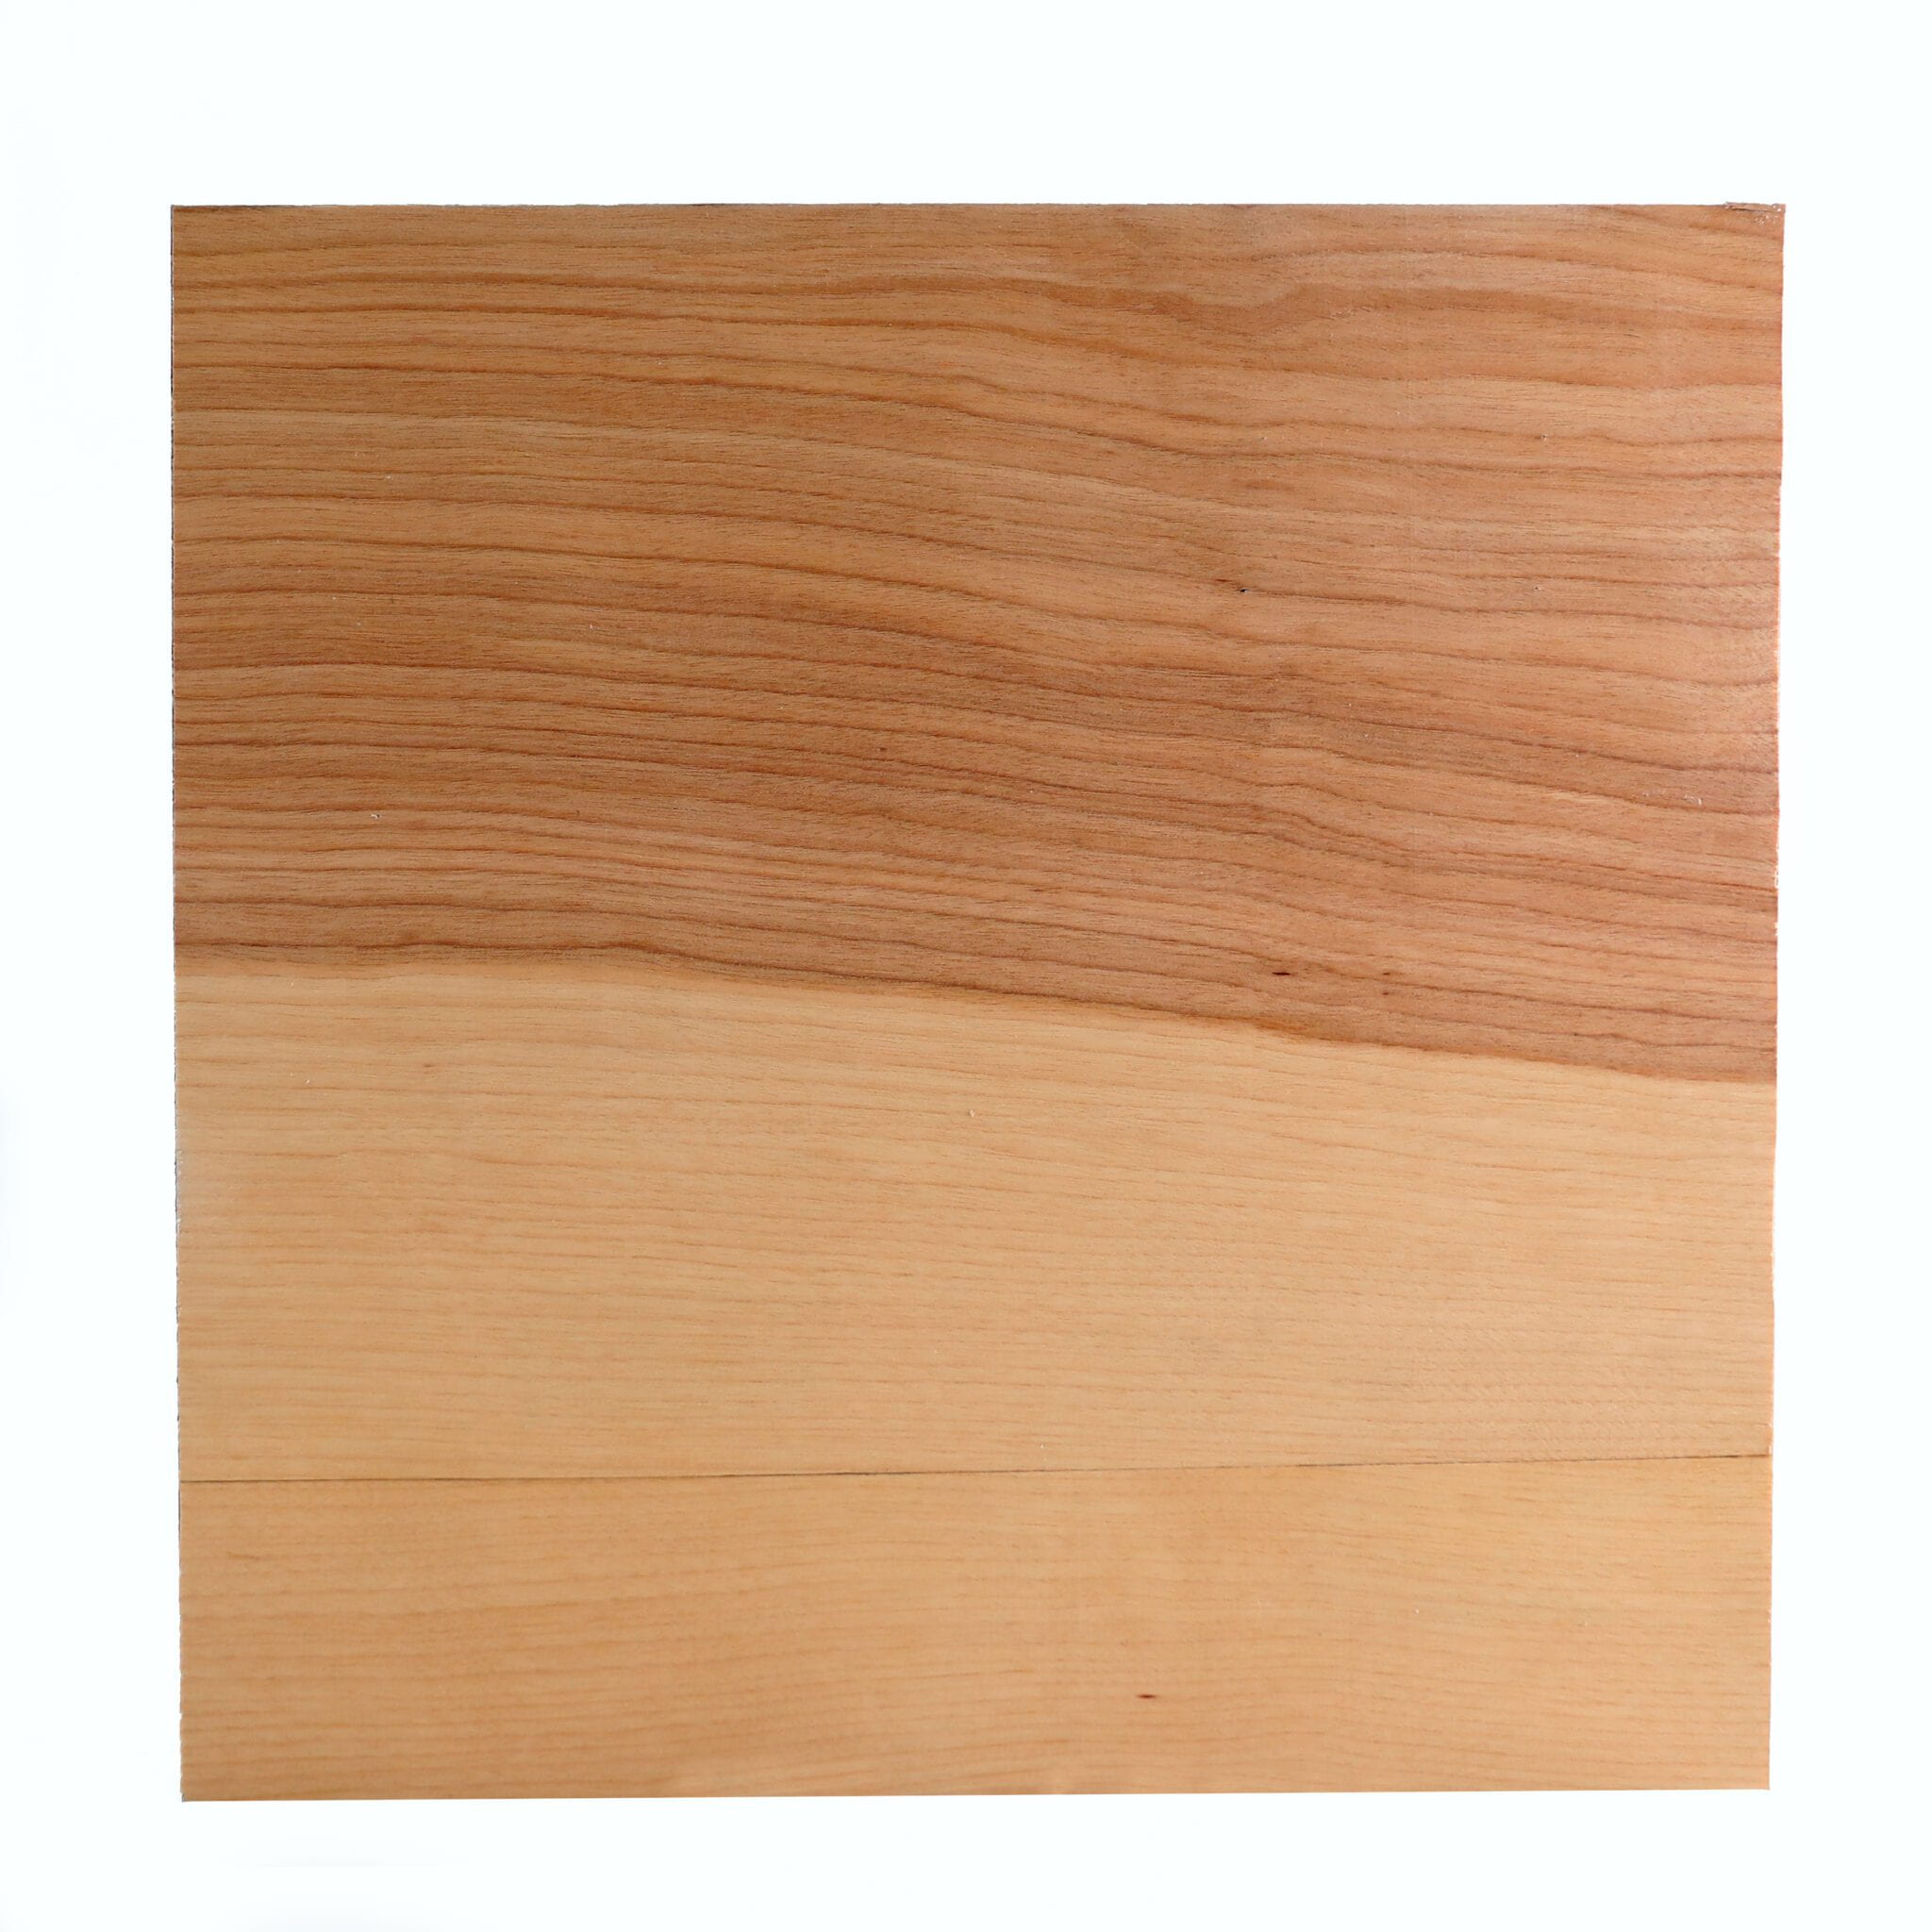
A thin layer of wood veneer obscures the digital faces. This was both an aesthetic decision and to explore the idea that humans can easily overlook the continued and rapidly increasing extinction of species without conscious actions. 

The clock was intentionally left to be obscure to encourage viewers to read its documentation.

Extinction Clock

Extinction Clock

Extinction ClockExtinction Clock

Extinction Clock

Extinction Clock II

Drawing of a circuit


Extinction clock part II: 

I have been thinking a lot about my extinction clock and maintaining simplicity but still share essential information. For this piece, I’ll be using the IUCN Red List of threatened species as a reference. 

The clock will have five screens, all displaying different numbers. 

1 – # of critically endangered mammals in the world
2- # of endangered mammals in the world
3- # of vulnerable mammals in the world
4 – # of extinct mammals since the last count
5- when the list will be updated

The five faces will take up 23% of the clock’s face representing how much “wild” land is left in the world, according to a recent study. 

The placement of the faces is a rough representation of where the 23% is globally US, Canada, Russia, Brazil, Australia.

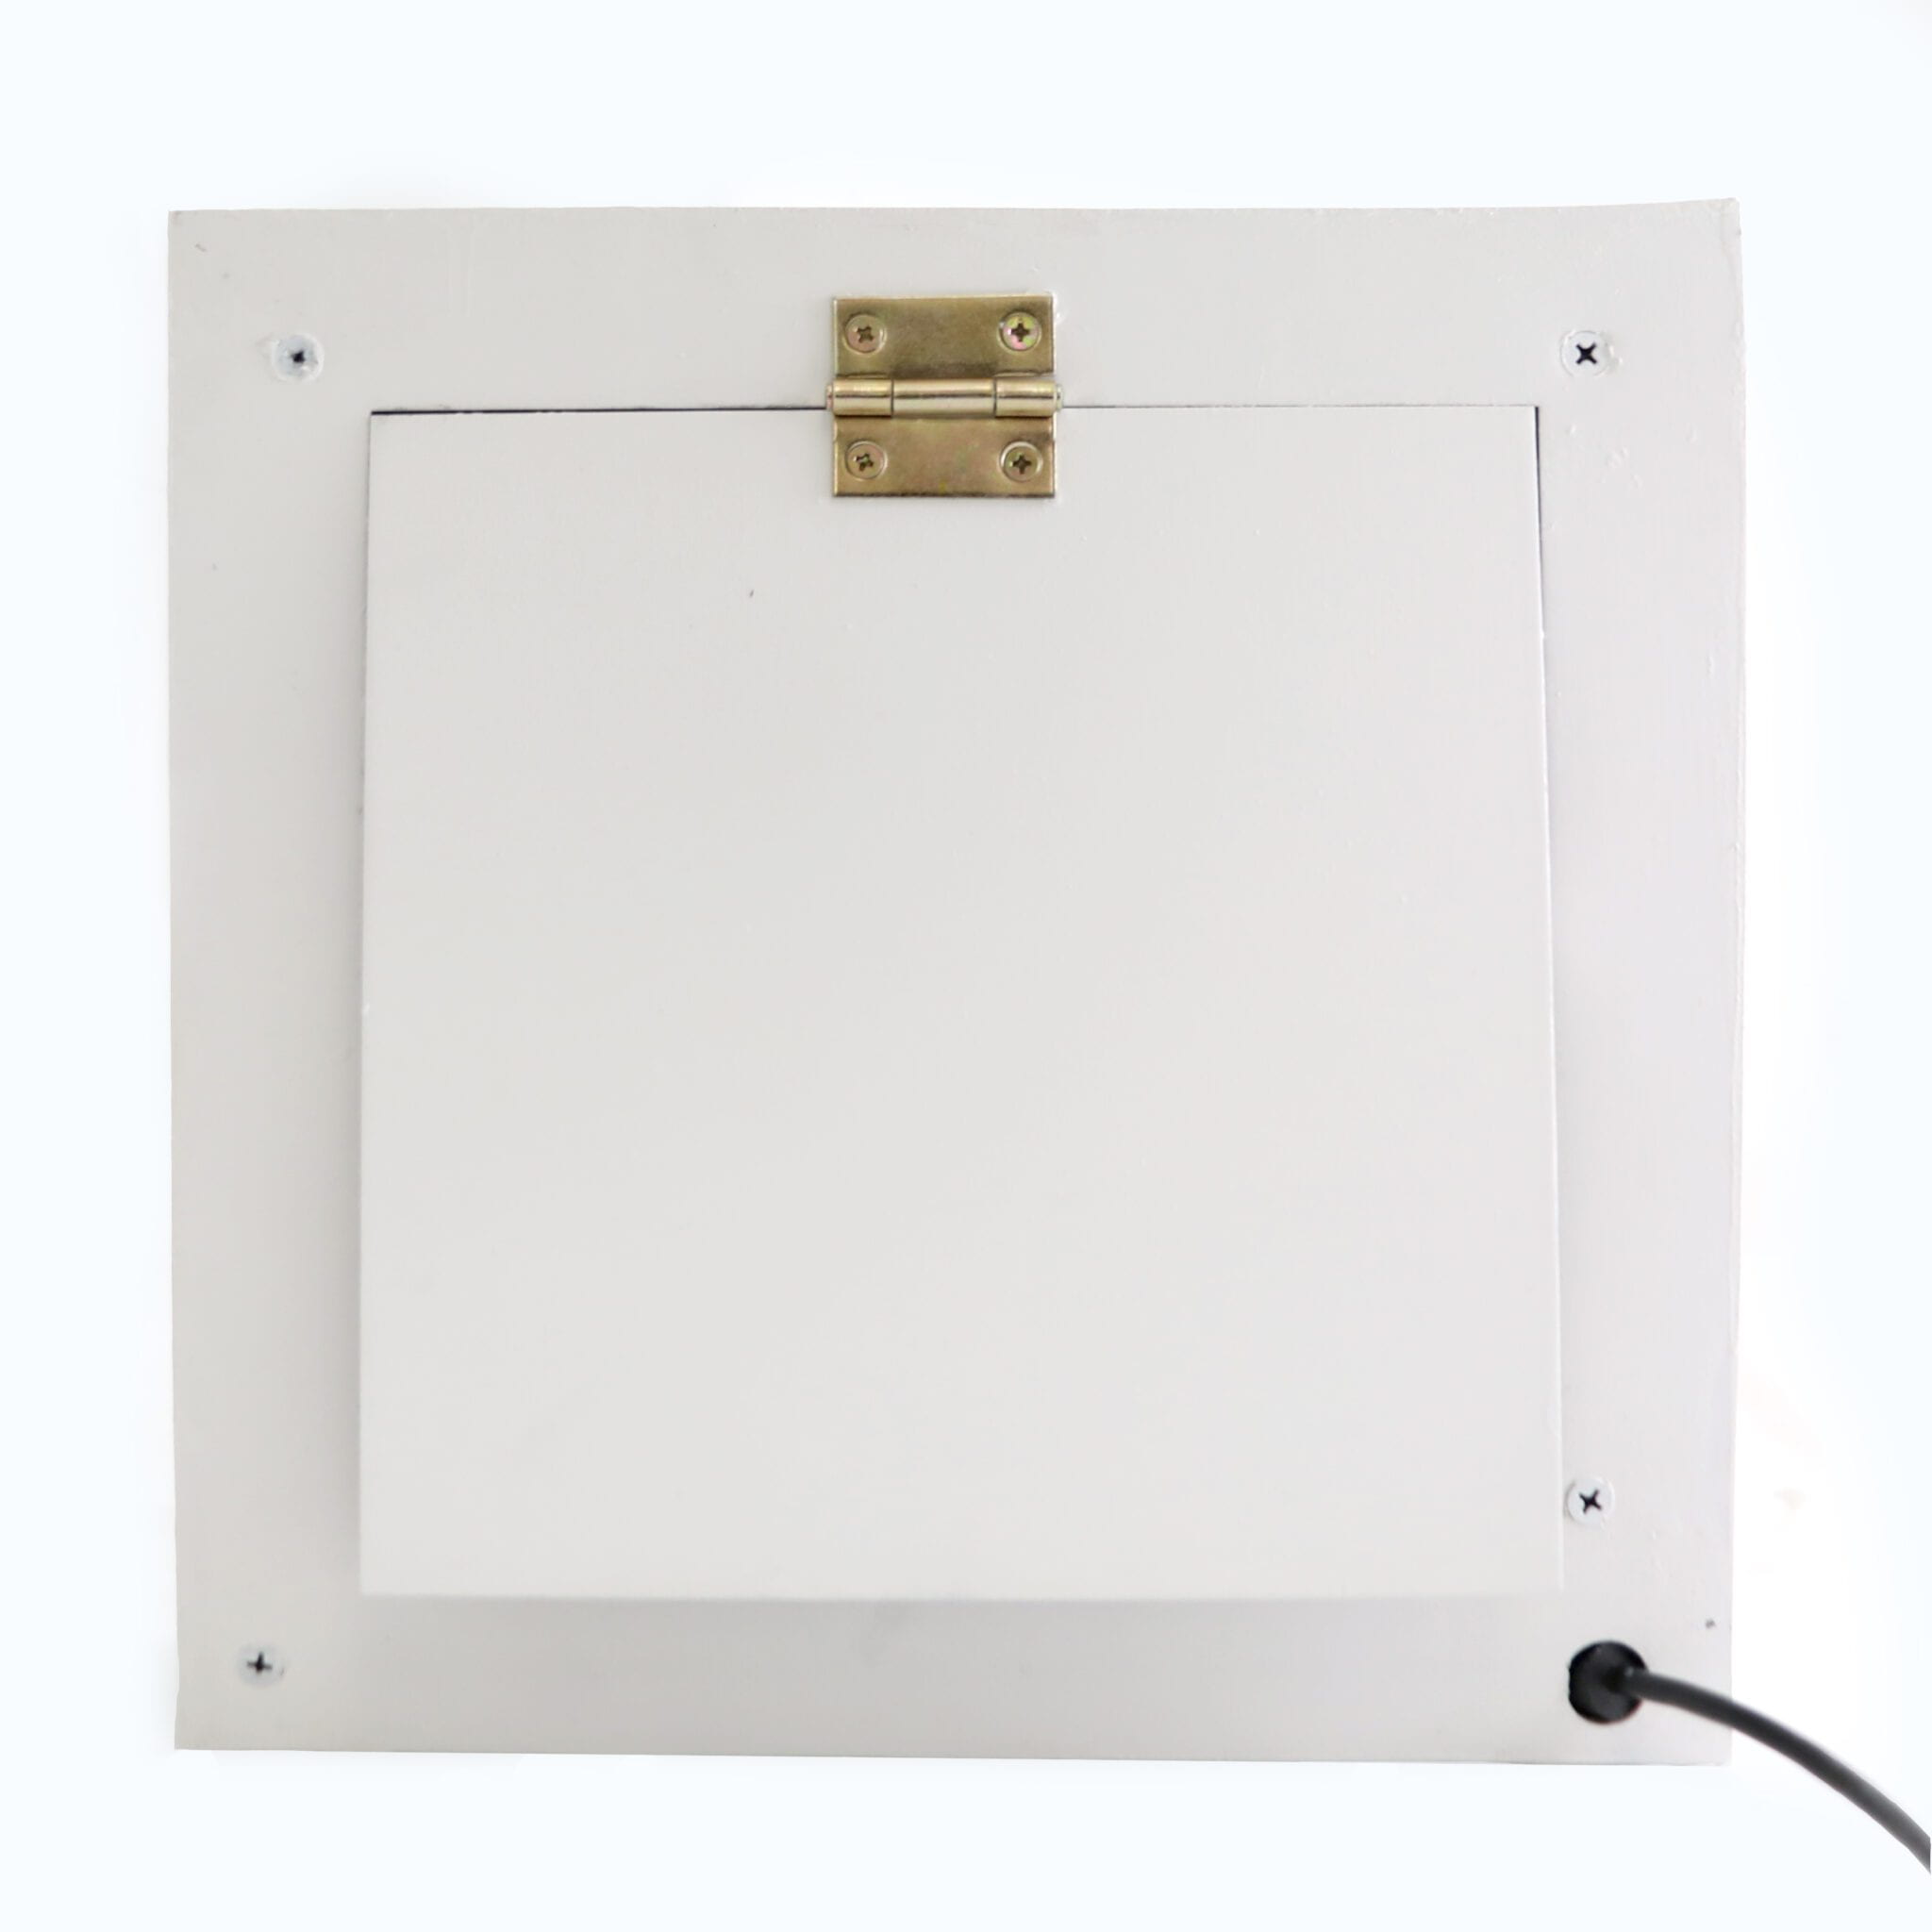
I also want to include a compartment on the back that has an explanation document. 

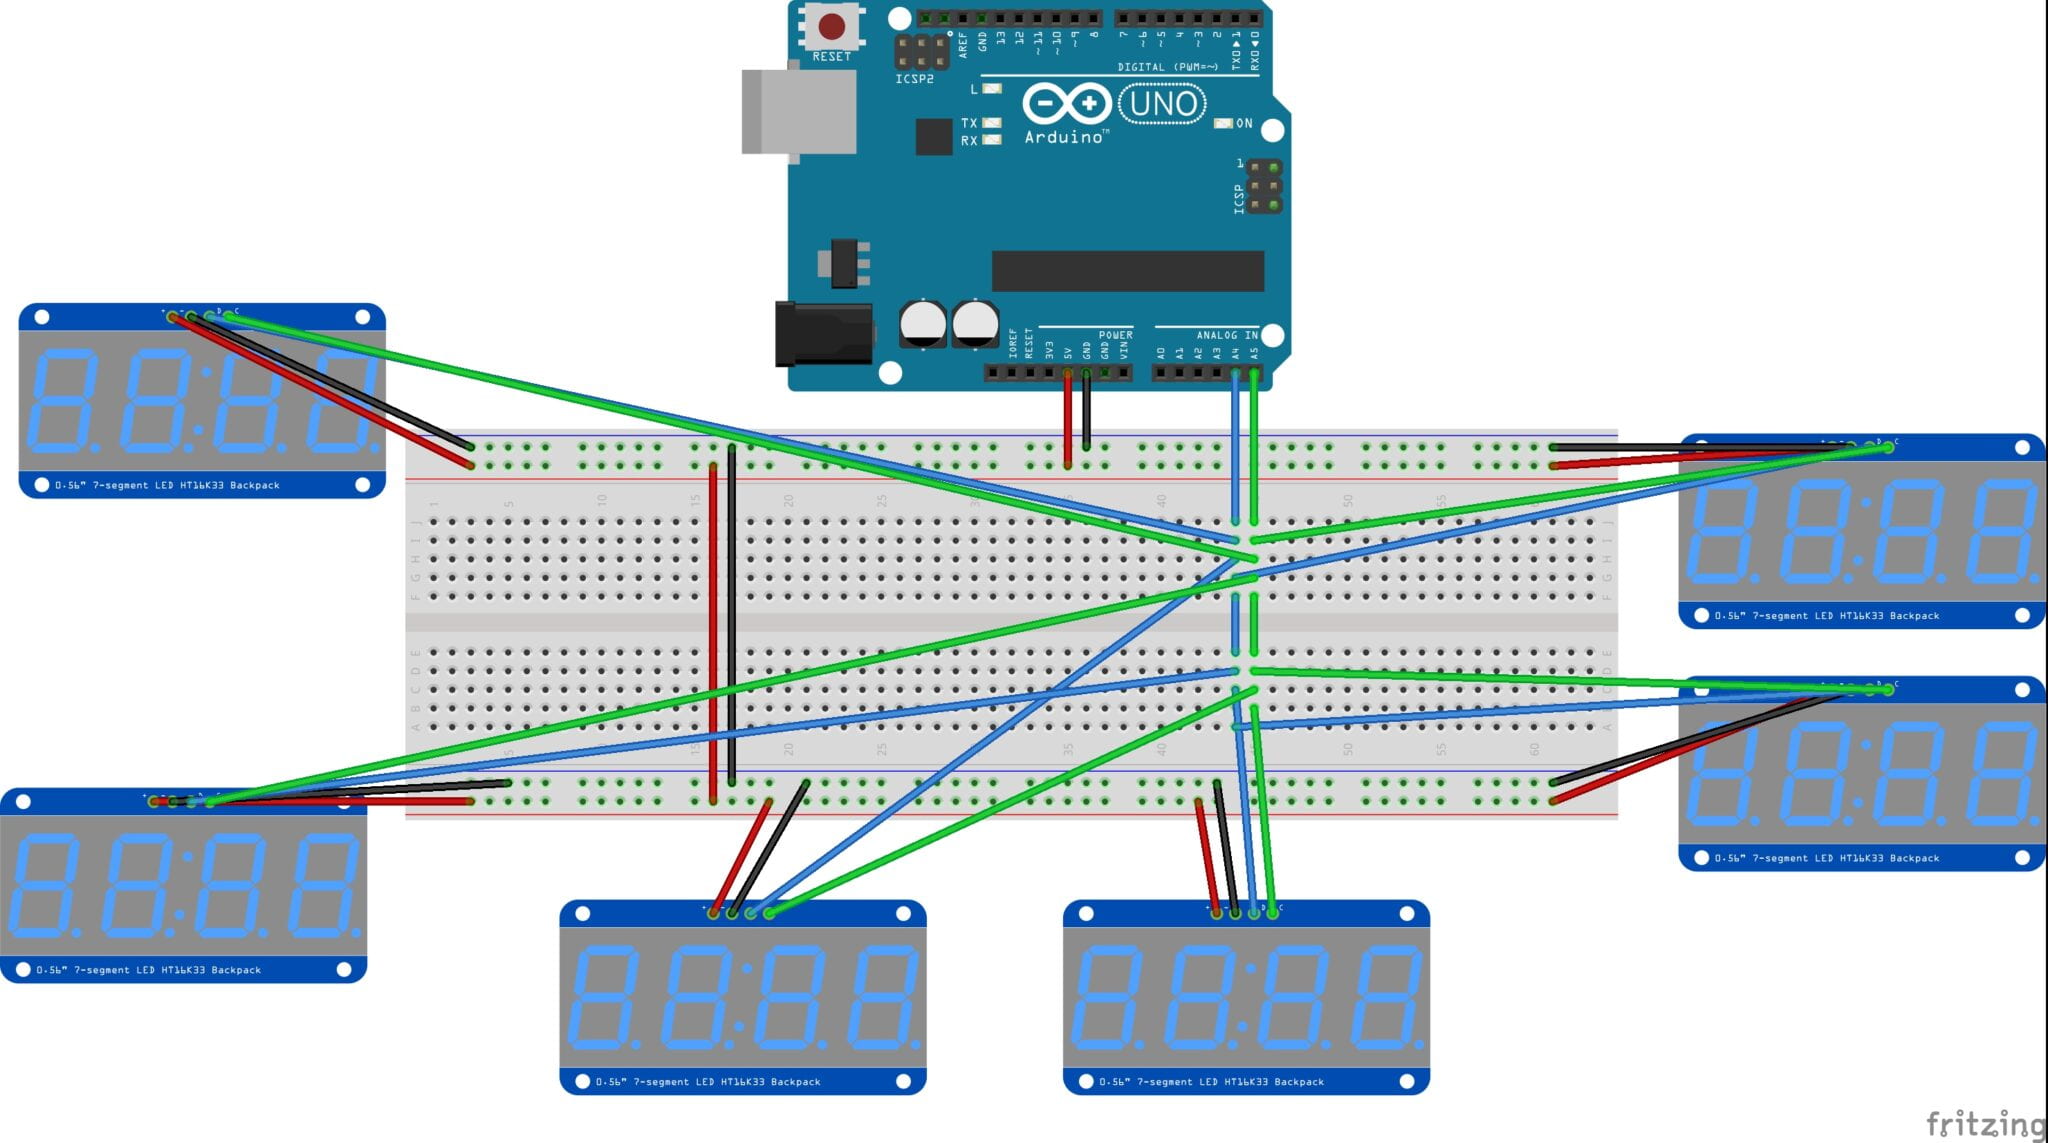
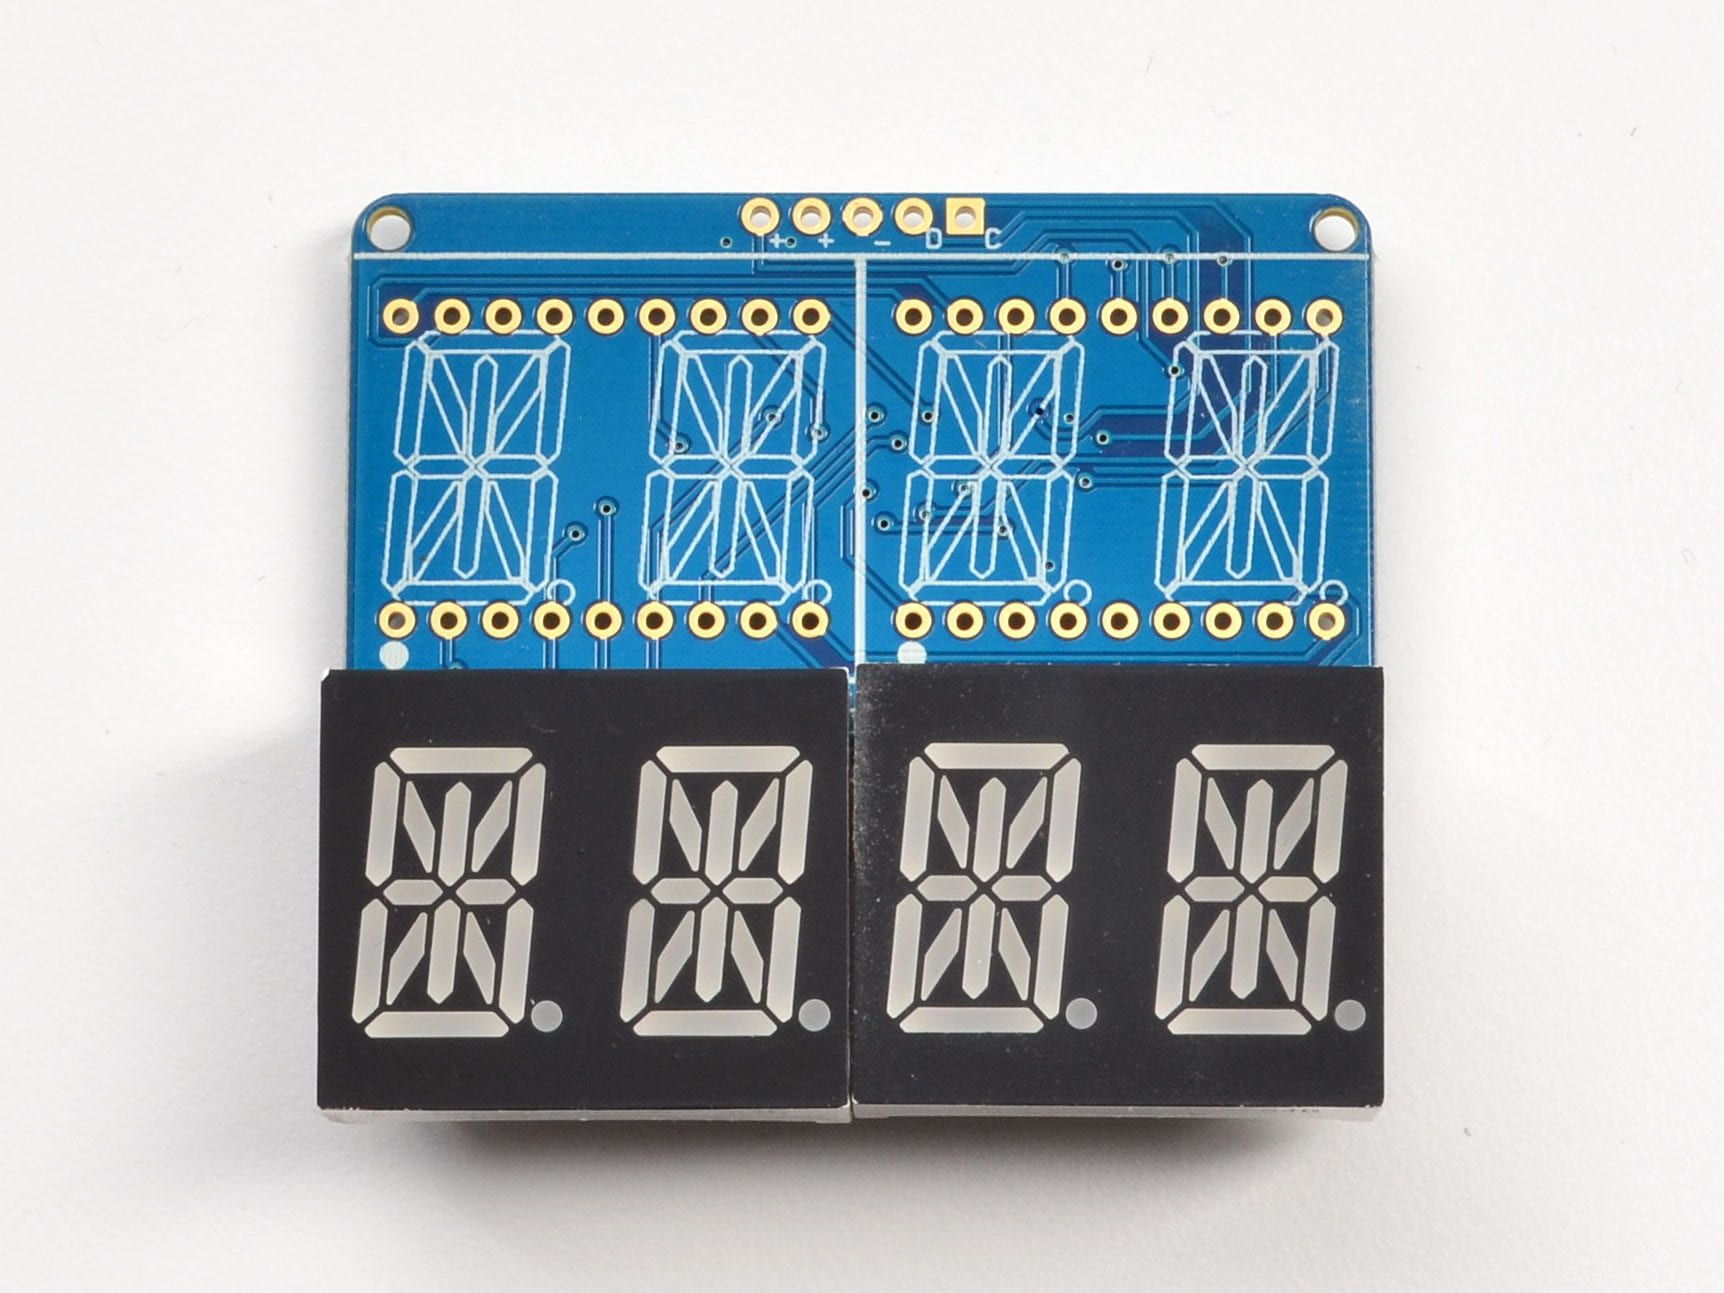
Next is to order my parts and study how to change 12C addresses on LED backpacks to run multiple LED panels on the same two pins.


First Sketch

I’ve been trying to wrap my head around the idea of time these past couple of weeks, but the topic is so complex that my mind wonders in multiple directions, and I can’t seem to focus on one particular aspect. So I thought it would be interesting to explore this confusion in my first sketch. I studied something that takes seconds to complete and something that takes billions of years.

Sketch 1- food coloring dripped into warm water and photographed at three frames a second for 40 seconds. 

Sketch 1A – P5JS sketch of a solar system spiraling; the background is a single frame from sketch 1. When I zoomed in to the individual frames, it reminded me of the milky way, which led me here. 


Exploring Time

I think a lot about threatened and endangered species and have been working on an interactive piece centered on the topic for several years. For the piece, the image fades based on the predicted extinction rate of the species. Viewers can bring the idea back by standing and looking at the photo. 

I want to continue to work with endangered species; however, for this new piece, I would like to move away from the use of images and build something that can be permanently displayed and not necessarily convey what it’s keeping time of unless the viewer investigates.